Automotive e-Axle Market Size, Share & Trends Analysis Report by Drive Type (Front e-Axle, Rear e-Axle, All-Wheel Drive (AWD) e-Axle), Propulsion Type, Power Output, Component, Integration Level, Cooling Technology, Vehicle Type, Sales Channel, and Geography (North America, Europe, Asia Pacific, Middle East, Africa, and South America) – Global Industry Data, Trends, and Forecasts, 2026–2035
|
|
|
Segmental Data Insights |
|
|
Demand Trends |
|
|
Competitive Landscape |
|
|
Strategic Development |
|
|
Future Outlook & Opportunities |
|
Automotive e-Axle Market Size, Share, and Growth
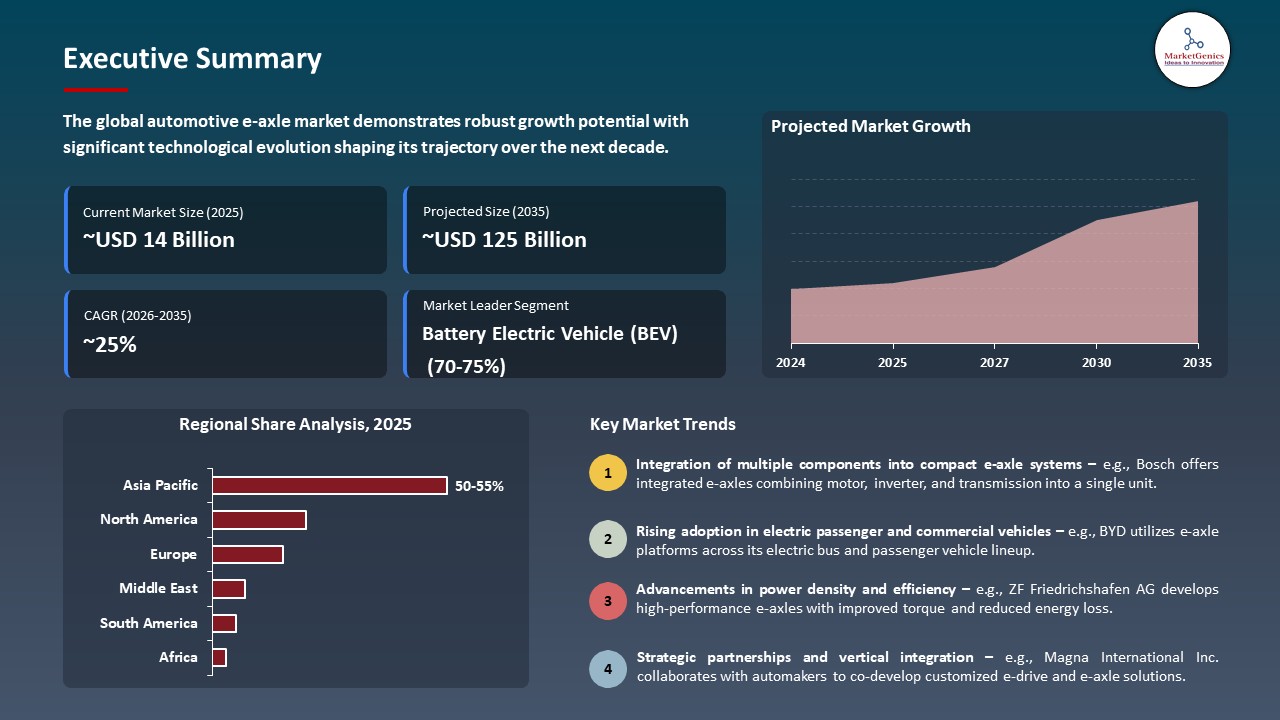
The global automotive e-axle market is exhibiting strong growth, with an estimated value of USD 13.8 billion in 2025 and USD 124.5 billion by 2035, achieving a CAGR of 24.6%, during the forecast period. The global automotive e-axle market is driven by rising EV adoption, strict emission norms, and demand for compact, efficient powertrain systems, supported by advancements in electrification technologies and OEM focus on high-performance, lightweight drivetrains.
Karsten Müller, Executive Vice President, Manufacturing and Quality, Electrified Motion, Robert Bosch GmbH, said, “India being world’s third largest automotive market, Bosch aims to leverage stronger opportunities for its business in India. This planned partnership with TACO further cements our presence in e-mobility, enabling us to deliver cutting edge global solutions locally in India including engineering and manufacturing expertise.”
Growing commitment levels from automotive OEMs and other major players to integrate the use of the integrated e axle system are propelling the market growth of electrified powertrains, driven by the efficiency, energy optimization, and scalable nature of the system. For example, in February 2026, ZF Friedrichshafen AG was awarded a contract to supply thousands of AxTrax 2 LF integrated electric portal axles to an Indian automotive OEM for battery-electric city buses, offering 20% energy savings and improved efficiency compared to previous solutions. The automotive OEM contracts are acting as catalysts to the commercial viability of the integrated e axle system, driving the growth of the electrified powertrain market.
Furthermore, the emphasis on the high efficiency of integrated e axle systems is propelling the growth of the market, driven by the performance, reliability, and adoption rate of advanced electrified powertrains. For example, in April 2025, ZF Friedrichshafen AG expanded its AxTrax 2 e axle solution for electric commercial vehicles to enhance the performance and energy efficiency of the solution. This emphasis on efficiency is expected to drive widespread adoption of advanced e-axle solutions, fueling overall market expansion.
Key adjacent opportunities to the global automotive e-axle market include electric powertrains, battery management systems, in-wheel motors, vehicle electrification software, and lightweight EV chassis components, enabling OEMs and suppliers to enhance efficiency, performance, and integration across electrified mobility solutions. These adjacent markets are expected to further accelerate e-axle adoption and overall EV market growth.
Automotive e-Axle Market Dynamics and Trends
Driver: Strategic Localization of E‑Axle Manufacturing Partnerships
-
The automotive e-axle industry is being driven by strategic localization initiatives undertaken by major players and regional manufacturers to improve production capacity, supply chain, and cost-effectiveness.
- The partnership is aimed at reducing supply chain risks, improving production costs, and delivering service to one of the largest and growing electric vehicle markets. For example, in March 2026, Bosch announced a joint venture with Tata AutoComp Systems Ltd to develop and locally manufacture e-axle systems and electric motors in India, with production scheduled to start in mid-2026.
- The localization strategy is aimed at improving production capacity and competitiveness for one of the largest and growing electric vehicle markets, and this is a move to reinforce the global supply chain and improve the regional footprint and adoption of integrated e-axle systems.
Restraint: High Capital Outlay for Electrified Drivetrain Transition
-
The transition from conventional drivetrain technologies to electrified drivetrain technologies is limited by high upfront capital costs associated with production retooling, technology development, and human resource upskilling. For conventional axle suppliers, there remains a major challenge in investing heavily in production retooling, state-of-the-art testing facilities, and skilled engineering resources required to deliver integrated e-axle technologies.
- The high capital cost, along with other cost issues such as limited availability of semiconductors and rare earth materials, will remain a major factor affecting short-term profitability and thereby increasing the rate of adoption of electrified drivetrain technologies, particularly for smaller tier-2 and tier-3 suppliers.
- As companies debate the risks associated with high upfront capital costs against fluctuating short-term demand in some regions, high upfront capital costs remain a major factor affecting short-term growth in the global e-axle drivetrain market.
Opportunity: Growth Potential in Commercial Electric Vehicle Platforms
-
The increase in commercial electric vehicle rollouts is creating significant opportunities for adjacent e-axle business. E-axles in commercial electric vehicles offer greater efficiency, regenerative capabilities, and optimized power density, making them suitable for urban transportation.
- For example, in February 2026, ZF Friedrichshafen AG signed a multi-year supply agreement for its AxTrax 2 LF electric portal axle with an Indian commercial vehicle manufacturer. It introduced a fully integrated low floor electric axle for city buses. So, the electric vehicle market is moving toward electrifying heavy-duty and mid-duty vehicles, thus providing opportunities for adjacent markets.
- Commercial electric vehicle adoption is not only creating greater order volume for e-axles but also providing economies of scale for suppliers of e-axles. The market for electric vehicles is providing greater market reach for e-axles, thus creating strong B2B opportunities for suppliers of e-axles.
Key Trend: Strategic Integration of E‑Axle Systems with Complete EV Powertrains
-
Implementing e-axle systems into complete EV powertrain and electrification ecosystems to improve overall performance while lowering system complexity is a significant industry trend. Leading vendors are increasingly providing bundled solutions that integrate e-axles with power electronics, thermal management systems, and sophisticated software controls, resulting in reduced vehicle weight, improved vehicle architecture, and increased energy efficiency.
- By offering comprehensive, system-level electrified powertrain solutions instead of standalone components, this trend allows OEMs to expedite platform development and reduce integration difficulties. Suppliers with extensive, integrated powertrain portfolios are gaining a competitive edge in the market as vehicles become more software-defined and electrified.
- System-level integration is promoting faster adoption of cutting-edge electrified mobility solutions, improving EV performance, and increasing value chain efficiency.
Automotive e-Axle Market Analysis and Segmental Data
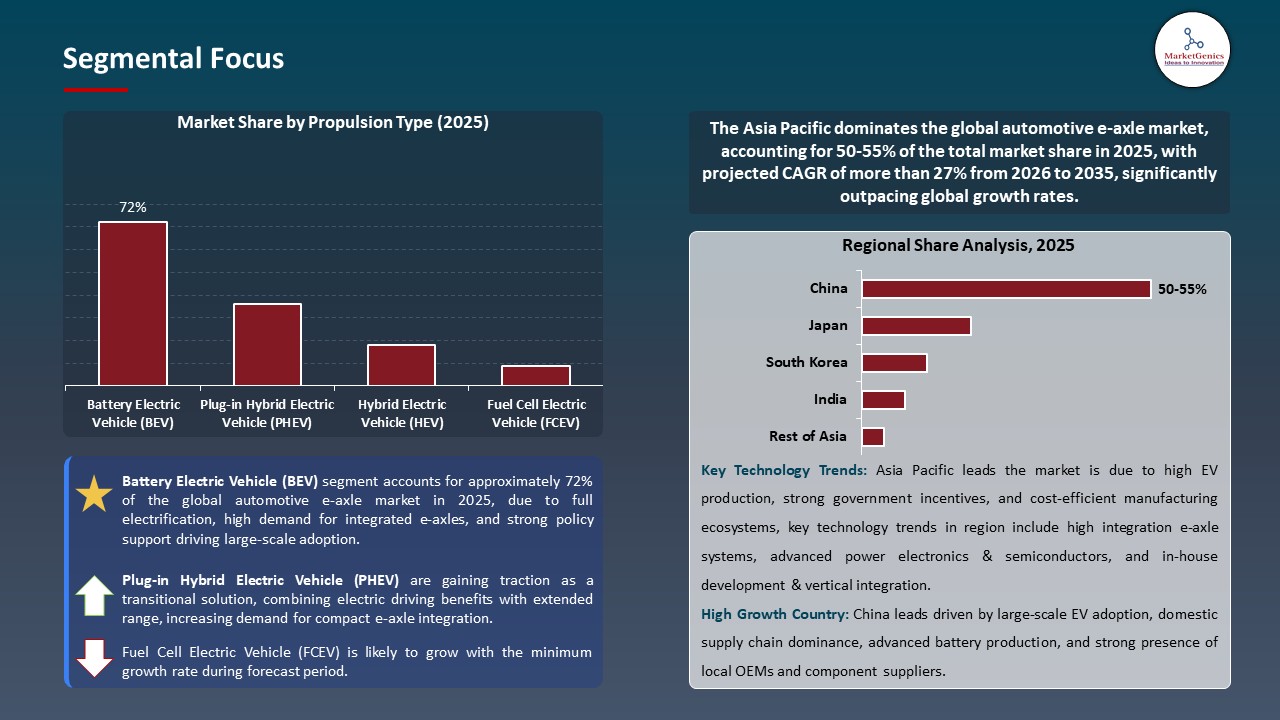
Battery Electric Vehicle (BEV) Dominate Global Automotive e-Axle Market
-
The battery electric vehicle (BEV) segment dominates the global automotive e-axle market is, which use integrated electric drive solutions instead of auxiliary electrification like hybrids or plug-in hybrids.
- High-efficiency, compact e-axle layouts that provide greater power density and drivetrain efficiency are necessary for BEVs. These architectures directly affect vehicle range and performance, which are important purchase factors for both OEMs and consumers.
- The demand for sophisticated integrated e-axle systems has grown in conjunction with the continued expansion of BEV adoption in key regions including China, Europe, and North America. For example, Nidec Corporation's e-axle traction motor systems have been mass-produced and installed in numerous BEV models globally, exhibiting broad commercial adoption and capacity across a wide range of electric passenger vehicles.
- BEV market dominance is reinforcing e‑axle demand and accelerating electrified drivetrain integration across global automotive platforms.
Asia Pacific Leads Global Automotive e-Axle Market Demand
-
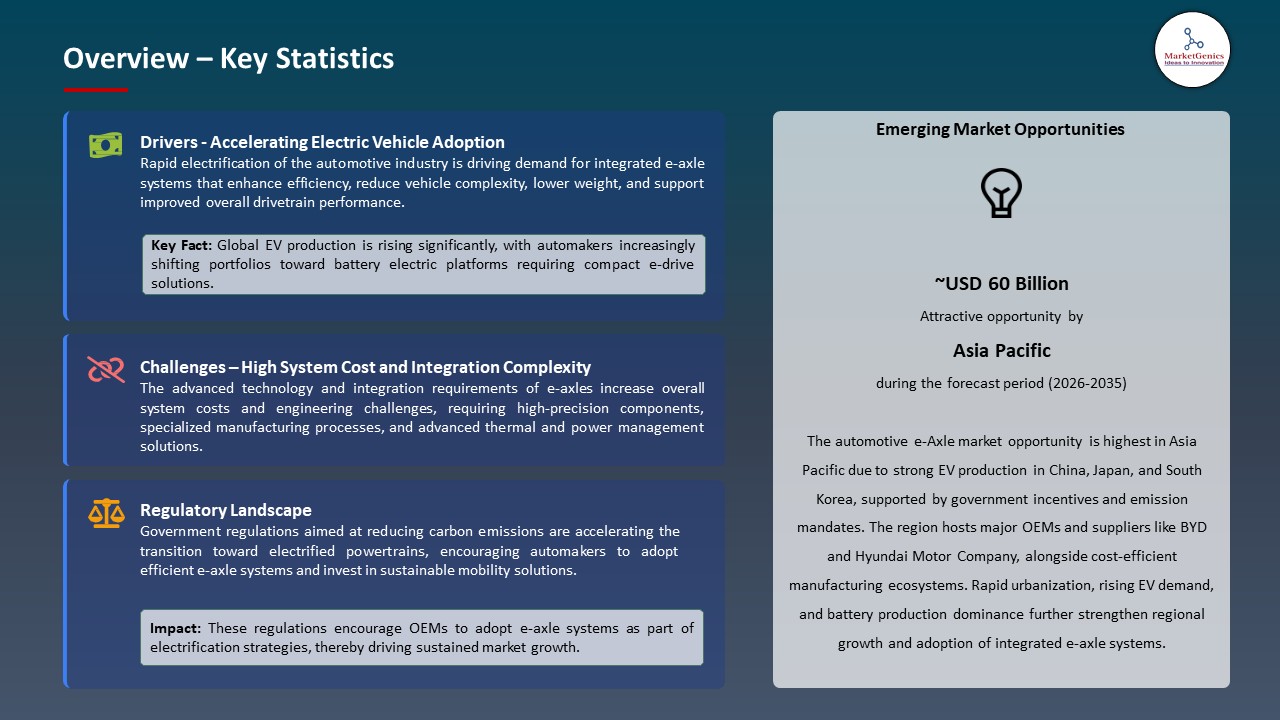
Asia Pacific leads the automotive e-Axle market due to its strong position in the manufacturing and sales of electric vehicles (EVs). Strong government incentives, strict emissions rules, and customer demand for electrified transportation have hastened the adoption of EVs in major economies like China, Japan, South Korea, and India. Asia Pacific is becoming the primary worldwide growth engine for e-axle systems as a result of manufacturers in the region integrating e-axles at scale to meet increasing BEV and hybrid production volumes.
- Additionally, leading automakers are also increasing their e-axle production capacity in Asia Pacific to meet local EV demand and reduce costs. For example, in June 2024, Musashi Delta e-Axle India Pvt. Ltd., started mass producing e-axles in India to serve local EV startups, such as Emobi, for two-wheeler e-mobility applications.
- Asia Pacific's localized e-axle production and quick EV adoption are boosting regional market expansion and bolstering the region's leadership in the global supply chain.
Automotive e-Axle Market Ecosystem
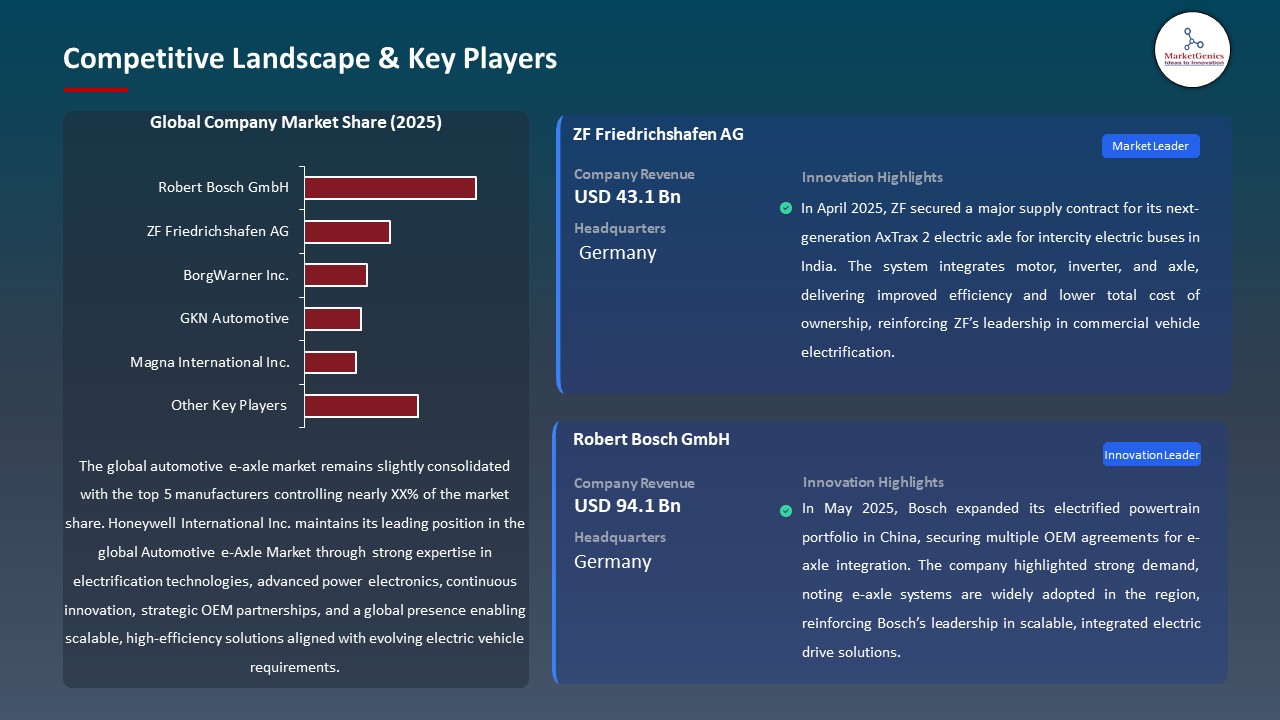
The global automotive e-axle market is slightly consolidated, with leading players such as Robert Bosch GmbH, ZF Friedrichshafen AG, BorgWarner Inc., GKN Automotive, and Magna International Inc. dominating through advanced electrification technologies, integrated powertrain solutions, and strong OEM partnerships. These companies leverage innovations in compact e-drive systems, power electronics, and high-efficiency transmission integration to maintain competitive advantage.
Key players are shifting focus to niche solutions such as 3-in-1 and 5-in-1 types of integrated e-axle solutions, silicon carbide-based inverters, and high-speed electric motors to improve performance and minimize energy loss. For example, industry players are developing modular solutions for e-axle platforms to be used in passenger vehicles, commercial vehicles, and off-highway applications. This is accelerating innovation and deployment flexibility for e-axle solutions in different types of vehicles.
Similarly, industry players are also shifting focus to product diversification and solution integration. They are developing solutions to integrate motors, inverters, and gear systems to provide solutions that improve range, reduce complexity, and increase efficiency. For example, in January 2024, Magna International Inc. launched an AI-enabled 800V eDrive solution with over 90% efficiency and high-power density. This is an example of how technology is being used to develop next-generation automotive e-axle solutions.
These advancements are accelerating EV adoption by enhancing drivetrain efficiency, reducing system complexity, and enabling cost-effective, high-performance electric mobility solutions across global automotive markets.
 Recent Development and Strategic Overview:
- In March 2026, Robert Bosch GmbH entered into a joint venture with Tata AutoComp Systems to manufacture e-axles and traction motors in India. This strategic initiative enhances localization, improves cost efficiency, strengthens supply chain resilience, and supports scalable growth in emerging EV markets, reinforcing Bosch’s regional expansion strategy.
- In August 2025, ZF Friedrichshafen AG introduced its TrailTrax solution integrating AxTrax 2 e-axles into trailer systems, enabling up to 16% CO₂ reduction. This development expands e-axle applications into hybrid truck-trailer configurations, improving energy recovery, operational efficiency, and sustainability in logistics operations.
Report Scope
|
Detail |
|
|
Market Size in 2025 |
USD 13.8 Bn |
|
Market Forecast Value in 2035 |
USD 124.5 Bn |
|
Growth Rate (CAGR) |
24.6% |
|
Forecast Period |
2026 – 2035 |
|
Historical Data Available for |
2021 – 2024 |
|
Market Size Units |
US$ Billion for Value Thousand Units for Volume |
|
Report Format |
Electronic (PDF) + Excel |
|
North America |
Europe |
Asia Pacific |
Middle East |
Africa |
South America |
|
|
|
|
|
|
|
Companies Covered |
|||||
|
|
|
|
|
|
Automotive e-Axle Market Segmentation and Highlights
|
Segment |
Sub-segment |
|
Automotive e-Axle Market, By Drive Type |
|
|
Automotive e-Axle Market, By Propulsion Type |
|
|
Automotive e-Axle Market, By Power Output |
|
|
Automotive e-Axle Market, By Component |
|
|
Automotive e-Axle Market, By Integration Level |
|
|
Automotive e-Axle Market, By Cooling Technology |
|
|
Automotive e-Axle Market, By Vehicle Type |
|
|
Automotive e-Axle Market, By Sales Channel |
|
Frequently Asked Questions
Table of Contents
- 1. Research Methodology and Assumptions
- 1.1. Definitions
- 1.2. Research Design and Approach
- 1.3. Data Collection Methods
- 1.4. Base Estimates and Calculations
- 1.5. Forecasting Models
- 1.5.1. Key Forecast Factors & Impact Analysis
- 1.6. Secondary Research
- 1.6.1. Open Sources
- 1.6.2. Paid Databases
- 1.6.3. Associations
- 1.7. Primary Research
- 1.7.1. Primary Sources
- 1.7.2. Primary Interviews with Stakeholders across Ecosystem
- 2. Executive Summary
- 2.1. Global Automotive e-Axle Market Outlook
- 2.1.1. Automotive e-Axle Market Size (Volume - Thousand Units and Value - US$ Bn), and Forecasts, 2021-2035
- 2.1.2. Compounded Annual Growth Rate Analysis
- 2.1.3. Growth Opportunity Analysis
- 2.1.4. Segmental Share Analysis
- 2.1.5. Geographical Share Analysis
- 2.2. Market Analysis and Facts
- 2.3. Supply-Demand Analysis
- 2.4. Competitive Benchmarking
- 2.5. Go-to- Market Strategy
- 2.5.1. Customer/ End-use Industry Assessment
- 2.5.2. Growth Opportunity Data, 2026-2035
- 2.5.2.1. Regional Data
- 2.5.2.2. Country Data
- 2.5.2.3. Segmental Data
- 2.5.3. Identification of Potential Market Spaces
- 2.5.4. GAP Analysis
- 2.5.5. Potential Attractive Price Points
- 2.5.6. Prevailing Market Risks & Challenges
- 2.5.7. Preferred Sales & Marketing Strategies
- 2.5.8. Key Recommendations and Analysis
- 2.5.9. A Way Forward
- 2.1. Global Automotive e-Axle Market Outlook
- 3. Industry Data and Premium Insights
- 3.1. Global Automotive & Transportation Industry Overview, 2025
- 3.1.1. Automotive & Transportation Ecosystem Analysis
- 3.1.2. Key Trends for Automotive & Transportation Industry
- 3.1.3. Regional Distribution for Automotive & Transportation Industry
- 3.2. Supplier Customer Data
- 3.3. Technology Roadmap and Developments
- 3.4. Trade Analysis
- 3.4.1. Import & Export Analysis, 2025
- 3.4.2. Top Importing Countries
- 3.4.3. Top Exporting Countries
- 3.5. Trump Tariff Impact Analysis
- 3.5.1. Manufacturer
- 3.5.1.1. Based on the component & Raw material
- 3.5.2. Supply Chain
- 3.5.3. End Consumer
- 3.5.1. Manufacturer
- 3.6. Raw Material Analysis
- 3.1. Global Automotive & Transportation Industry Overview, 2025
- 4. Market Overview
- 4.1. Market Dynamics
- 4.1.1. Drivers
- 4.1.1.1. Increasing global adoption and production of electric and hybrid vehicles
- 4.1.1.2. Growing demand for compact, integrated, and high-efficiency powertrain systems
- 4.1.1.3. Stringent emission regulations and government incentives promoting vehicle electrification
- 4.1.2. Restraints
- 4.1.2.1. High cost of e-axle systems and associated components
- 4.1.2.2. Supply chain constraints and raw material price volatility
- 4.1.1. Drivers
- 4.2. Key Trend Analysis
- 4.3. Regulatory Framework
- 4.3.1. Key Regulations, Norms, and Subsidies, by Key Countries
- 4.3.2. Tariffs and Standards
- 4.3.3. Impact Analysis of Regulations on the Market
- 4.4. Value Chain Analysis
- 4.4.1. Component Suppliers
- 4.4.2. e-Axle Manufacturers
- 4.4.3. System Integrators
- 4.4.4. Distribution & Logistics
- 4.4.5. End Users
- 4.5. Cost Structure Analysis
- 4.5.1. Parameter’s Share for Cost Associated
- 4.5.2. COGP vs COGS
- 4.5.3. Profit Margin Analysis
- 4.6. Pricing Analysis
- 4.6.1. Regional Pricing Analysis
- 4.6.2. Segmental Pricing Trends
- 4.6.3. Factors Influencing Pricing
- 4.7. Porter’s Five Forces Analysis
- 4.8. PESTEL Analysis
- 4.9. Global Automotive e-Axle Market Demand
- 4.9.1. Historical Market Size – in Volume (Thousand Units) and Value (US$ Bn), 2020-2024
- 4.9.2. Current and Future Market Size – in Volume (Thousand Units) and Value (US$ Bn), 2026–2035
- 4.9.2.1. Y-o-Y Growth Trends
- 4.9.2.2. Absolute $ Opportunity Assessment
- 4.1. Market Dynamics
- 5. Competition Landscape
- 5.1. Competition structure
- 5.1.1. Fragmented v/s consolidated
- 5.2. Company Share Analysis, 2025
- 5.2.1. Global Company Market Share
- 5.2.2. By Region
- 5.2.2.1. North America
- 5.2.2.2. Europe
- 5.2.2.3. Asia Pacific
- 5.2.2.4. Middle East
- 5.2.2.5. Africa
- 5.2.2.6. South America
- 5.3. Product Comparison Matrix
- 5.3.1. Specifications
- 5.3.2. Market Positioning
- 5.3.3. Pricing
- 5.1. Competition structure
- 6. Global Automotive e-Axle Market Analysis, by Drive Type
- 6.1. Key Segment Analysis
- 6.2. Automotive e-Axle Market Size (Volume - Thousand Units and Value - US$ Bn), Analysis, and Forecasts, by Drive Type, 2021-2035
- 6.2.1. Front e-Axle
- 6.2.2. Rear e-Axle
- 6.2.3. All-Wheel Drive (AWD) e-Axle
- 7. Global Automotive e-Axle Market Analysis, by Propulsion Type
- 7.1. Key Segment Analysis
- 7.2. Automotive e-Axle Market Size (Volume - Thousand Units and Value - US$ Bn), Analysis, and Forecasts, by Propulsion Type, 2021-2035
- 7.2.1. Battery Electric Vehicle (BEV)
- 7.2.2. Plug-in Hybrid Electric Vehicle (PHEV)
- 7.2.3. Hybrid Electric Vehicle (HEV)
- 7.2.4. Fuel Cell Electric Vehicle (FCEV)
- 8. Global Automotive e-Axle Market Analysis, by Power Output
- 8.1. Key Segment Analysis
- 8.2. Automotive e-Axle Market Size (Volume - Thousand Units and Value - US$ Bn), Analysis, and Forecasts, by Power Output, 2021-2035
- 8.2.1. Below 100 kW
- 8.2.2. 100 kW – 200 kW
- 8.2.3. 201 kW – 300 kW
- 8.2.4. Above 300 kW
- 9. Global Automotive e-Axle Market Analysis, by Component
- 9.1. Key Segment Analysis
- 9.2. Automotive e-Axle Market Size (Volume - Thousand Units and Value - US$ Bn), Analysis, and Forecasts, by Component, 2021-2035
- 9.2.1. Electric Motor
- 9.2.1.1. Permanent Magnet Synchronous Motor (PMSM)
- 9.2.1.2. Induction Motor
- 9.2.1.3. Switched Reluctance Motor
- 9.2.1.4. Others
- 9.2.2. Power Electronics / Inverter
- 9.2.2.1. Silicon-based Inverter
- 9.2.2.2. Silicon Carbide (SiC) Inverter
- 9.2.2.3. Others
- 9.2.3. Gearbox / Transmission
- 9.2.3.1. Single-Speed Gearbox
- 9.2.3.2. Multi-Speed Gearbox
- 9.2.4. Mechanical Differential
- 9.2.5. Control Unit / ECU
- 9.2.6. Thermal Management System
- 9.2.7. Braking System Integration
- 9.2.8. Other Components
- 9.2.1. Electric Motor
- 10. Global Automotive e-Axle Market Analysis, by Integration Level
- 10.1. Key Segment Analysis
- 10.2. Automotive e-Axle Market Size (Volume - Thousand Units and Value - US$ Bn), Analysis, and Forecasts, by Integration Level, 2021-2035
- 10.2.1. 2-in-1 (Motor + Gearbox)
- 10.2.2. 3-in-1 (Motor + Gearbox + Inverter)
- 10.2.3. 4-in-1 (Motor + Gearbox + Inverter + Control Unit)
- 11. Global Automotive e-Axle Market Analysis, by Cooling Technology
- 11.1. Key Segment Analysis
- 11.2. Automotive e-Axle Market Size (Volume - Thousand Units and Value - US$ Bn), Analysis, and Forecasts, by Cooling Technology, 2021-2035
- 11.2.1. Air Cooling
- 11.2.2. Liquid Cooling
- 11.2.3. Oil Cooling / Immersion Cooling
- 11.2.4. Hybrid Cooling Systems
- 12. Global Automotive e-Axle Market Analysis, by Vehicle Type
- 12.1. Key Segment Analysis
- 12.2. Automotive e-Axle Market Size (Volume - Thousand Units and Value - US$ Bn), Analysis, and Forecasts, by Vehicle Type, 2021-2035
- 12.2.1. Passenger Cars
- 12.2.1.1. Hatchback
- 12.2.1.2. Sedan
- 12.2.1.3. SUV / Crossover
- 12.2.1.4. Sports Car
- 12.2.2. Light Commercial Vehicles (LCV)
- 12.2.3. Medium & Heavy Commercial Vehicles
- 12.2.3.1. Trucks
- 12.2.3.2. Buses & Coaches
- 12.2.4. Off-Highway Vehicles
- 12.2.5. Construction Equipment
- 12.2.6. Agricultural Machinery
- 12.2.1. Passenger Cars
- 13. Global Automotive e-Axle Market Analysis, by Sales Channel
- 13.1. Key Segment Analysis
- 13.2. Automotive e-Axle Market Size (Volume - Thousand Units and Value - US$ Bn), Analysis, and Forecasts, by Sales Channel, 2021-2035
- 13.2.1. OEM / Direct Supply
- 13.2.2. Tier-1 Supplier Integration
- 13.2.3. Aftermarket / Retrofit
- 14. Global Automotive e-Axle Market Analysis, by Region
- 14.1. Key Findings
- 14.2. Automotive e-Axle Market Size (Volume - Thousand Units and Value - US$ Bn), Analysis, and Forecasts, by Region, 2021-2035
- 14.2.1. North America
- 14.2.2. Europe
- 14.2.3. Asia Pacific
- 14.2.4. Middle East
- 14.2.5. Africa
- 14.2.6. South America
- 15. North America Automotive e-Axle Market Analysis
- 15.1. Key Segment Analysis
- 15.2. Regional Snapshot
- 15.3. North America Automotive e-Axle Market Size (Volume - Thousand Units and Value - US$ Bn), Analysis, and Forecasts, 2021-2035
- 15.3.1. Drive Type
- 15.3.2. Propulsion Type
- 15.3.3. Power Output
- 15.3.4. Component
- 15.3.5. Integration Level
- 15.3.6. Cooling Technology
- 15.3.7. Vehicle Type
- 15.3.8. Sales Channel
- 15.3.9. Country
- 15.3.9.1. USA
- 15.3.9.2. Canada
- 15.3.9.3. Mexico
- 15.4. USA Automotive e-Axle Market
- 15.4.1. Country Segmental Analysis
- 15.4.2. Drive Type
- 15.4.3. Propulsion Type
- 15.4.4. Power Output
- 15.4.5. Component
- 15.4.6. Integration Level
- 15.4.7. Cooling Technology
- 15.4.8. Vehicle Type
- 15.4.9. Sales Channel
- 15.5. Canada Automotive e-Axle Market
- 15.5.1. Country Segmental Analysis
- 15.5.2. Drive Type
- 15.5.3. Propulsion Type
- 15.5.4. Power Output
- 15.5.5. Component
- 15.5.6. Integration Level
- 15.5.7. Cooling Technology
- 15.5.8. Vehicle Type
- 15.5.9. Sales Channel
- 15.6. Mexico Automotive e-Axle Market
- 15.6.1. Country Segmental Analysis
- 15.6.2. Drive Type
- 15.6.3. Propulsion Type
- 15.6.4. Power Output
- 15.6.5. Component
- 15.6.6. Integration Level
- 15.6.7. Cooling Technology
- 15.6.8. Vehicle Type
- 15.6.9. Sales Channel
- 16. Europe Automotive e-Axle Market Analysis
- 16.1. Key Segment Analysis
- 16.2. Regional Snapshot
- 16.3. Europe Automotive e-Axle Market Size (Volume - Thousand Units and Value - US$ Bn), Analysis, and Forecasts, 2021-2035
- 16.3.1. Drive Type
- 16.3.2. Propulsion Type
- 16.3.3. Power Output
- 16.3.4. Component
- 16.3.5. Integration Level
- 16.3.6. Cooling Technology
- 16.3.7. Vehicle Type
- 16.3.8. Sales Channel
- 16.3.9. Country
- 16.3.9.1. Germany
- 16.3.9.2. United Kingdom
- 16.3.9.3. France
- 16.3.9.4. Italy
- 16.3.9.5. Spain
- 16.3.9.6. Netherlands
- 16.3.9.7. Nordic Countries
- 16.3.9.8. Poland
- 16.3.9.9. Russia & CIS
- 16.3.9.10. Rest of Europe
- 16.4. Germany Automotive e-Axle Market
- 16.4.1. Country Segmental Analysis
- 16.4.2. Drive Type
- 16.4.3. Propulsion Type
- 16.4.4. Power Output
- 16.4.5. Component
- 16.4.6. Integration Level
- 16.4.7. Cooling Technology
- 16.4.8. Vehicle Type
- 16.4.9. Sales Channel
- 16.5. United Kingdom Automotive e-Axle Market
- 16.5.1. Country Segmental Analysis
- 16.5.2. Drive Type
- 16.5.3. Propulsion Type
- 16.5.4. Power Output
- 16.5.5. Component
- 16.5.6. Integration Level
- 16.5.7. Cooling Technology
- 16.5.8. Vehicle Type
- 16.5.9. Sales Channel
- 16.6. France Automotive e-Axle Market
- 16.6.1. Country Segmental Analysis
- 16.6.2. Drive Type
- 16.6.3. Propulsion Type
- 16.6.4. Power Output
- 16.6.5. Component
- 16.6.6. Integration Level
- 16.6.7. Cooling Technology
- 16.6.8. Vehicle Type
- 16.6.9. Sales Channel
- 16.7. Italy Automotive e-Axle Market
- 16.7.1. Country Segmental Analysis
- 16.7.2. Drive Type
- 16.7.3. Propulsion Type
- 16.7.4. Power Output
- 16.7.5. Component
- 16.7.6. Integration Level
- 16.7.7. Cooling Technology
- 16.7.8. Vehicle Type
- 16.7.9. Sales Channel
- 16.8. Spain Automotive e-Axle Market
- 16.8.1. Country Segmental Analysis
- 16.8.2. Drive Type
- 16.8.3. Propulsion Type
- 16.8.4. Power Output
- 16.8.5. Component
- 16.8.6. Integration Level
- 16.8.7. Cooling Technology
- 16.8.8. Vehicle Type
- 16.8.9. Sales Channel
- 16.9. Netherlands Automotive e-Axle Market
- 16.9.1. Country Segmental Analysis
- 16.9.2. Drive Type
- 16.9.3. Propulsion Type
- 16.9.4. Power Output
- 16.9.5. Component
- 16.9.6. Integration Level
- 16.9.7. Cooling Technology
- 16.9.8. Vehicle Type
- 16.9.9. Sales Channel
- 16.10. Nordic Countries Automotive e-Axle Market
- 16.10.1. Country Segmental Analysis
- 16.10.2. Drive Type
- 16.10.3. Propulsion Type
- 16.10.4. Power Output
- 16.10.5. Component
- 16.10.6. Integration Level
- 16.10.7. Cooling Technology
- 16.10.8. Vehicle Type
- 16.10.9. Sales Channel
- 16.11. Poland Automotive e-Axle Market
- 16.11.1. Country Segmental Analysis
- 16.11.2. Drive Type
- 16.11.3. Propulsion Type
- 16.11.4. Power Output
- 16.11.5. Component
- 16.11.6. Integration Level
- 16.11.7. Cooling Technology
- 16.11.8. Vehicle Type
- 16.11.9. Sales Channel
- 16.12. Russia & CIS Automotive e-Axle Market
- 16.12.1. Country Segmental Analysis
- 16.12.2. Drive Type
- 16.12.3. Propulsion Type
- 16.12.4. Power Output
- 16.12.5. Component
- 16.12.6. Integration Level
- 16.12.7. Cooling Technology
- 16.12.8. Vehicle Type
- 16.12.9. Sales Channel
- 16.13. Rest of Europe Automotive e-Axle Market
- 16.13.1. Country Segmental Analysis
- 16.13.2. Drive Type
- 16.13.3. Propulsion Type
- 16.13.4. Power Output
- 16.13.5. Component
- 16.13.6. Integration Level
- 16.13.7. Cooling Technology
- 16.13.8. Vehicle Type
- 16.13.9. Sales Channel
- 17. Asia Pacific Automotive e-Axle Market Analysis
- 17.1. Key Segment Analysis
- 17.2. Regional Snapshot
- 17.3. Asia Pacific Automotive e-Axle Market Size (Volume - Thousand Units and Value - US$ Bn), Analysis, and Forecasts, 2021-2035
- 17.3.1. Drive Type
- 17.3.2. Propulsion Type
- 17.3.3. Power Output
- 17.3.4. Component
- 17.3.5. Integration Level
- 17.3.6. Cooling Technology
- 17.3.7. Vehicle Type
- 17.3.8. Sales Channel
- 17.3.9. Country
- 17.3.9.1. China
- 17.3.9.2. India
- 17.3.9.3. Japan
- 17.3.9.4. South Korea
- 17.3.9.5. Australia and New Zealand
- 17.3.9.6. Indonesia
- 17.3.9.7. Malaysia
- 17.3.9.8. Thailand
- 17.3.9.9. Vietnam
- 17.3.9.10. Rest of Asia Pacific
- 17.4. China Automotive e-Axle Market
- 17.4.1. Country Segmental Analysis
- 17.4.2. Drive Type
- 17.4.3. Propulsion Type
- 17.4.4. Power Output
- 17.4.5. Component
- 17.4.6. Integration Level
- 17.4.7. Cooling Technology
- 17.4.8. Vehicle Type
- 17.4.9. Sales Channel
- 17.5. India Automotive e-Axle Market
- 17.5.1. Country Segmental Analysis
- 17.5.2. Drive Type
- 17.5.3. Propulsion Type
- 17.5.4. Power Output
- 17.5.5. Component
- 17.5.6. Integration Level
- 17.5.7. Cooling Technology
- 17.5.8. Vehicle Type
- 17.5.9. Sales Channel
- 17.6. Japan Automotive e-Axle Market
- 17.6.1. Country Segmental Analysis
- 17.6.2. Drive Type
- 17.6.3. Propulsion Type
- 17.6.4. Power Output
- 17.6.5. Component
- 17.6.6. Integration Level
- 17.6.7. Cooling Technology
- 17.6.8. Vehicle Type
- 17.6.9. Sales Channel
- 17.7. South Korea Automotive e-Axle Market
- 17.7.1. Country Segmental Analysis
- 17.7.2. Drive Type
- 17.7.3. Propulsion Type
- 17.7.4. Power Output
- 17.7.5. Component
- 17.7.6. Integration Level
- 17.7.7. Cooling Technology
- 17.7.8. Vehicle Type
- 17.7.9. Sales Channel
- 17.8. Australia and New Zealand Automotive e-Axle Market
- 17.8.1. Country Segmental Analysis
- 17.8.2. Drive Type
- 17.8.3. Propulsion Type
- 17.8.4. Power Output
- 17.8.5. Component
- 17.8.6. Integration Level
- 17.8.7. Cooling Technology
- 17.8.8. Vehicle Type
- 17.8.9. Sales Channel
- 17.9. Indonesia Automotive e-Axle Market
- 17.9.1. Country Segmental Analysis
- 17.9.2. Drive Type
- 17.9.3. Propulsion Type
- 17.9.4. Power Output
- 17.9.5. Component
- 17.9.6. Integration Level
- 17.9.7. Cooling Technology
- 17.9.8. Vehicle Type
- 17.9.9. Sales Channel
- 17.10. Malaysia Automotive e-Axle Market
- 17.10.1. Country Segmental Analysis
- 17.10.2. Drive Type
- 17.10.3. Propulsion Type
- 17.10.4. Power Output
- 17.10.5. Component
- 17.10.6. Integration Level
- 17.10.7. Cooling Technology
- 17.10.8. Vehicle Type
- 17.10.9. Sales Channel
- 17.11. Thailand Automotive e-Axle Market
- 17.11.1. Country Segmental Analysis
- 17.11.2. Drive Type
- 17.11.3. Propulsion Type
- 17.11.4. Power Output
- 17.11.5. Component
- 17.11.6. Integration Level
- 17.11.7. Cooling Technology
- 17.11.8. Vehicle Type
- 17.11.9. Sales Channel
- 17.12. Vietnam Automotive e-Axle Market
- 17.12.1. Country Segmental Analysis
- 17.12.2. Drive Type
- 17.12.3. Propulsion Type
- 17.12.4. Power Output
- 17.12.5. Component
- 17.12.6. Integration Level
- 17.12.7. Cooling Technology
- 17.12.8. Vehicle Type
- 17.12.9. Sales Channel
- 17.13. Rest of Asia Pacific Automotive e-Axle Market
- 17.13.1. Country Segmental Analysis
- 17.13.2. Drive Type
- 17.13.3. Propulsion Type
- 17.13.4. Power Output
- 17.13.5. Component
- 17.13.6. Integration Level
- 17.13.7. Cooling Technology
- 17.13.8. Vehicle Type
- 17.13.9. Sales Channel
- 18. Middle East Automotive e-Axle Market Analysis
- 18.1. Key Segment Analysis
- 18.2. Regional Snapshot
- 18.3. Middle East Automotive e-Axle Market Size (Volume - Thousand Units and Value - US$ Bn), Analysis, and Forecasts, 2021-2035
- 18.3.1. Drive Type
- 18.3.2. Propulsion Type
- 18.3.3. Power Output
- 18.3.4. Component
- 18.3.5. Integration Level
- 18.3.6. Cooling Technology
- 18.3.7. Vehicle Type
- 18.3.8. Sales Channel
- 18.3.9. Country
- 18.3.9.1. Turkey
- 18.3.9.2. UAE
- 18.3.9.3. Saudi Arabia
- 18.3.9.4. Israel
- 18.3.9.5. Rest of Middle East
- 18.4. Turkey Automotive e-Axle Market
- 18.4.1. Country Segmental Analysis
- 18.4.2. Drive Type
- 18.4.3. Propulsion Type
- 18.4.4. Power Output
- 18.4.5. Component
- 18.4.6. Integration Level
- 18.4.7. Cooling Technology
- 18.4.8. Vehicle Type
- 18.4.9. Sales Channel
- 18.5. UAE Automotive e-Axle Market
- 18.5.1. Country Segmental Analysis
- 18.5.2. Drive Type
- 18.5.3. Propulsion Type
- 18.5.4. Power Output
- 18.5.5. Component
- 18.5.6. Integration Level
- 18.5.7. Cooling Technology
- 18.5.8. Vehicle Type
- 18.5.9. Sales Channel
- 18.6. Saudi Arabia Automotive e-Axle Market
- 18.6.1. Country Segmental Analysis
- 18.6.2. Drive Type
- 18.6.3. Propulsion Type
- 18.6.4. Power Output
- 18.6.5. Component
- 18.6.6. Integration Level
- 18.6.7. Cooling Technology
- 18.6.8. Vehicle Type
- 18.6.9. Sales Channel
- 18.7. Israel Automotive e-Axle Market
- 18.7.1. Country Segmental Analysis
- 18.7.2. Drive Type
- 18.7.3. Propulsion Type
- 18.7.4. Power Output
- 18.7.5. Component
- 18.7.6. Integration Level
- 18.7.7. Cooling Technology
- 18.7.8. Vehicle Type
- 18.7.9. Sales Channel
- 18.8. Rest of Middle East Automotive e-Axle Market
- 18.8.1. Country Segmental Analysis
- 18.8.2. Drive Type
- 18.8.3. Propulsion Type
- 18.8.4. Power Output
- 18.8.5. Component
- 18.8.6. Integration Level
- 18.8.7. Cooling Technology
- 18.8.8. Vehicle Type
- 18.8.9. Sales Channel
- 19. Africa Automotive e-Axle Market Analysis
- 19.1. Key Segment Analysis
- 19.2. Regional Snapshot
- 19.3. Africa Automotive e-Axle Market Size (Volume - Thousand Units and Value - US$ Bn), Analysis, and Forecasts, 2021-2035
- 19.3.1. Drive Type
- 19.3.2. Propulsion Type
- 19.3.3. Power Output
- 19.3.4. Component
- 19.3.5. Integration Level
- 19.3.6. Cooling Technology
- 19.3.7. Vehicle Type
- 19.3.8. Sales Channel
- 19.3.9. Country
- 19.3.9.1. South Africa
- 19.3.9.2. Egypt
- 19.3.9.3. Nigeria
- 19.3.9.4. Algeria
- 19.3.9.5. Rest of Africa
- 19.4. South Africa Automotive e-Axle Market
- 19.4.1. Country Segmental Analysis
- 19.4.2. Drive Type
- 19.4.3. Propulsion Type
- 19.4.4. Power Output
- 19.4.5. Component
- 19.4.6. Integration Level
- 19.4.7. Cooling Technology
- 19.4.8. Vehicle Type
- 19.4.9. Sales Channel
- 19.5. Egypt Automotive e-Axle Market
- 19.5.1. Country Segmental Analysis
- 19.5.2. Drive Type
- 19.5.3. Propulsion Type
- 19.5.4. Power Output
- 19.5.5. Component
- 19.5.6. Integration Level
- 19.5.7. Cooling Technology
- 19.5.8. Vehicle Type
- 19.5.9. Sales Channel
- 19.6. Nigeria Automotive e-Axle Market
- 19.6.1. Country Segmental Analysis
- 19.6.2. Drive Type
- 19.6.3. Propulsion Type
- 19.6.4. Power Output
- 19.6.5. Component
- 19.6.6. Integration Level
- 19.6.7. Cooling Technology
- 19.6.8. Vehicle Type
- 19.6.9. Sales Channel
- 19.7. Algeria Automotive e-Axle Market
- 19.7.1. Country Segmental Analysis
- 19.7.2. Drive Type
- 19.7.3. Propulsion Type
- 19.7.4. Power Output
- 19.7.5. Component
- 19.7.6. Integration Level
- 19.7.7. Cooling Technology
- 19.7.8. Vehicle Type
- 19.7.9. Sales Channel
- 19.8. Rest of Africa Automotive e-Axle Market
- 19.8.1. Country Segmental Analysis
- 19.8.2. Drive Type
- 19.8.3. Propulsion Type
- 19.8.4. Power Output
- 19.8.5. Component
- 19.8.6. Integration Level
- 19.8.7. Cooling Technology
- 19.8.8. Vehicle Type
- 19.8.9. Sales Channel
- 20. South America Automotive e-Axle Market Analysis
- 20.1. Key Segment Analysis
- 20.2. Regional Snapshot
- 20.3. South America Automotive e-Axle Market Size (Volume - Thousand Units and Value - US$ Bn), Analysis, and Forecasts, 2021-2035
- 20.3.1. Drive Type
- 20.3.2. Propulsion Type
- 20.3.3. Power Output
- 20.3.4. Component
- 20.3.5. Integration Level
- 20.3.6. Cooling Technology
- 20.3.7. Vehicle Type
- 20.3.8. Sales Channel
- 20.3.9. Country
- 20.3.9.1. Brazil
- 20.3.9.2. Argentina
- 20.3.9.3. Rest of South America
- 20.4. Brazil Automotive e-Axle Market
- 20.4.1. Country Segmental Analysis
- 20.4.2. Drive Type
- 20.4.3. Propulsion Type
- 20.4.4. Power Output
- 20.4.5. Component
- 20.4.6. Integration Level
- 20.4.7. Cooling Technology
- 20.4.8. Vehicle Type
- 20.4.9. Sales Channel
- 20.5. Argentina Automotive e-Axle Market
- 20.5.1. Country Segmental Analysis
- 20.5.2. Drive Type
- 20.5.3. Propulsion Type
- 20.5.4. Power Output
- 20.5.5. Component
- 20.5.6. Integration Level
- 20.5.7. Cooling Technology
- 20.5.8. Vehicle Type
- 20.5.9. Sales Channel
- 20.6. Rest of South America Automotive e-Axle Market
- 20.6.1. Country Segmental Analysis
- 20.6.2. Drive Type
- 20.6.3. Propulsion Type
- 20.6.4. Power Output
- 20.6.5. Component
- 20.6.6. Integration Level
- 20.6.7. Cooling Technology
- 20.6.8. Vehicle Type
- 20.6.9. Sales Channel
- 21. Key Players/ Company Profile
- 21.1. Aisin Corporation
- 21.1.1. Company Details/ Overview
- 21.1.2. Company Financials
- 21.1.3. Key Customers and Competitors
- 21.1.4. Business/ Industry Portfolio
- 21.1.5. Product Portfolio/ Specification Details
- 21.1.6. Pricing Data
- 21.1.7. Strategic Overview
- 21.1.8. Recent Developments
- 21.2. Allison Transmission Holdings Inc.
- 21.3. American Axle & Manufacturing (AAM)
- 21.4. AVL List GmbH
- 21.5. Axle Tech International
- 21.6. BorgWarner Inc.
- 21.7. Continental AG
- 21.8. Dana Incorporated
- 21.9. Denso Corporation
- 21.10. GKN Automotive
- 21.11. Hitachi Astemo Ltd.
- 21.12. JTEKT Corporation
- 21.13. Magna International Inc.
- 21.14. Marelli Holdings Co., Ltd.
- 21.15. Meritor Inc.
- 21.16. Nidec Corporation
- 21.17. Robert Bosch GmbH
- 21.18. Schaeffler AG
- 21.19. Valeo SA
- 21.20. Vitesco Technologies
- 21.21. ZF Friedrichshafen AG
- 21.22. Other Key Players
- 21.1. Aisin Corporation
Note* - This is just tentative list of players. While providing the report, we will cover more number of players based on their revenue and share for each geography
Research Design
Our research design integrates both demand-side and supply-side analysis through a balanced combination of primary and secondary research methodologies. By utilizing both bottom-up and top-down approaches alongside rigorous data triangulation methods, we deliver robust market intelligence that supports strategic decision-making.
MarketGenics' comprehensive research design framework ensures the delivery of accurate, reliable, and actionable market intelligence. Through the integration of multiple research approaches, rigorous validation processes, and expert analysis, we provide our clients with the insights needed to make informed strategic decisions and capitalize on market opportunities.

MarketGenics leverages a dedicated industry panel of experts and a comprehensive suite of paid databases to effectively collect, consolidate, and analyze market intelligence.
Our approach has consistently proven to be reliable and effective in generating accurate market insights, identifying key industry trends, and uncovering emerging business opportunities.
Through both primary and secondary research, we capture and analyze critical company-level data such as manufacturing footprints, including technical centers, R&D facilities, sales offices, and headquarters.
Our expert panel further enhances our ability to estimate market size for specific brands based on validated field-level intelligence.
Our data mining techniques incorporate both parametric and non-parametric methods, allowing for structured data collection, sorting, processing, and cleaning.
Demand projections are derived from large-scale data sets analyzed through proprietary algorithms, culminating in robust and reliable market sizing.
Research Approach
The bottom-up approach builds market estimates by starting with the smallest addressable market units and systematically aggregating them to create comprehensive market size projections.
This method begins with specific, granular data points and builds upward to create the complete market landscape.
Customer Analysis → Segmental Analysis → Geographical Analysis
The top-down approach starts with the broadest possible market data and systematically narrows it down through a series of filters and assumptions to arrive at specific market segments or opportunities.
This method begins with the big picture and works downward to increasingly specific market slices.
TAM → SAM → SOM


Research Methods
Desk / Secondary Research
While analysing the market, we extensively study secondary sources, directories, and databases to identify and collect information useful for this technical, market-oriented, and commercial report. Secondary sources that we utilize are not only the public sources, but it is a combination of Open Source, Associations, Paid Databases, MG Repository & Knowledgebase, and others.
- Company websites, annual reports, financial reports, broker reports, and investor presentations
- National government documents, statistical databases and reports
- News articles, press releases and web-casts specific to the companies operating in the market, Magazines, reports, and others
- We gather information from commercial data sources for deriving company specific data such as segmental revenue, share for geography, product revenue, and others
- Internal and external proprietary databases (industry-specific), relevant patent, and regulatory databases
- Governing Bodies, Government Organizations
- Relevant Authorities, Country-specific Associations for Industries
We also employ the model mapping approach to estimate the product level market data through the players' product portfolio
Primary Research
Primary research/ interviews is vital in analyzing the market. Most of the cases involves paid primary interviews. Primary sources include primary interviews through e-mail interactions, telephonic interviews, surveys as well as face-to-face interviews with the different stakeholders across the value chain including several industry experts.
| Type of Respondents | Number of Primaries |
|---|---|
| Tier 2/3 Suppliers | ~20 |
| Tier 1 Suppliers | ~25 |
| End-users | ~25 |
| Industry Expert/ Panel/ Consultant | ~30 |
| Total | ~100 |
MG Knowledgebase
• Repository of industry blog, newsletter and case studies
• Online platform covering detailed market reports, and company profiles
Forecasting Factors and Models
Forecasting Factors
- Historical Trends – Past market patterns, cycles, and major events that shaped how markets behave over time. Understanding past trends helps predict future behavior.
- Industry Factors – Specific characteristics of the industry like structure, regulations, and innovation cycles that affect market dynamics.
- Macroeconomic Factors – Economic conditions like GDP growth, inflation, and employment rates that affect how much money people have to spend.
- Demographic Factors – Population characteristics like age, income, and location that determine who can buy your product.
- Technology Factors – How quickly people adopt new technology and how much technology infrastructure exists.
- Regulatory Factors – Government rules, laws, and policies that can help or restrict market growth.
- Competitive Factors – Analyzing competition structure such as degree of competition and bargaining power of buyers and suppliers.
Forecasting Models / Techniques
Multiple Regression Analysis
- Identify and quantify factors that drive market changes
- Statistical modeling to establish relationships between market drivers and outcomes
Time Series Analysis – Seasonal Patterns
- Understand regular cyclical patterns in market demand
- Advanced statistical techniques to separate trend, seasonal, and irregular components
Time Series Analysis – Trend Analysis
- Identify underlying market growth patterns and momentum
- Statistical analysis of historical data to project future trends
Expert Opinion – Expert Interviews
- Gather deep industry insights and contextual understanding
- In-depth interviews with key industry stakeholders
Multi-Scenario Development
- Prepare for uncertainty by modeling different possible futures
- Creating optimistic, pessimistic, and most likely scenarios
Time Series Analysis – Moving Averages
- Sophisticated forecasting for complex time series data
- Auto-regressive integrated moving average models with seasonal components
Econometric Models
- Apply economic theory to market forecasting
- Sophisticated economic models that account for market interactions
Expert Opinion – Delphi Method
- Harness collective wisdom of industry experts
- Structured, multi-round expert consultation process
Monte Carlo Simulation
- Quantify uncertainty and probability distributions
- Thousands of simulations with varying input parameters
Research Analysis
Our research framework is built upon the fundamental principle of validating market intelligence from both demand and supply perspectives. This dual-sided approach ensures comprehensive market understanding and reduces the risk of single-source bias.
Demand-Side Analysis: We understand end-user/application behavior, preferences, and market needs along with the penetration of the product for specific application.
Supply-Side Analysis: We estimate overall market revenue, analyze the segmental share along with industry capacity, competitive landscape, and market structure.
Validation & Evaluation
Data triangulation is a validation technique that uses multiple methods, sources, or perspectives to examine the same research question, thereby increasing the credibility and reliability of research findings. In market research, triangulation serves as a quality assurance mechanism that helps identify and minimize bias, validate assumptions, and ensure accuracy in market estimates.
- Data Source Triangulation – Using multiple data sources to examine the same phenomenon
- Methodological Triangulation – Using multiple research methods to study the same research question
- Investigator Triangulation – Using multiple researchers or analysts to examine the same data
- Theoretical Triangulation – Using multiple theoretical perspectives to interpret the same data

Custom Market Research Services
We will customise the research for you, in case the report listed above does not meet your requirements.
Get 10% Free Customisation