Chiplet Architecture Market Size, Share & Trends Analysis Report by Module Type (Compute Chiplets, Memory Chiplets, I/O Chiplets, Analog/Mixed-Signal Chiplets, Power Management Chiplets, Others), Interconnect Technology, Packaging Technology, Process Node, Rated Computing Capacity, Die Size, Number of Chiplets per Package, End-Use Industry × Application, and Geography (North America, Europe, Asia Pacific, Middle East, Africa, and South America) – Global Industry Data, Trends, and Forecasts, 2026–2035
|
|
|
Segmental Data Insights |
|
|
Demand Trends |
|
|
Competitive Landscape |
|
|
Strategic Development |
|
|
Future Outlook & Opportunities |
|
Chiplet Architecture Market Size, Share, and Growth
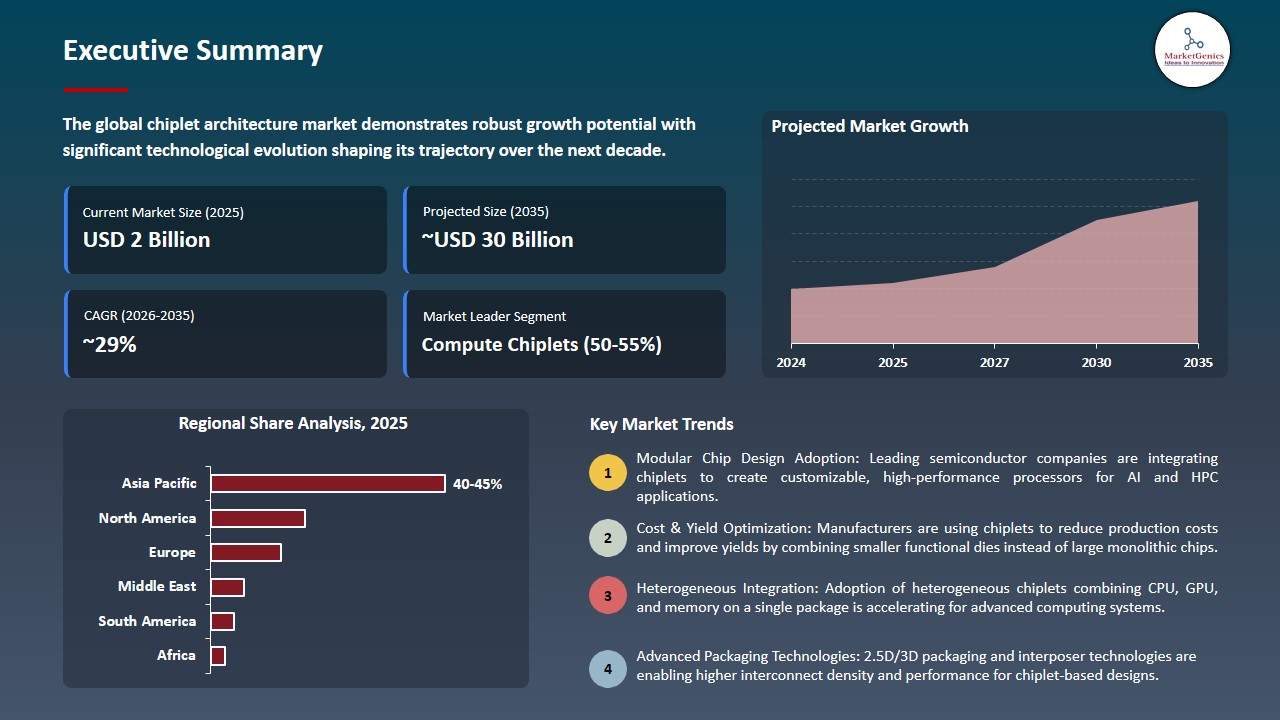
The global chiplet architecture market is witnessing strong growth, valued at USD 2.4 billion in 2025 and projected to reach USD 29.7 billion by 2035, expanding at a CAGR of 28.6% during the forecast period. North America is the fastest-growing region in the chiplet architecture market due to strong demand for high-performance computing, AI, data center expansion, advanced semiconductor R&D, and early adoption of modular chiplet designs.
K. Charles Janac, president and CEO of Arteris, said, “We are excited to collaborate and expand our relationship with AMD, a company recognized globally for its innovation in high performance computing, with modern chiplets each having between 5 and 20 interconnect networks for data transport, our FlexGen NoC IP will work hand in hand with AMD’s Infinity Fabric to accelerate the performance and scalability required by today’s most demanding and diverse applications”.
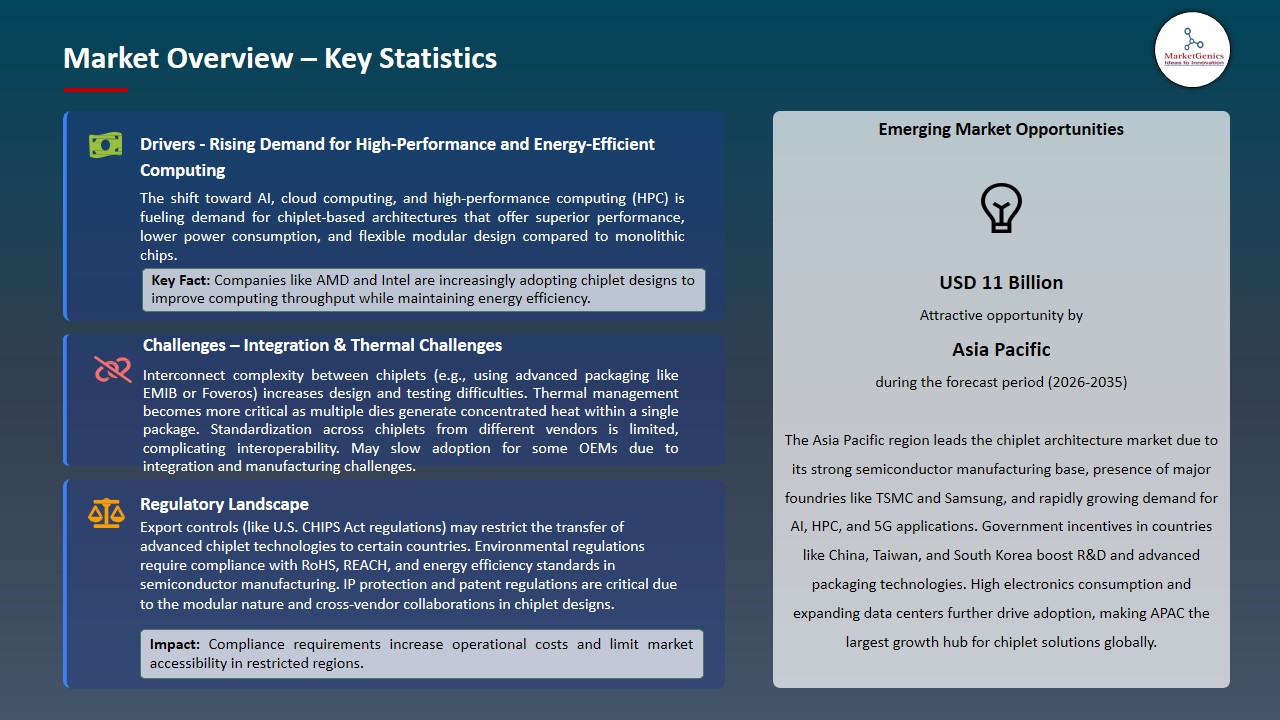
The increasing adoption of AI, cloud computing, and high-performance computing (HPC) applications is driving the demand for chiplet architectures. By enabling modular, scalable, and energy-efficient designs, chiplets allow manufacturers to enhance computing power while reducing power consumption and costs. This flexibility supports rapid innovation, faster product development cycles, and optimized performance for data centers, AI accelerators, and next-generation computing systems, making it a key market growth driver.
The growing demand for electric vehicles (EVs), autonomous driving systems, and advanced medical devices presents a significant opportunity for the chiplet architecture market. Chiplets enable highly customized, modular designs that optimize performance, energy efficiency, and reliability for these applications. This flexibility allows manufacturers to rapidly develop specialized solutions, reduce development costs, and meet the increasing computational and connectivity requirements of next-generation automotive, healthcare, and edge-computing technologies.
Adjacent opportunities include developing high-bandwidth memory (HBM) chiplets for AI and HPC, adopting standardized interconnects like UCIe for cross-vendor compatibility, and designing low-power modular chiplets for edge computing and IoT devices. Additionally, customized solutions for automotive electronics, EVs, and advanced medical devices present growth potential by enabling optimized performance, energy efficiency, and rapid innovation across emerging sectors.
Chiplet Architecture Market Dynamics and Trends
Driver: Advanced Packaging Technologies
-
The adoption of advanced packaging technologies, including 2.5D and 3D integration, as well as heterogeneous packaging, is a major driver for the Chiplet Architecture market. These technologies allow multiple chiplets such as compute, memory, and I/O dies to be integrated within a single package, improving bandwidth, reducing latency, and enhancing overall system performance.
- Heterogeneous packaging also enables the combination of chiplets manufactured on different process nodes, optimizing cost and efficiency. Furthermore, these advanced packaging techniques contribute to miniaturization, allowing smaller, more compact devices without compromising functionality. As AI, HPC, 5G, and edge computing demand higher performance in limited form factors, advanced packaging accelerates the adoption of modular chiplet solutions globally.
- In January 2025, Nvidia’s CEO Jensen Huang announced that the company is transitioning its Blackwell AI GPU production to TSMC’s CoWoS‑L advanced packaging technology, replacing CoWoS‑S. This move increases packaging capacity, supports multi-chip integration, and highlights the critical role of 2.5D/3D heterogeneous packaging in enabling high-performance chiplet architectures.
- Advanced packaging drives the chiplet architecture market by boosting performance, efficiency, and adoption across high-performance and emerging computing applications.
Restraint: Complex design and integration challenges
-
The chiplet architecture market faces significant restraints due to the complexity involved in designing and integrating multiple chiplets into a single package. Unlike traditional monolithic chips, chiplet-based designs involve combining diverse dies—compute, memory, and I/O—from different process nodes and sometimes even different vendors. Ensuring seamless interoperability between these chiplets requires advanced engineering expertise, precise design methodologies, and rigorous validation procedures, which can increase development time and costs.
- Integration challenges also arise from the need to manage signal integrity, latency, and power delivery across multiple chiplets. Sophisticated tools and testing platforms are required to verify the functionality and performance of the combined system, further adding to engineering complexity. Moreover, limited standardization in interconnect protocols across vendors can hinder cross-company integration and collaboration, making it difficult for smaller players to adopt chiplet solutions.
- These complexities can slow adoption, increase manufacturing costs, and act as a barrier for companies without advanced design and testing capabilities, restraining market growth in the short term despite the high-performance benefits of chiplets.
Opportunity: UCIe and open standards adoption
-
The adoption of Universal Chiplet Interconnect Express (UCIe) and other open standards presents a significant opportunity for the Chiplet Architecture market. Standardized interconnects enable seamless interoperability between chiplets from different vendors, reducing design complexity and fostering a collaborative ecosystem. This facilitates faster integration of compute, memory, and I/O chiplets, allowing manufacturers to develop modular, high-performance systems more efficiently.
- Open standards also accelerate innovation, as companies can focus on optimizing individual chiplets without worrying about compatibility issues. By promoting cross-vendor collaboration and reducing dependency on proprietary interfaces, UCIe adoption can lower costs, shorten development cycles, and expand the market for chiplet-based solutions across AI, HPC, 5G, automotive, and edge computing applications globally.
- In March 2025, Ayar Labs unveiled the world’s first UCIe optical interconnect chiplet, achieving 8 Tbps bandwidth for AI scale-up architectures. By combining a UCIe interface with optical I/O, it enables cross-vendor chiplet interoperability, reduces latency and power consumption, and accelerates adoption of high-performance modular AI systems.
- The adoption of UCIe and open standards is accelerating interoperability, efficiency, and innovation, driving growth in the chiplet architecture market.
Key Trend: Specialized Chiplets for AI and Edge Computing
-
A major trend in the chiplet architecture market is the development of specialized chiplets designed for specific functions such as AI acceleration, machine learning workloads, and low-power edge computing. These chiplets allow manufacturers to create modular, application-specific solutions that optimize performance, energy efficiency, and form factor for targeted use cases. By separating compute, memory, and I/O into tailored chiplets, designers can scale AI and edge systems more effectively while reducing overall power consumption.
- In September 2025, BOS Semiconductors delivered the industry’s first chiplet-based Eagle‑N NPU to global automotive OEMs. Offering 250–2,000+ TOPS and up to 5× higher cost efficiency, the Eagle‑N enables scalable, high-performance AI for vehicles and robotics, supporting diverse models from vision to multimodal applications.
- This modular approach also enables rapid innovation, as individual chiplets can be upgraded or customized without redesigning entire systems, driving diversified growth across data centers, AI infrastructure, 5G networks, automotive electronics, and IoT devices globally.
Chiplet-Architecture-Market Analysis and Segmental Data
Compute Chiplets Dominate Global Chiplet Architecture Market
-
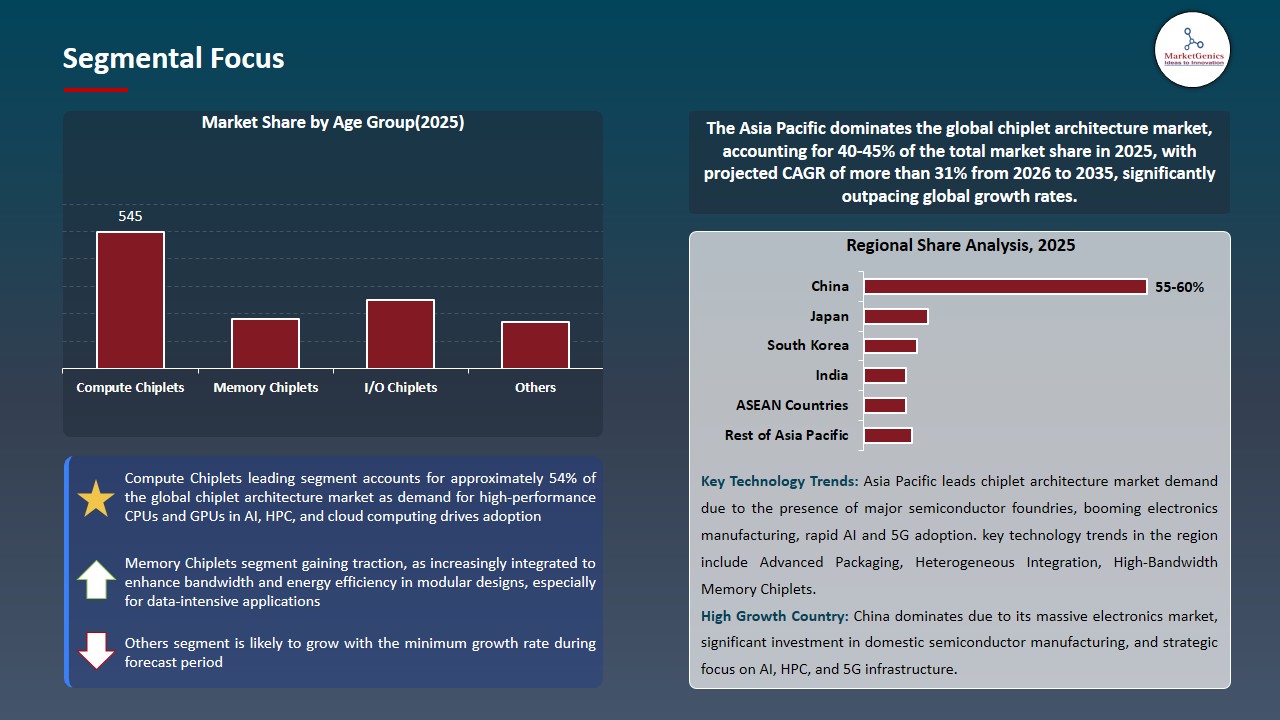
Compute chiplets are the dominant segment in the global chiplet architecture market, driven by the increasing demand for high-performance computing in AI, cloud, and HPC applications. These chiplets integrate CPU, GPU, and AI accelerator functions into modular packages, delivering superior processing power, energy efficiency, and scalability compared to traditional monolithic chips.
- Their modularity allows manufacturers to upgrade or combine compute dies without redesigning the entire system, reducing development costs and accelerating time-to-market. Leading semiconductor companies, are heavily investing in compute chiplet designs to meet the growing requirements of data centers, autonomous vehicles, edge devices, and advanced AI workloads, solidifying compute chiplets as the backbone of modern high-performance chiplet solutions globally.
- In August 2025, AMD licensed Arteris’ FlexGen NoC IP for its next-generation compute chiplets in AI designs, integrating it with Infinity Fabric to enable high-performance, low-latency data transport across multiple compute chiplets, enhancing scalability and efficiency for AI workloads from data centers to edge devices.
- Compute chiplets continue to lead the market, enabling high-performance, scalable, and energy-efficient solutions across AI, HPC, and emerging computing applications.
Asia Pacific Leads Global Chiplet Architecture Market Demand
-
The Asia Pacific (APAC) region dominates in the global chiplet architecture market due to its robust semiconductor manufacturing ecosystem and advanced R&D capabilities. Strong investments in AI, HPC, 5G, and automotive electronics further drive the adoption of modular, high-performance chiplet solutions across various sectors.
- Supportive government policies and incentives in countries across the region encourage research and development in advanced semiconductor technologies, including chiplets. The rapidly expanding electronics market and growing adoption of smart devices, data centers, and edge computing systems create significant demand for flexible, scalable chiplet architectures.
- The combination of manufacturing expertise, innovation, and strong end-user demand positions Asia Pacific as the leading growth region for chiplet adoption globally, with countries like China emerging as the fastest-growing market due to massive electronics consumption, domestic semiconductor investments, and strategic focus on AI and high-performance computing applications.
- Asia Pacific leads the global chiplet architecture market, driven by strong manufacturing capabilities, innovation, supportive policies, and rapidly growing demand across AI, HPC, 5G, and edge computing applications.
Chiplet-Architecture-Market Ecosystem
The global chiplet architecture market is consolidated, with leading players including TSMC, Intel Corporation, Advanced Micro Devices (AMD), Qualcomm Technologies, and Samsung Electronics. These companies maintain competitive advantages through extensive R&D capabilities, advanced chiplet design and packaging technologies, proprietary interconnect solutions, and strong global manufacturing and supply chain networks. Strategic partnerships, collaborations with ecosystem partners, and continuous innovation in compute, memory, and I/O chiplets further strengthen their market positions.
The market value chain encompasses: semiconductor design and simulation, chiplet fabrication and packaging, testing and validation for performance, interoperability, and reliability, compliance with industry standards, high-volume manufacturing, distribution to OEMs and system integrators, and post-sale support including software integration, interoperability validation, and firmware updates.
High entry barriers persist due to the capital-intensive nature of semiconductor R&D, advanced process and packaging technologies, compliance with international standards, and the requirement for established foundry and assembly networks. Ongoing innovations, such as AI-optimized compute chiplets, high-bandwidth memory integration, heterogeneous integration, and UCIe standard adoption, continue to drive differentiation and adoption globally.

Recent Development and Strategic Overview:
-
In August 2025, Intel unveiled its Clearwater Forest Xeon processor at Hot Chips, featuring 12 compute chiplets on 18A nodes with advanced 3D Foveros and EMIB packaging. The modular design supports up to 288 cores per socket, high DDR5 memory bandwidth, and scalable AI/HPC performance, showcasing Intel’s next-generation chiplet and packaging capabilities.
- In August 2025, AMD unveiled its Instinct MI350 GPU at Hot Chips, featuring CDNA 4 architecture and a 3nm 3D chiplet design with 185 billion transistors and 288 GB memory, optimized for large AI models and HPC workloads, demonstrating next-generation chiplet scalability and performance for data centers.
Report Scope
|
Detail |
|
|
Market Size in 2025 |
USD 2.4 Bn |
|
Market Forecast Value in 2035 |
USD 29.7 Bn |
|
Growth Rate (CAGR) |
28.6% |
|
Forecast Period |
2026 – 2035 |
|
Historical Data Available for |
2021 – 2024 |
|
Market Size Units |
US$ Billion for Value Million Units for Volume |
|
Report Format |
Electronic (PDF) + Excel |
|
North America |
Europe |
Asia Pacific |
Middle East |
Africa |
South America |
|
|
|
|
|
|
|
Companies Covered |
|||||
|
|
|
|
|
|
Chiplet-Architecture-Market Segmentation and Highlights
|
Segment |
Sub-segment |
|
Chiplet Architecture Market, By Chiplet Type |
|
|
Chiplet Architecture Market, By Interconnect Technology |
|
|
Chiplet Architecture Market, By Packaging Technology |
|
|
Chiplet Architecture Market, By Process Node |
|
|
Chiplet Architecture Market, By Rated Computing Capacity |
|
|
Chiplet Architecture Market, By Die Size |
|
|
Chiplet Architecture Market, By Number of Chiplets per Package |
|
|
Chiplet Architecture Market, By End-Use Industry × Application |
|
Frequently Asked Questions
Table of Contents
- 1. Research Methodology and Assumptions
- 1.1. Definitions
- 1.2. Research Design and Approach
- 1.3. Data Collection Methods
- 1.4. Base Estimates and Calculations
- 1.5. Forecasting Models
- 1.5.1. Key Forecast Factors & Impact Analysis
- 1.6. Secondary Research
- 1.6.1. Open Sources
- 1.6.2. Paid Databases
- 1.6.3. Associations
- 1.7. Primary Research
- 1.7.1. Primary Sources
- 1.7.2. Primary Interviews with Stakeholders across Ecosystem
- 2. Executive Summary
- 2.1. Global Chiplet Architecture Market Outlook
- 2.1.1. Chiplet Architecture Market Size Volume (Million Units) and Value (US$ Bn), and Forecasts, 2021-2035
- 2.1.2. Compounded Annual Growth Rate Analysis
- 2.1.3. Growth Opportunity Analysis
- 2.1.4. Segmental Share Analysis
- 2.1.5. Geographical Share Analysis
- 2.2. Market Analysis and Facts
- 2.3. Supply-Demand Analysis
- 2.4. Competitive Benchmarking
- 2.5. Go-to- Market Strategy
- 2.5.1. Customer/ End-use Industry Assessment
- 2.5.2. Growth Opportunity Data, 2026-2035
- 2.5.2.1. Regional Data
- 2.5.2.2. Country Data
- 2.5.2.3. Segmental Data
- 2.5.3. Identification of Potential Market Spaces
- 2.5.4. GAP Analysis
- 2.5.5. Potential Attractive Price Points
- 2.5.6. Prevailing Market Risks & Challenges
- 2.5.7. Preferred Sales & Marketing Strategies
- 2.5.8. Key Recommendations and Analysis
- 2.5.9. A Way Forward
- 2.1. Global Chiplet Architecture Market Outlook
- 3. Industry Data and Premium Insights
- 3.1. Global Semiconductors & Electronics Industry Overview, 2025
- 3.1.1. Semiconductors & Electronics Industry Ecosystem Analysis
- 3.1.2. Key Trends for Semiconductors & Electronics Industry
- 3.1.3. Regional Distribution for Semiconductors & Electronics Industry
- 3.2. Supplier Customer Data
- 3.3. Technology Roadmap and Developments
- 3.4. Trade Analysis
- 3.4.1. Import & Export Analysis, 2025
- 3.4.2. Top Importing Countries
- 3.4.3. Top Exporting Countries
- 3.5. Trump Tariff Impact Analysis
- 3.5.1. Manufacturer
- 3.5.1.1. Based on the component & Raw material
- 3.5.2. Supply Chain
- 3.5.3. End Consumer
- 3.5.1. Manufacturer
- 3.6. Raw Material Analysis
- 3.1. Global Semiconductors & Electronics Industry Overview, 2025
- 4. Market Overview
- 4.1. Market Dynamics
- 4.1.1. Drivers
- 4.1.1.1. Growing demand for high-performance computing from AI, data centers, and advanced analytics
- 4.1.1.2. Cost efficiency and improved manufacturing yields compared to monolithic chip designs
- 4.1.1.3. Rapid advancements in advanced packaging and interconnect technologies (2.5D/3D integration)
- 4.1.2. Restraints
- 4.1.2.1. Lack of universal standards and interoperability across chiplet ecosystems
- 4.1.2.2. Design complexity and high integration, testing, and validation costs
- 4.1.1. Drivers
- 4.2. Key Trend Analysis
- 4.3. Regulatory Framework
- 4.3.1. Key Regulations, Norms, and Subsidies, by Key Countries
- 4.3.2. Tariffs and Standards
- 4.3.3. Impact Analysis of Regulations on the Market
- 4.4. Value Chain Analysis
- 4.4.1. IP and Design Tools Providers
- 4.4.2. Raw Materials and Component Suppliers
- 4.4.3. Chiplet Manufacturers
- 4.4.4. Foundry/ OSATS/ IDMs
- 4.4.5. Distribution & Supply Chain Logistics
- 4.4.6. End-Users
- 4.5. Porter’s Five Forces Analysis
- 4.6. PESTEL Analysis
- 4.7. Global Chiplet Architecture Market Demand
- 4.7.1. Historical Market Size – Volume (Million Units) and Value (US$ Bn), 2020-2024
- 4.7.2. Current and Future Market Size – Volume (Million Units) and Value (US$ Bn), 2026–2035
- 4.7.2.1. Y-o-Y Growth Trends
- 4.7.2.2. Absolute $ Opportunity Assessment
- 4.1. Market Dynamics
- 5. Competition Landscape
- 5.1. Competition structure
- 5.1.1. Fragmented v/s consolidated
- 5.2. Company Share Analysis, 2025
- 5.2.1. Global Company Market Share
- 5.2.2. By Region
- 5.2.2.1. North America
- 5.2.2.2. Europe
- 5.2.2.3. Asia Pacific
- 5.2.2.4. Middle East
- 5.2.2.5. Africa
- 5.2.2.6. South America
- 5.3. Product Comparison Matrix
- 5.3.1. Specifications
- 5.3.2. Market Positioning
- 5.3.3. Pricing
- 5.1. Competition structure
- 6. Global Chiplet Architecture Market Analysis, by Chiplet Type
- 6.1. Key Segment Analysis
- 6.2. Chiplet Architecture Market Size Volume (Million Units) and Value (US$ Bn), Analysis, and Forecasts, by Chiplet Type, 2021-2035
- 6.2.1. Compute Chiplets
- 6.2.1.1. CPU Chiplets
- 6.2.1.2. GPU Chiplets
- 6.2.1.3. AI/ML Accelerator Chiplets
- 6.2.1.4. FPGA Chiplets
- 6.2.1.5. Others
- 6.2.2. Memory Chiplets
- 6.2.2.1. HBM (High Bandwidth Memory) Chiplets
- 6.2.2.2. DDR Chiplets
- 6.2.2.3. SRAM Chiplets
- 6.2.2.4. Others
- 6.2.3. I/O Chiplets
- 6.2.3.1. PCIe Interface Chiplets
- 6.2.3.2. Ethernet Controller Chiplets
- 6.2.3.3. USB Controller Chiplets
- 6.2.3.4. Others
- 6.2.4. Analog/Mixed-Signal Chiplets
- 6.2.5. Power Management Chiplets
- 6.2.6. Others
- 6.2.1. Compute Chiplets
- 7. Global Chiplet Architecture Market Analysis, by Interconnect Technology
- 7.1. Key Segment Analysis
- 7.2. Chiplet Architecture Market Size Volume (Million Units) and Value (US$ Bn), Analysis, and Forecasts, by Interconnect Technology, 2021-2035
- 7.2.1. Advanced Interface Bus (AIB)
- 7.2.2. Universal Chiplet Interconnect Express (UCIe)
- 7.2.3. Bunch of Wires (BoW)
- 7.2.4. Proprietary Interconnects
- 7.2.5. OpenHBI
- 7.2.6. CXL (Compute Express Link)
- 7.2.7. Others
- 8. Global Chiplet Architecture Market Analysis, by Packaging Technology
- 8.1. Key Segment Analysis
- 8.2. Chiplet Architecture Market Size Volume (Million Units) and Value (US$ Bn), Analysis, and Forecasts, by Packaging Technology, 2021-2035
- 8.2.1. 5D Packaging
- 8.2.1.1. CoWoS (Chip-on-Wafer-on-Substrate)
- 8.2.1.2. InFO (Integrated Fan-Out)
- 8.2.2. 3D Packaging
- 8.2.2.1. Through-Silicon Via (TSV)
- 8.2.2.2. Hybrid Bonding
- 8.2.2.3. Micro-bump Technology
- 8.2.3. Fan-out Wafer Level Packaging (FOWLP)
- 8.2.4. Embedded Multi-die Interconnect Bridge (EMIB)
- 8.2.1. 5D Packaging
- 9. Global Chiplet Architecture Market Analysis, by Process Node
- 9.1. Key Segment Analysis
- 9.2. Chiplet Architecture Market Size Volume (Million Units) and Value (US$ Bn), Analysis, and Forecasts, by Process Node, 2021-2035
- 9.2.1. Below 7nm
- 9.2.1.1. 5nm
- 9.2.1.2. 3nm
- 9.2.1.3. 2nm and below
- 9.2.2. 7nm - 10nm
- 9.2.3. 12nm - 16nm
- 9.2.4. 20nm - 28nm
- 9.2.5. Above 28nm
- 9.2.1. Below 7nm
- 10. Global Chiplet Architecture Market Analysis, by Rated Computing Capacity
- 10.1. Key Segment Analysis
- 10.2. Chiplet Architecture Market Size Volume (Million Units) and Value (US$ Bn), Analysis, and Forecasts, by Rated Computing Capacity, 2021-2035
- 10.2.1. Below 1 TFLOPS
- 10.2.2. 1-10 TFLOPS
- 10.2.3. 10-50 TFLOPS
- 10.2.4. Above 50 TFLOPS
- 11. Global Chiplet Architecture Market Analysis, by Die Size
- 11.1. Key Segment Analysis
- 11.2. Chiplet Architecture Market Size Volume (Million Units) and Value (US$ Bn), Analysis, and Forecasts, by Die Size, 2021-2035
- 11.2.1. Small (Below 100 mm²)
- 11.2.2. Medium (100-300 mm²)
- 11.2.3. Large (300-600 mm²)
- 11.2.4. Extra Large (Above 600 mm²)
- 12. Global Chiplet Architecture Market Analysis and Forecasts, by Number of Chiplets per Package
- 12.1. Key Findings
- 12.2. Chiplet Architecture Market Size Volume (Million Units) and Value (US$ Bn), Analysis, and Forecasts, by Number of Chiplets per Package, 2021-2035
- 12.2.1. 2-4 Chiplets
- 12.2.2. 5-8 Chiplets
- 12.2.3. 9-16 Chiplets
- 12.2.4. Above 16 Chiplets
- 13. Global Chiplet Architecture Market Analysis and Forecasts, by End-Use Industry × Application
- 13.1. Key Findings
- 13.2. Chiplet Architecture Market Size Volume (Million Units) and Value (US$ Bn), Analysis, and Forecasts, by End-Use Industry × Application, 2021-2035
- 13.2.1. Data Centers & Cloud Computing
- 13.2.1.1. AI/ML Training
- 13.2.1.2. AI/ML Inference
- 13.2.1.3. High-Performance Computing (HPC)
- 13.2.1.4. Storage Solutions
- 13.2.1.5. Network Infrastructure
- 13.2.1.6. Edge Computing Servers
- 13.2.1.7. Others
- 13.2.2. Consumer Electronics
- 13.2.2.1. Smartphones
- 13.2.2.2. Tablets
- 13.2.2.3. Laptops & PCs
- 13.2.2.4. Gaming Consoles
- 13.2.2.5. Wearable Devices
- 13.2.2.6. Smart Home Devices
- 13.2.2.7. Others
- 13.2.3. Automotive
- 13.2.3.1. Advanced Driver Assistance Systems (ADAS)
- 13.2.3.2. Autonomous Driving Systems
- 13.2.3.3. Infotainment Systems
- 13.2.3.4. Vehicle-to-Everything (V2X) Communication
- 13.2.3.5. Electric Vehicle Power Management
- 13.2.3.6. In-Vehicle Networking
- 13.2.3.7. Others
- 13.2.4. Telecommunications
- 13.2.4.1. 5G Base Stations
- 13.2.4.2. Network Switches & Routers
- 13.2.4.3. Optical Transport Networks
- 13.2.4.4. Radio Access Networks (RAN)
- 13.2.4.5. Core Network Infrastructure
- 13.2.4.6. Others
- 13.2.5. Aerospace & Defense
- 13.2.6. Healthcare & Medical Devices
- 13.2.6.1. Industrial Automation
- 13.2.6.2. Robotics Controllers
- 13.2.6.3. Machine Vision Systems
- 13.2.6.4. Programmable Logic Controllers (PLCs)
- 13.2.6.5. Industrial IoT Gateways
- 13.2.6.6. Process Control Systems
- 13.2.6.7. Others
- 13.2.7. Financial Services
- 13.2.8. Gaming & Entertainment
- 13.2.8.1. Gaming Graphics Processing
- 13.2.8.2. Virtual Reality (VR) Systems
- 13.2.8.3. Augmented Reality (AR) Devices
- 13.2.8.4. Content Creation Workstations
- 13.2.8.5. Game Streaming Infrastructure
- 13.2.8.6. Others
- 13.2.9. Others
- 13.2.1. Data Centers & Cloud Computing
- 14. Global Chiplet Architecture Market Analysis and Forecasts, by Region
- 14.1. Key Findings
- 14.2. Chiplet Architecture Market Size Volume (Million Units) and Value (US$ Bn), Analysis, and Forecasts, by Region, 2021-2035
- 14.2.1. North America
- 14.2.2. Europe
- 14.2.3. Asia Pacific
- 14.2.4. Middle East
- 14.2.5. Africa
- 14.2.6. South America
- 15. North America Chiplet Architecture Market Analysis
- 15.1. Key Segment Analysis
- 15.2. Regional Snapshot
- 15.3. North America Chiplet Architecture Market Size Volume (Million Units) and Value (US$ Bn), Analysis, and Forecasts, 2021-2035
- 15.3.1. Chiplet Type
- 15.3.2. Interconnect Technology
- 15.3.3. Packaging Technology
- 15.3.4. Process Node
- 15.3.5. Rated Computing Capacity
- 15.3.6. Die Size
- 15.3.7. Number of Chiplets per Package
- 15.3.8. End-Use Industry × Application
- 15.3.9. Country
- 15.3.9.1. USA
- 15.3.9.2. Canada
- 15.3.9.3. Mexico
- 15.4. USA Chiplet Architecture Market
- 15.4.1. Country Segmental Analysis
- 15.4.2. Chiplet Type
- 15.4.3. Interconnect Technology
- 15.4.4. Packaging Technology
- 15.4.5. Process Node
- 15.4.6. Rated Computing Capacity
- 15.4.7. Die Size
- 15.4.8. Number of Chiplets per Package
- 15.4.9. End-Use Industry × Application
- 15.5. Canada Chiplet Architecture Market
- 15.5.1. Country Segmental Analysis
- 15.5.2. Chiplet Type
- 15.5.3. Interconnect Technology
- 15.5.4. Packaging Technology
- 15.5.5. Process Node
- 15.5.6. Rated Computing Capacity
- 15.5.7. Die Size
- 15.5.8. Number of Chiplets per Package
- 15.5.9. End-Use Industry × Application
- 15.6. Mexico Chiplet Architecture Market
- 15.6.1. Country Segmental Analysis
- 15.6.2. Chiplet Type
- 15.6.3. Interconnect Technology
- 15.6.4. Packaging Technology
- 15.6.5. Process Node
- 15.6.6. Rated Computing Capacity
- 15.6.7. Die Size
- 15.6.8. Number of Chiplets per Package
- 15.6.9. End-Use Industry × Application
- 16. Europe Chiplet Architecture Market Analysis
- 16.1. Key Segment Analysis
- 16.2. Regional Snapshot
- 16.3. Europe Chiplet Architecture Market Size Volume (Million Units) and Value (US$ Bn), Analysis, and Forecasts, 2021-2035
- 16.3.1. Chiplet Type
- 16.3.2. Interconnect Technology
- 16.3.3. Packaging Technology
- 16.3.4. Process Node
- 16.3.5. Rated Computing Capacity
- 16.3.6. Die Size
- 16.3.7. Number of Chiplets per Package
- 16.3.8. End-Use Industry × Application
- 16.3.9. Country
- 16.3.9.1. Germany
- 16.3.9.2. United Kingdom
- 16.3.9.3. France
- 16.3.9.4. Italy
- 16.3.9.5. Spain
- 16.3.9.6. Netherlands
- 16.3.9.7. Nordic Countries
- 16.3.9.8. Poland
- 16.3.9.9. Russia & CIS
- 16.3.9.10. Rest of Europe
- 16.4. Germany Chiplet Architecture Market
- 16.4.1. Country Segmental Analysis
- 16.4.2. Chiplet Type
- 16.4.3. Interconnect Technology
- 16.4.4. Packaging Technology
- 16.4.5. Process Node
- 16.4.6. Rated Computing Capacity
- 16.4.7. Die Size
- 16.4.8. Number of Chiplets per Package
- 16.4.9. End-Use Industry × Application
- 16.5. United Kingdom Chiplet Architecture Market
- 16.5.1. Country Segmental Analysis
- 16.5.2. Chiplet Type
- 16.5.3. Interconnect Technology
- 16.5.4. Packaging Technology
- 16.5.5. Process Node
- 16.5.6. Rated Computing Capacity
- 16.5.7. Die Size
- 16.5.8. Number of Chiplets per Package
- 16.5.9. End-Use Industry × Application
- 16.6. France Chiplet Architecture Market
- 16.6.1. Country Segmental Analysis
- 16.6.2. Chiplet Type
- 16.6.3. Interconnect Technology
- 16.6.4. Packaging Technology
- 16.6.5. Process Node
- 16.6.6. Rated Computing Capacity
- 16.6.7. Die Size
- 16.6.8. Number of Chiplets per Package
- 16.6.9. End-Use Industry × Application
- 16.7. Italy Chiplet Architecture Market
- 16.7.1. Country Segmental Analysis
- 16.7.2. Chiplet Type
- 16.7.3. Interconnect Technology
- 16.7.4. Packaging Technology
- 16.7.5. Process Node
- 16.7.6. Rated Computing Capacity
- 16.7.7. Die Size
- 16.7.8. Number of Chiplets per Package
- 16.7.9. End-Use Industry × Application
- 16.8. Spain Chiplet Architecture Market
- 16.8.1. Country Segmental Analysis
- 16.8.2. Chiplet Type
- 16.8.3. Interconnect Technology
- 16.8.4. Packaging Technology
- 16.8.5. Process Node
- 16.8.6. Rated Computing Capacity
- 16.8.7. Die Size
- 16.8.8. Number of Chiplets per Package
- 16.8.9. End-Use Industry × Application
- 16.9. Netherlands Chiplet Architecture Market
- 16.9.1. Country Segmental Analysis
- 16.9.2. Chiplet Type
- 16.9.3. Interconnect Technology
- 16.9.4. Packaging Technology
- 16.9.5. Process Node
- 16.9.6. Rated Computing Capacity
- 16.9.7. Die Size
- 16.9.8. Number of Chiplets per Package
- 16.9.9. End-Use Industry × Application
- 16.10. Nordic Countries Chiplet Architecture Market
- 16.10.1. Country Segmental Analysis
- 16.10.2. Chiplet Type
- 16.10.3. Interconnect Technology
- 16.10.4. Packaging Technology
- 16.10.5. Process Node
- 16.10.6. Rated Computing Capacity
- 16.10.7. Die Size
- 16.10.8. Number of Chiplets per Package
- 16.10.9. End-Use Industry × Application
- 16.11. Poland Chiplet Architecture Market
- 16.11.1. Country Segmental Analysis
- 16.11.2. Chiplet Type
- 16.11.3. Interconnect Technology
- 16.11.4. Packaging Technology
- 16.11.5. Process Node
- 16.11.6. Rated Computing Capacity
- 16.11.7. Die Size
- 16.11.8. Number of Chiplets per Package
- 16.11.9. End-Use Industry × Application
- 16.12. Russia & CIS Chiplet Architecture Market
- 16.12.1. Country Segmental Analysis
- 16.12.2. Chiplet Type
- 16.12.3. Interconnect Technology
- 16.12.4. Packaging Technology
- 16.12.5. Process Node
- 16.12.6. Rated Computing Capacity
- 16.12.7. Die Size
- 16.12.8. Number of Chiplets per Package
- 16.12.9. End-Use Industry × Application
- 16.13. Rest of Europe Chiplet Architecture Market
- 16.13.1. Country Segmental Analysis
- 16.13.2. Chiplet Type
- 16.13.3. Interconnect Technology
- 16.13.4. Packaging Technology
- 16.13.5. Process Node
- 16.13.6. Rated Computing Capacity
- 16.13.7. Die Size
- 16.13.8. Number of Chiplets per Package
- 16.13.9. End-Use Industry × Application
- 17. Asia Pacific Chiplet Architecture Market Analysis
- 17.1. Key Segment Analysis
- 17.2. Regional Snapshot
- 17.3. Asia Pacific Chiplet Architecture Market Size Volume (Million Units) and Value (US$ Bn), Analysis, and Forecasts, 2021-2035
- 17.3.1. Chiplet Type
- 17.3.2. Interconnect Technology
- 17.3.3. Packaging Technology
- 17.3.4. Process Node
- 17.3.5. Rated Computing Capacity
- 17.3.6. Die Size
- 17.3.7. Number of Chiplets per Package
- 17.3.8. End-Use Industry × Application
- 17.3.9. Country
- 17.3.9.1. China
- 17.3.9.2. India
- 17.3.9.3. Japan
- 17.3.9.4. South Korea
- 17.3.9.5. Australia and New Zealand
- 17.3.9.6. Indonesia
- 17.3.9.7. Malaysia
- 17.3.9.8. Thailand
- 17.3.9.9. Vietnam
- 17.3.9.10. Rest of Asia Pacific
- 17.4. China Chiplet Architecture Market
- 17.4.1. Country Segmental Analysis
- 17.4.2. Chiplet Type
- 17.4.3. Interconnect Technology
- 17.4.4. Packaging Technology
- 17.4.5. Process Node
- 17.4.6. Rated Computing Capacity
- 17.4.7. Die Size
- 17.4.8. Number of Chiplets per Package
- 17.4.9. End-Use Industry × Application
- 17.5. India Chiplet Architecture Market
- 17.5.1. Country Segmental Analysis
- 17.5.2. Chiplet Type
- 17.5.3. Interconnect Technology
- 17.5.4. Packaging Technology
- 17.5.5. Process Node
- 17.5.6. Rated Computing Capacity
- 17.5.7. Die Size
- 17.5.8. Number of Chiplets per Package
- 17.5.9. End-Use Industry × Application
- 17.6. Japan Chiplet Architecture Market
- 17.6.1. Country Segmental Analysis
- 17.6.2. Chiplet Type
- 17.6.3. Interconnect Technology
- 17.6.4. Packaging Technology
- 17.6.5. Process Node
- 17.6.6. Rated Computing Capacity
- 17.6.7. Die Size
- 17.6.8. Number of Chiplets per Package
- 17.6.9. End-Use Industry × Application
- 17.7. South Korea Chiplet Architecture Market
- 17.7.1. Country Segmental Analysis
- 17.7.2. Chiplet Type
- 17.7.3. Interconnect Technology
- 17.7.4. Packaging Technology
- 17.7.5. Process Node
- 17.7.6. Rated Computing Capacity
- 17.7.7. Die Size
- 17.7.8. Number of Chiplets per Package
- 17.7.9. End-Use Industry × Application
- 17.8. Australia and New Zealand Chiplet Architecture Market
- 17.8.1. Country Segmental Analysis
- 17.8.2. Chiplet Type
- 17.8.3. Interconnect Technology
- 17.8.4. Packaging Technology
- 17.8.5. Process Node
- 17.8.6. Rated Computing Capacity
- 17.8.7. Die Size
- 17.8.8. Number of Chiplets per Package
- 17.8.9. End-Use Industry × Application
- 17.9. Indonesia Chiplet Architecture Market
- 17.9.1. Country Segmental Analysis
- 17.9.2. Chiplet Type
- 17.9.3. Interconnect Technology
- 17.9.4. Packaging Technology
- 17.9.5. Process Node
- 17.9.6. Rated Computing Capacity
- 17.9.7. Die Size
- 17.9.8. Number of Chiplets per Package
- 17.9.9. End-Use Industry × Application
- 17.10. Malaysia Chiplet Architecture Market
- 17.10.1. Country Segmental Analysis
- 17.10.2. Chiplet Type
- 17.10.3. Interconnect Technology
- 17.10.4. Packaging Technology
- 17.10.5. Process Node
- 17.10.6. Rated Computing Capacity
- 17.10.7. Die Size
- 17.10.8. Number of Chiplets per Package
- 17.10.9. End-Use Industry × Application
- 17.11. Thailand Chiplet Architecture Market
- 17.11.1. Country Segmental Analysis
- 17.11.2. Chiplet Type
- 17.11.3. Interconnect Technology
- 17.11.4. Packaging Technology
- 17.11.5. Process Node
- 17.11.6. Rated Computing Capacity
- 17.11.7. Die Size
- 17.11.8. Number of Chiplets per Package
- 17.11.9. End-Use Industry × Application
- 17.12. Vietnam Chiplet Architecture Market
- 17.12.1. Country Segmental Analysis
- 17.12.2. Chiplet Type
- 17.12.3. Interconnect Technology
- 17.12.4. Packaging Technology
- 17.12.5. Process Node
- 17.12.6. Rated Computing Capacity
- 17.12.7. Die Size
- 17.12.8. Number of Chiplets per Package
- 17.12.9. End-Use Industry × Application
- 17.13. Rest of Asia Pacific Chiplet Architecture Market
- 17.13.1. Country Segmental Analysis
- 17.13.2. Chiplet Type
- 17.13.3. Interconnect Technology
- 17.13.4. Packaging Technology
- 17.13.5. Process Node
- 17.13.6. Rated Computing Capacity
- 17.13.7. Die Size
- 17.13.8. Number of Chiplets per Package
- 17.13.9. End-Use Industry × Application
- 18. Middle East Chiplet Architecture Market Analysis
- 18.1. Key Segment Analysis
- 18.2. Regional Snapshot
- 18.3. Middle East Chiplet Architecture Market Size Volume (Million Units) and Value (US$ Bn), Analysis, and Forecasts, 2021-2035
- 18.3.1. Chiplet Type
- 18.3.2. Interconnect Technology
- 18.3.3. Packaging Technology
- 18.3.4. Process Node
- 18.3.5. Rated Computing Capacity
- 18.3.6. Die Size
- 18.3.7. Number of Chiplets per Package
- 18.3.8. End-Use Industry × Application
- 18.3.9. Country
- 18.3.9.1. Turkey
- 18.3.9.2. UAE
- 18.3.9.3. Saudi Arabia
- 18.3.9.4. Israel
- 18.3.9.5. Rest of Middle East
- 18.4. Turkey Chiplet Architecture Market
- 18.4.1. Country Segmental Analysis
- 18.4.2. Chiplet Type
- 18.4.3. Interconnect Technology
- 18.4.4. Packaging Technology
- 18.4.5. Process Node
- 18.4.6. Rated Computing Capacity
- 18.4.7. Die Size
- 18.4.8. Number of Chiplets per Package
- 18.4.9. End-Use Industry × Application
- 18.5. UAE Chiplet Architecture Market
- 18.5.1. Country Segmental Analysis
- 18.5.2. Chiplet Type
- 18.5.3. Interconnect Technology
- 18.5.4. Packaging Technology
- 18.5.5. Process Node
- 18.5.6. Rated Computing Capacity
- 18.5.7. Die Size
- 18.5.8. Number of Chiplets per Package
- 18.5.9. End-Use Industry × Application
- 18.6. Saudi Arabia Chiplet Architecture Market
- 18.6.1. Country Segmental Analysis
- 18.6.2. Chiplet Type
- 18.6.3. Interconnect Technology
- 18.6.4. Packaging Technology
- 18.6.5. Process Node
- 18.6.6. Rated Computing Capacity
- 18.6.7. Die Size
- 18.6.8. Number of Chiplets per Package
- 18.6.9. End-Use Industry × Application
- 18.7. Israel Chiplet Architecture Market
- 18.7.1. Country Segmental Analysis
- 18.7.2. Chiplet Type
- 18.7.3. Interconnect Technology
- 18.7.4. Packaging Technology
- 18.7.5. Process Node
- 18.7.6. Rated Computing Capacity
- 18.7.7. Die Size
- 18.7.8. Number of Chiplets per Package
- 18.7.9. End-Use Industry × Application
- 18.8. Rest of Middle East Chiplet Architecture Market
- 18.8.1. Country Segmental Analysis
- 18.8.2. Chiplet Type
- 18.8.3. Interconnect Technology
- 18.8.4. Packaging Technology
- 18.8.5. Process Node
- 18.8.6. Rated Computing Capacity
- 18.8.7. Die Size
- 18.8.8. Number of Chiplets per Package
- 18.8.9. End-Use Industry × Application
- 19. Africa Chiplet Architecture Market Analysis
- 19.1. Key Segment Analysis
- 19.2. Regional Snapshot
- 19.3. Africa Chiplet Architecture Market Size Volume (Million Units) and Value (US$ Bn), Analysis, and Forecasts, 2021-2035
- 19.3.1. Chiplet Type
- 19.3.2. Interconnect Technology
- 19.3.3. Packaging Technology
- 19.3.4. Process Node
- 19.3.5. Rated Computing Capacity
- 19.3.6. Die Size
- 19.3.7. Number of Chiplets per Package
- 19.3.8. End-Use Industry × Application
- 19.3.9. Country
- 19.3.9.1. South Africa
- 19.3.9.2. Egypt
- 19.3.9.3. Nigeria
- 19.3.9.4. Algeria
- 19.3.9.5. Rest of Africa
- 19.4. South Africa Chiplet Architecture Market
- 19.4.1. Country Segmental Analysis
- 19.4.2. Chiplet Type
- 19.4.3. Interconnect Technology
- 19.4.4. Packaging Technology
- 19.4.5. Process Node
- 19.4.6. Rated Computing Capacity
- 19.4.7. Die Size
- 19.4.8. Number of Chiplets per Package
- 19.4.9. End-Use Industry × Application
- 19.5. Egypt Chiplet Architecture Market
- 19.5.1. Country Segmental Analysis
- 19.5.2. Chiplet Type
- 19.5.3. Interconnect Technology
- 19.5.4. Packaging Technology
- 19.5.5. Process Node
- 19.5.6. Rated Computing Capacity
- 19.5.7. Die Size
- 19.5.8. Number of Chiplets per Package
- 19.5.9. End-Use Industry × Application
- 19.6. Nigeria Chiplet Architecture Market
- 19.6.1. Country Segmental Analysis
- 19.6.2. Chiplet Type
- 19.6.3. Interconnect Technology
- 19.6.4. Packaging Technology
- 19.6.5. Process Node
- 19.6.6. Rated Computing Capacity
- 19.6.7. Die Size
- 19.6.8. Number of Chiplets per Package
- 19.6.9. End-Use Industry × Application
- 19.7. Algeria Chiplet Architecture Market
- 19.7.1. Country Segmental Analysis
- 19.7.2. Chiplet Type
- 19.7.3. Interconnect Technology
- 19.7.4. Packaging Technology
- 19.7.5. Process Node
- 19.7.6. Rated Computing Capacity
- 19.7.7. Die Size
- 19.7.8. Number of Chiplets per Package
- 19.7.9. End-Use Industry × Application
- 19.8. Rest of Africa Chiplet Architecture Market
- 19.8.1. Country Segmental Analysis
- 19.8.2. Chiplet Type
- 19.8.3. Interconnect Technology
- 19.8.4. Packaging Technology
- 19.8.5. Process Node
- 19.8.6. Rated Computing Capacity
- 19.8.7. Die Size
- 19.8.8. Number of Chiplets per Package
- 19.8.9. End-Use Industry × Application
- 20. South America Chiplet Architecture Market Analysis
- 20.1. Key Segment Analysis
- 20.2. Regional Snapshot
- 20.3. South America Chiplet Architecture Market Size Volume (Million Units) and Value (US$ Bn), Analysis, and Forecasts, 2021-2035
- 20.3.1. Chiplet Type
- 20.3.2. Interconnect Technology
- 20.3.3. Packaging Technology
- 20.3.4. Process Node
- 20.3.5. Rated Computing Capacity
- 20.3.6. Die Size
- 20.3.7. Number of Chiplets per Package
- 20.3.8. End-Use Industry × Application
- 20.3.9. Country
- 20.3.9.1. Brazil
- 20.3.9.2. Argentina
- 20.3.9.3. Rest of South America
- 20.4. Brazil Chiplet Architecture Market
- 20.4.1. Country Segmental Analysis
- 20.4.2. Chiplet Type
- 20.4.3. Interconnect Technology
- 20.4.4. Packaging Technology
- 20.4.5. Process Node
- 20.4.6. Rated Computing Capacity
- 20.4.7. Die Size
- 20.4.8. Number of Chiplets per Package
- 20.4.9. End-Use Industry × Application
- 20.5. Argentina Chiplet Architecture Market
- 20.5.1. Country Segmental Analysis
- 20.5.2. Chiplet Type
- 20.5.3. Interconnect Technology
- 20.5.4. Packaging Technology
- 20.5.5. Process Node
- 20.5.6. Rated Computing Capacity
- 20.5.7. Die Size
- 20.5.8. Number of Chiplets per Package
- 20.5.9. End-Use Industry × Application
- 20.6. Rest of South America Chiplet Architecture Market
- 20.6.1. Country Segmental Analysis
- 20.6.2. Chiplet Type
- 20.6.3. Interconnect Technology
- 20.6.4. Packaging Technology
- 20.6.5. Process Node
- 20.6.6. Rated Computing Capacity
- 20.6.7. Die Size
- 20.6.8. Number of Chiplets per Package
- 20.6.9. End-Use Industry × Application
- 21. Key Players/ Company Profile
- 21.1. AMD (Advanced Micro Devices)
- 21.1.1. Company Details/ Overview
- 21.1.2. Company Financials
- 21.1.3. Key Customers and Competitors
- 21.1.4. Business/ Industry Portfolio
- 21.1.5. Product Portfolio/ Specification Details
- 21.1.6. Pricing Data
- 21.1.7. Strategic Overview
- 21.1.8. Recent Developments
- 21.2. Arm Holdings plc
- 21.3. Arteris
- 21.4. Broadcom Inc.
- 21.5. Cadence Design Systems, Inc.
- 21.6. Intel Corporation
- 21.7. JCET Group
- 21.8. Marvell Technology
- 21.9. MediaTek Inc.
- 21.10. Micron Technology
- 21.11. Nanya Technology Corporation
- 21.12. NVIDIA Corporation
- 21.13. NXP Semiconductors
- 21.14. Qualcomm Technologies
- 21.15. Renesas Electronics Corporation
- 21.16. Samsung Electronics
- 21.17. SK Hynix
- 21.18. Synopsys Inc.
- 21.19. TSMC (Taiwan Semiconductor Manufacturing Company)
- 21.20. Winbond Electronics Corporation
- 21.21. Other Key Players
- 21.1. AMD (Advanced Micro Devices)
Note* - This is just tentative list of players. While providing the report, we will cover more number of players based on their revenue and share for each geography
Research Design
Our research design integrates both demand-side and supply-side analysis through a balanced combination of primary and secondary research methodologies. By utilizing both bottom-up and top-down approaches alongside rigorous data triangulation methods, we deliver robust market intelligence that supports strategic decision-making.
MarketGenics' comprehensive research design framework ensures the delivery of accurate, reliable, and actionable market intelligence. Through the integration of multiple research approaches, rigorous validation processes, and expert analysis, we provide our clients with the insights needed to make informed strategic decisions and capitalize on market opportunities.

MarketGenics leverages a dedicated industry panel of experts and a comprehensive suite of paid databases to effectively collect, consolidate, and analyze market intelligence.
Our approach has consistently proven to be reliable and effective in generating accurate market insights, identifying key industry trends, and uncovering emerging business opportunities.
Through both primary and secondary research, we capture and analyze critical company-level data such as manufacturing footprints, including technical centers, R&D facilities, sales offices, and headquarters.
Our expert panel further enhances our ability to estimate market size for specific brands based on validated field-level intelligence.
Our data mining techniques incorporate both parametric and non-parametric methods, allowing for structured data collection, sorting, processing, and cleaning.
Demand projections are derived from large-scale data sets analyzed through proprietary algorithms, culminating in robust and reliable market sizing.
Research Approach
The bottom-up approach builds market estimates by starting with the smallest addressable market units and systematically aggregating them to create comprehensive market size projections.
This method begins with specific, granular data points and builds upward to create the complete market landscape.
Customer Analysis → Segmental Analysis → Geographical Analysis
The top-down approach starts with the broadest possible market data and systematically narrows it down through a series of filters and assumptions to arrive at specific market segments or opportunities.
This method begins with the big picture and works downward to increasingly specific market slices.
TAM → SAM → SOM


Research Methods
Desk / Secondary Research
While analysing the market, we extensively study secondary sources, directories, and databases to identify and collect information useful for this technical, market-oriented, and commercial report. Secondary sources that we utilize are not only the public sources, but it is a combination of Open Source, Associations, Paid Databases, MG Repository & Knowledgebase, and others.
- Company websites, annual reports, financial reports, broker reports, and investor presentations
- National government documents, statistical databases and reports
- News articles, press releases and web-casts specific to the companies operating in the market, Magazines, reports, and others
- We gather information from commercial data sources for deriving company specific data such as segmental revenue, share for geography, product revenue, and others
- Internal and external proprietary databases (industry-specific), relevant patent, and regulatory databases
- Governing Bodies, Government Organizations
- Relevant Authorities, Country-specific Associations for Industries
We also employ the model mapping approach to estimate the product level market data through the players' product portfolio
Primary Research
Primary research/ interviews is vital in analyzing the market. Most of the cases involves paid primary interviews. Primary sources include primary interviews through e-mail interactions, telephonic interviews, surveys as well as face-to-face interviews with the different stakeholders across the value chain including several industry experts.
| Type of Respondents | Number of Primaries |
|---|---|
| Tier 2/3 Suppliers | ~20 |
| Tier 1 Suppliers | ~25 |
| End-users | ~25 |
| Industry Expert/ Panel/ Consultant | ~30 |
| Total | ~100 |
MG Knowledgebase
• Repository of industry blog, newsletter and case studies
• Online platform covering detailed market reports, and company profiles
Forecasting Factors and Models
Forecasting Factors
- Historical Trends – Past market patterns, cycles, and major events that shaped how markets behave over time. Understanding past trends helps predict future behavior.
- Industry Factors – Specific characteristics of the industry like structure, regulations, and innovation cycles that affect market dynamics.
- Macroeconomic Factors – Economic conditions like GDP growth, inflation, and employment rates that affect how much money people have to spend.
- Demographic Factors – Population characteristics like age, income, and location that determine who can buy your product.
- Technology Factors – How quickly people adopt new technology and how much technology infrastructure exists.
- Regulatory Factors – Government rules, laws, and policies that can help or restrict market growth.
- Competitive Factors – Analyzing competition structure such as degree of competition and bargaining power of buyers and suppliers.
Forecasting Models / Techniques
Multiple Regression Analysis
- Identify and quantify factors that drive market changes
- Statistical modeling to establish relationships between market drivers and outcomes
Time Series Analysis – Seasonal Patterns
- Understand regular cyclical patterns in market demand
- Advanced statistical techniques to separate trend, seasonal, and irregular components
Time Series Analysis – Trend Analysis
- Identify underlying market growth patterns and momentum
- Statistical analysis of historical data to project future trends
Expert Opinion – Expert Interviews
- Gather deep industry insights and contextual understanding
- In-depth interviews with key industry stakeholders
Multi-Scenario Development
- Prepare for uncertainty by modeling different possible futures
- Creating optimistic, pessimistic, and most likely scenarios
Time Series Analysis – Moving Averages
- Sophisticated forecasting for complex time series data
- Auto-regressive integrated moving average models with seasonal components
Econometric Models
- Apply economic theory to market forecasting
- Sophisticated economic models that account for market interactions
Expert Opinion – Delphi Method
- Harness collective wisdom of industry experts
- Structured, multi-round expert consultation process
Monte Carlo Simulation
- Quantify uncertainty and probability distributions
- Thousands of simulations with varying input parameters
Research Analysis
Our research framework is built upon the fundamental principle of validating market intelligence from both demand and supply perspectives. This dual-sided approach ensures comprehensive market understanding and reduces the risk of single-source bias.
Demand-Side Analysis: We understand end-user/application behavior, preferences, and market needs along with the penetration of the product for specific application.
Supply-Side Analysis: We estimate overall market revenue, analyze the segmental share along with industry capacity, competitive landscape, and market structure.
Validation & Evaluation
Data triangulation is a validation technique that uses multiple methods, sources, or perspectives to examine the same research question, thereby increasing the credibility and reliability of research findings. In market research, triangulation serves as a quality assurance mechanism that helps identify and minimize bias, validate assumptions, and ensure accuracy in market estimates.
- Data Source Triangulation – Using multiple data sources to examine the same phenomenon
- Methodological Triangulation – Using multiple research methods to study the same research question
- Investigator Triangulation – Using multiple researchers or analysts to examine the same data
- Theoretical Triangulation – Using multiple theoretical perspectives to interpret the same data

Custom Market Research Services
We will customise the research for you, in case the report listed above does not meet your requirements.
Get 10% Free Customisation