Computer Vision and Image Recognition Technology Market Size, Share & Trends Analysis Report by Component (Vision Algorithms & Models, Cameras & Image Sensors, Edge Devices & Vision Accelerators, Middleware & SDKs (CV libraries, APIs), Cloud Vision Services & Platforms, Annotation & Labeling Tools, Analytics & Visualization Dashboards, Model Management & MLOps for CV, Others), Deployment Mode, Technology, Functionality, Integration, Organization Size, Application/ Use Case, Industry Vertical and Geography (North America, Europe, Asia Pacific, Middle East, Africa, and South America) – Global Industry Data, Trends, and Forecasts, 2026–2035
|
Market Structure & Evolution |
|
|
Segmental Data Insights |
|
|
Demand Trends |
|
|
Competitive Landscape |
|
|
Strategic Development |
|
|
Future Outlook & Opportunities |
|
Computer Vision and Image Recognition Technology Market Size, Share, and Growth
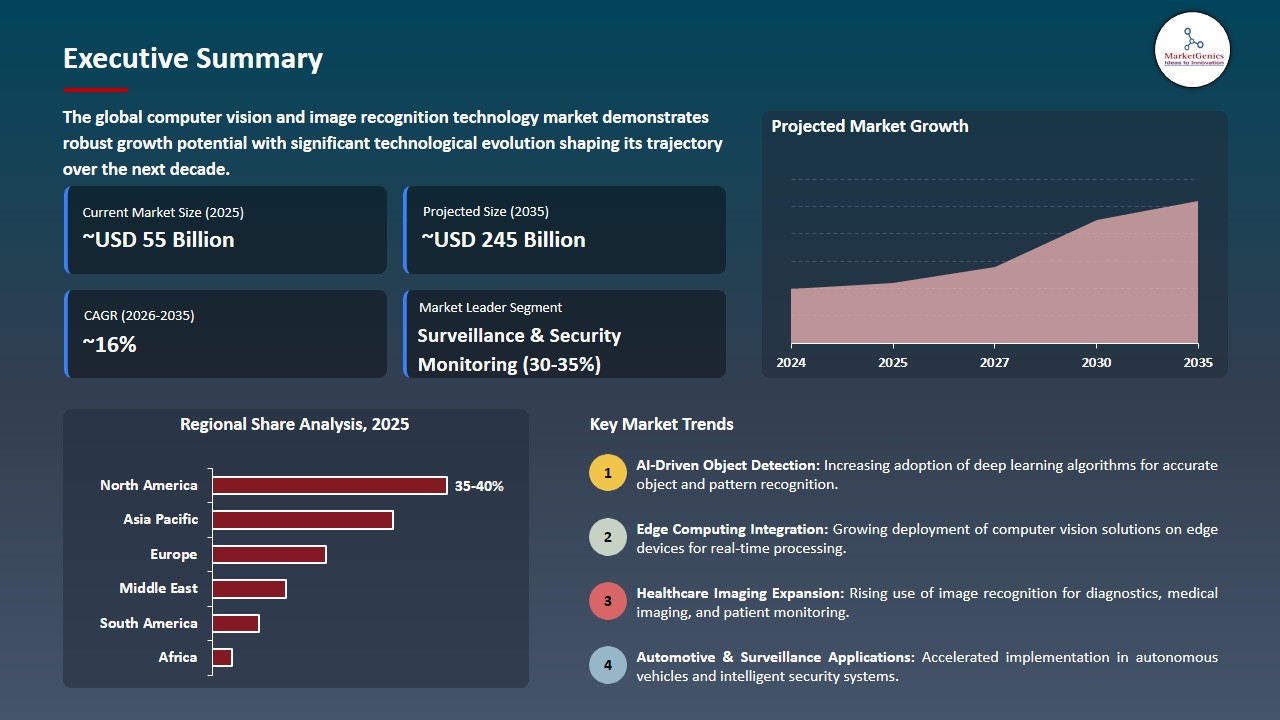
The global computer vision and image recognition technology market is experiencing robust growth, with its estimated value of USD 54.6 billion in the year 2025 and USD 245.3 billion by the period 2035, registering a CAGR of 16.2% during the forecast period.
Kit Merker, CEO of Plainsight Technologies, stated, "At Plainsight we make it easy for businesses to add AI-powered computer vision to their operations - however, we also handle the part which is often difficult i.e. the continuous updates and management of computer vision by streamlining that."
The computer vision and image recognition technologies market is expanding fast all over the globe, mainly powered by improved deep-learning models and edge-AI systems that have been found to be very accurate and reliable. Leading technology providers like NVIDIA, Google Cloud, Amazon Web Services, and Microsoft Azure keep on launching more efficient computer-vision frameworks that help enterprises to process images and video streams in real time with a higher degree of accuracy.
The growing automation trend across manufacturing, logistics, retail, healthcare, and smart-city projects has become the main reason of the huge demand for powerful vision technologies. Retailers and logistics companies are implementing AI-powered video analytics and automated inventory tracking, whereas healthcare providers are using vision-based diagnostic support tools. Besides that, the automobile sector is heavily investing in the development of vision-powered ADAS and driver-monitoring systems that are fundamental for vehicle safety and autonomy.
Moreover, tougher regulatory and compliance standards in areas like transportation, pharmaceuticals, and food & beverage, are compelling organizations to install real-time monitoring and inspection systems. The combination of technology progression, industry adoption, and increased safety standards is the main factor behind the expansion of the computer vision market leading to the improvements in efficiency, quality, and decision-making.
There are several adjacent opportunities such as edge-AI hardware, industrial robotics, automated inspection platforms, smart-camera systems, AI-driven video management software, and advanced biometric authentication. By utilizing these adjacent segments, manufacturers can not only enhance their computer-vision portfolios but also increase their revenues across enterprise AI and automation markets.
Computer Vision and Image Recognition Technology Market Dynamics and Trends
Driver: Increasing Automation, Safety Standards, and Real-Time Analytics Mandates Driving Adoption of Computer Vision Technologies
-
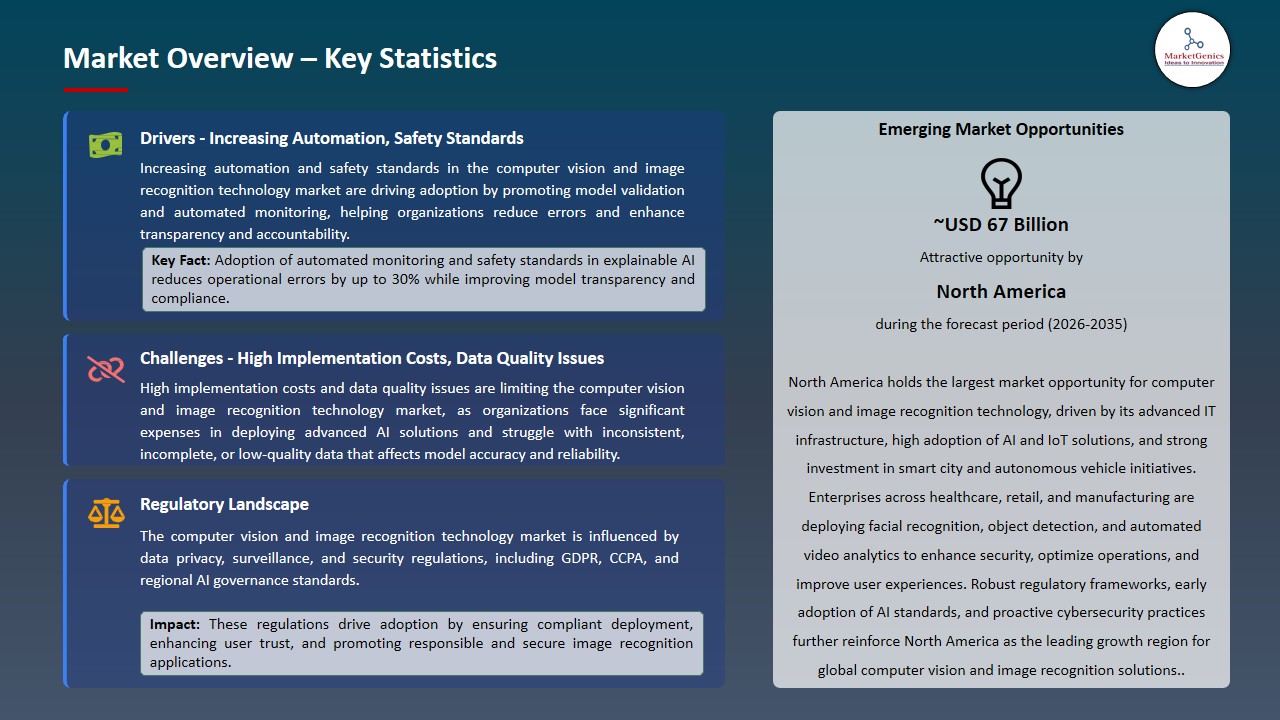
Global demand for automation in sectors such as manufacturing, logistics, retail, automotive, and healthcare is the main driver for the rapid adoption of advanced computer vision systems. Besides that, regulatory frameworks like the U.S. FDA’s requirements for automated quality inspection in pharmaceutical manufacturing, the EU’s General Product Safety Regulation (GPSR), and ISO standards for machine safety, are compelling companies to deploy AI-based visual inspection and monitoring solutions.
- In addition, aviation, transportation, and smart-city authorities are increasingly requiring the use of real-time video analytics for safety and compliance purposes. For example, a number of EU member states have incorporated AI-powered traffic monitoring and automated incident detection in conformity with their Vision Zero road-safety pledges, thus, providing a clear indication of the transition to AI-supported public-safety operations.
- The growth of e-commerce and omnichannel retail is a continuous source of demand for automated shelf analytics, loss prevention systems, and AI-assisted customer behavior analysis, which are heavily reliant on high-accuracy image recognition and real-time video intelligence.
Restraint: High Implementation Costs, Data Quality Issues, and Integration Challenges Limiting Large-Scale Deployment
-
While the overall growth has been quite rapid, it is still a challenge for the enterprise-grade computer vision to be widely adopted due to the high cost of AI training, edge hardware accelerators, and multi-camera infrastructure, in particular, for SMEs and organizations in emerging markets. Apart from that, the legacy CCTV and analog infrastructure impose additional integration friction.
- Low image quality, bad lighting conditions, unstructured video data, and a shortage of labeled datasets have often been cited as the main reasons for model accuracy in which case the lack of labeled datasets is frequently considered as the biggest problem. A large number of firms find dataset preparation and continuous model retraining so difficult that they increase the complexity of deployment.
- Privacy regulations like GDPR, CCPA, and the EU AI Act set very strict requirements for video data storage, biometric processing, and algorithm transparency. It is very difficult to balance compliance with operational needs which is still the biggest obstacle for facial recognition or behavioral analytics applications, in particular.
Opportunity: Expansion of Edge AI, Industry 4.0, and Smart Infrastructure Programs
-
Rapid rollout of Industry 4.0 programs in Asia-Pacific, Europe, and North America is the main reason for a large-scale deployment of vision-based automated inspection, robotics navigation, and predictive maintenance systems. Digital manufacturing adoption is greatly facilitated by the governments granting incentives, hence the strong uptake of vision-AI tools.
- Smart infrastructure projects-like India’s Smart Cities Mission, ASEAN’s smart mobility programs, and Middle East mega-city projects (NEOM, Masdar)-are leading to the demand for traffic analytics, crowd management, and the use of the public-safety vision platforms.
- The expansion of edge AI hardware (for example, NVIDIA Jetson, Intel Movidius, Qualcomm Cloud AI 100) is allowing local image recognition to be performed in real-time with lower latency and at a reduced cloud cost. Accordingly, there is a great potential to be realized by on-device analytics, privacy-preserving inference, and decentralized video processing solution providers.
Key Trend: Fusion of Vision AI, Multimodal Models, and 3D Perception Transforming Computer Vision Capabilities
-
Companies are focused on integrating multiple modalities (or types) into one model instead of just using one (text, video, audio, etc.) for example Video AI. This helps provide more information from a scene than only using one type of image recognition. Recent breakthroughs from Google, OpenAI, Meta and NVIDIA have allowed companies to create these types of Deep Scene Analysis Models (DSAM), thus enabling companies to specifically create Products with better Image/Scene Understanding. There are many computer vision companies using these types of models.
- Robotics, Autonomous Mobility and AR/VR (Augmented Reality/Virtual Reality) are increasingly adopting 3D Vision, Depth Sensors and/or Spatial AI (Lidar Fusion, SLAM and Volumetric Imaging), leading to increased Demand for Intelligent Robots, Warehouse Automation and Autonomous Inspection System Capabilities.
- Companies are utilizing ethical AI Frameworks and the EU AI Act in order to provide Accountability, Explainability and Safety for Image Recognition Products. This will Create Development Pipelines of Image Recognition capabilities that can scale Globally With Responsibility.
Computer-Vision-and-Image-Recognition-Technology-Market Analysis and Segmental Data
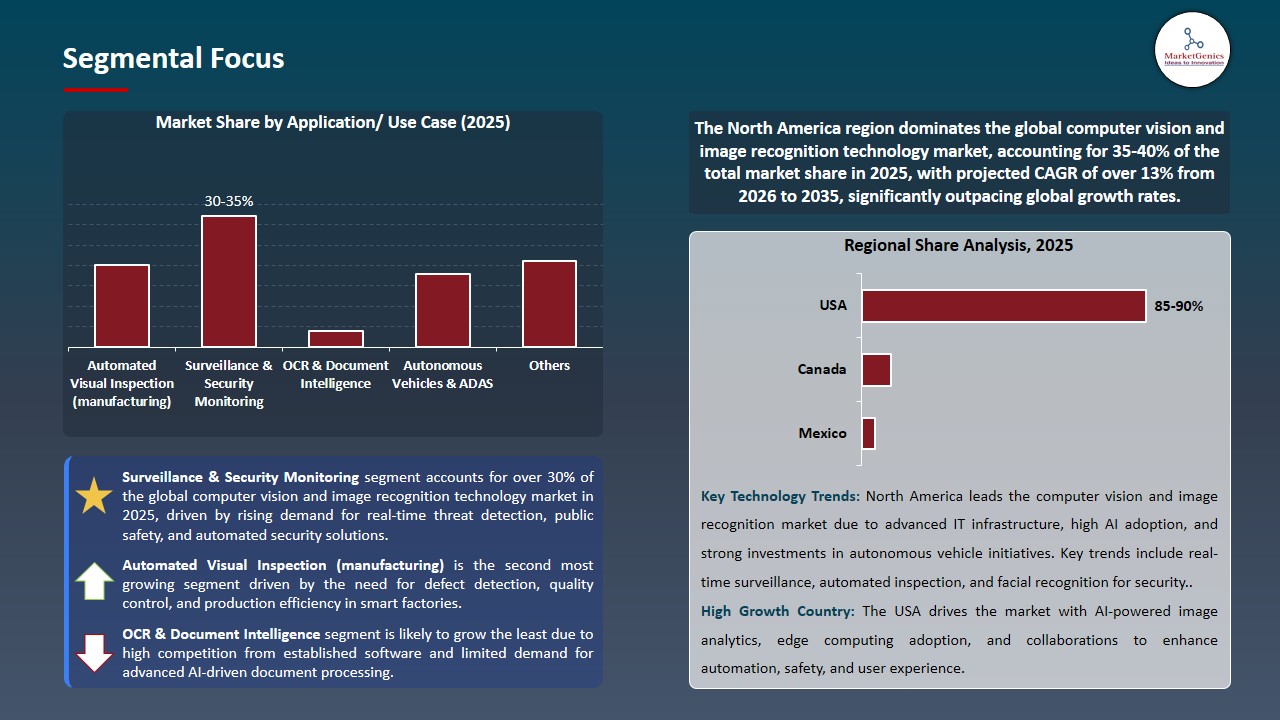
“Surveillance & Security Monitoring Dominates Global Computer Vision and Image Recognition Technology Market"
-
The security & surveillance sector currently holds a prominent position within the worldwide computer vision/image recognition marketplace. The rise of large-scale city or governmental deployment of AI based video analytics has enabled this sector to flourish. As an example of this growth, Bhubaneswar Smart City Ltd recently expanded its network by adding 1500 AI-based video surveillance cameras which now totals approximately 3300 units deployed within the city for the purpose of improving public safety measures especially for high-risk communities.
- The Delhi Safe City Project has deployed 3500 AI enabled video surveillance cameras with integrated facial recognition technology and gunshot detection technology to provide additional supportive resources for law enforcement, improve protection of women and provide quicker response times for threats to public safety in highly populated areas. In anticipation of the Mahakumbh celebration in the Prayagraj region in 2025, approximately 2700 cameras including more than 400 AI powered units were installed to assist with crowd management, traffic flow and facilitate the provision of civic services.
- For instance, Yotta Data Services, in partnership with Blaize Holdings, have retrofitted more than 250,000 CCTV camera installations throughout India into 'edge AI' enabled surveillance endpoints and have demonstrated the evolution of public safety infrastructures through the use of real-time computer vision and analytics. With these types of advancements and efficiencies being generated from these systems, it is evident that the surveillance & security monitoring dominates global computer vision and image recognition technology market.
“North America Leads the Computer Vision and Image Recognition Technology Market"
-
North America is the biggest place for computer vision and image recognition technologies market around the world. This is mainly because of the presence of major technology companies, AI research centers, and industries that are quick to adopt, such as healthcare, retail, finance, and transportation. The region's strict data privacy and security regulations, such as HIPAA and a number of state-level data protection laws, also help the deployment of AI-powered vision systems that are secure and compliant.
- The key examples of implementation are Microsoft's Azure Video Analyzer for real-time AI video analytics; NVIDIA's DeepStream and Metropolis platforms for industrial and smart-city applications; and Amazon Web Services' Rekognition service for facial recognition and anomaly detection. Such deployments position North America as a tech leader and show the presence of a strong ecosystem in the region which facilitates AI-enabled computer vision adoption to thrive.
- Further, in the healthcare and transportation industries, for instance, computer vision is gradually becoming the technology of choice for real-time monitoring, quality control, and predictive maintenance. As an illustration, numerous hospitals throughout the United States have onboarded AI-powered imaging systems not only for diagnostics but also for the whole hospital operations, thereby setting a regional example of secure, regulation-compliant adoption of advanced vision technologies.
Computer-Vision-and-Image-Recognition-Technology-Market Ecosystem
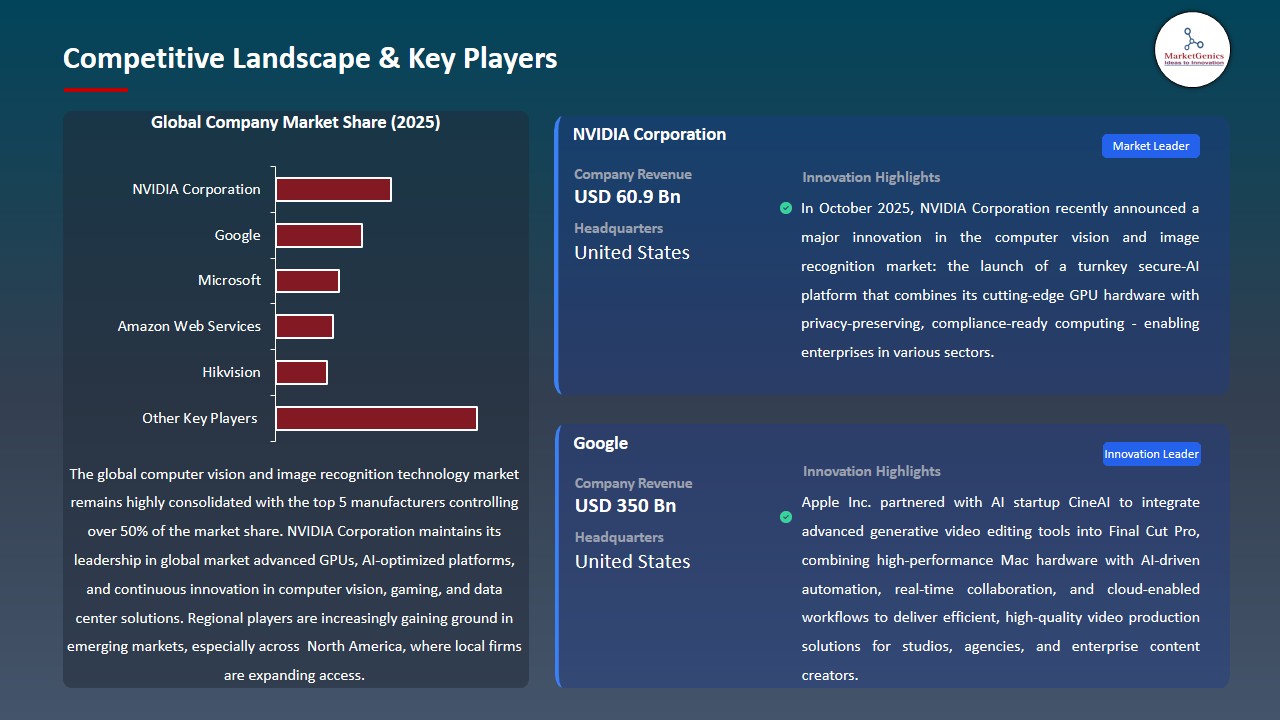
The worldwide computer vision and image recognition market is becoming more and more consolidated where the top companies such as NVIDIA, Intel, Google, Microsoft, Amazon Web Services, Cognex, and Basler are dominating through their advanced technologies and large-scale deployments.
These major players focus on product specialization that eventually leads to the breakthrough. To power the AI, NVIDIA invests in the development of AI-powered GPUs and edge computing platforms for autonomous vehicles, robotics, and real-time vision applications. Google offers cloud-based APIs for object detection, OCR, facial recognition, and large-scale image analytics, whereas Cognex and Basler provide industrial-grade machine vision systems for quality inspection and manufacturing automation.
The government bodies, research institutions, and R&D organizations are the other major contributors that take the field to the next level. At CVPR 2025 in June, researchers presented generative-AI and edge-ready vision models, among them mobile-first image-to-video solutions, showing that institutions are heavily investing in the future of computer vision. Besides, market leaders are turning the spotlight on product diversification and integrated solutions. In July 2025, Cognex unveiled VisionPro 3D, an industrial inspection deep-learning and 3D imaging platform with high precision. By the same token, RealSense launched AI-enabled D555 depth cameras for robotics and security that can provide low-latency perception and improved object detection.
These changes are a clear signal that the computer vision and image recognition technology market has strong innovation capability, is becoming more operationally efficient, and is being used by more and more industries.
Recent Development and Strategic Overview:
-
In September 2025, Cognex upgraded its VisionPro Edge AI platform to allow the manufacturers to set up on-the-fly visual inspection and quality control systems which can be run on different production lines. The platform fuses deep learning-based object detection with 3D imaging and hence, can share data from one machine to another without the need for a central controller, which in turn, saves time and ensures a higher level of product uniformity.
- In July 2025, NVIDIA came up with its Metropolis AI Video Analytics Suite for smart cities that can be used to implement the scalable computer vision applications required for traffic monitoring, public safety, and infrastructure management. This product uses edge AI and deep-learning models to perform local video stream analysis, thus giving the systems the capability to make their own decisions and issue alerts in real-time, while at the same time, ensuring privacy and reducing the dependence on central servers.
Report Scope
|
Attribute |
Detail |
|
Market Size in 2025 |
USD 54.6 Bn |
|
Market Forecast Value in 2035 |
USD 245.3 Bn |
|
Growth Rate (CAGR) |
16.2% |
|
Forecast Period |
2026 – 2035 |
|
Historical Data Available for |
2021 – 2024 |
|
Market Size Units |
USD Bn for Value |
|
Report Format |
Electronic (PDF) + Excel |
|
Regions and Countries Covered |
|||||
|
North America |
Europe |
Asia Pacific |
Middle East |
Africa |
South America |
|
|
|
|
|
|
|
Companies Covered |
|||||
|
|
|
|
|
|
Computer-Vision-and-Image-Recognition-Technology-Market Segmentation and Highlights
|
Segment |
Sub-segment |
|
Computer Vision and Image Recognition Technology Market, By Component |
|
|
Computer Vision and Image Recognition Technology Market, By Deployment Mode |
|
|
Computer Vision and Image Recognition Technology Market, By Technology |
|
|
Computer Vision and Image Recognition Technology Market, By Functionality |
|
|
Computer Vision and Image Recognition Technology Market, By Integration |
|
|
Computer Vision and Image Recognition Technology Market, By Organization Size |
|
|
Computer Vision and Image Recognition Technology Market, By Application/ Use Case |
|
|
Computer Vision and Image Recognition Technology Market, By Industry Vertical |
|
Frequently Asked Questions
Table of Contents
- 1. Research Methodology and Assumptions
- 1.1. Definitions
- 1.2. Research Design and Approach
- 1.3. Data Collection Methods
- 1.4. Base Estimates and Calculations
- 1.5. Forecasting Models
- 1.5.1. Key Forecast Factors & Impact Analysis
- 1.6. Secondary Research
- 1.6.1. Open Sources
- 1.6.2. Paid Databases
- 1.6.3. Associations
- 1.7. Primary Research
- 1.7.1. Primary Sources
- 1.7.2. Primary Interviews with Stakeholders across Ecosystem
- 2. Executive Summary
- 2.1. Global Computer Vision and Image Recognition Technology Market Outlook
- 2.1.1. Computer Vision and Image Recognition Technology Market Size (Value - US$ Bn), and Forecasts, 2021-2035
- 2.1.2. Compounded Annual Growth Rate Analysis
- 2.1.3. Growth Opportunity Analysis
- 2.1.4. Segmental Share Analysis
- 2.1.5. Geographical Share Analysis
- 2.2. Market Analysis and Facts
- 2.3. Supply-Demand Analysis
- 2.4. Competitive Benchmarking
- 2.5. Go-to- Market Strategy
- 2.5.1. Customer/ End-use Industry Assessment
- 2.5.2. Growth Opportunity Data, 2026-2035
- 2.5.2.1. Regional Data
- 2.5.2.2. Country Data
- 2.5.2.3. Segmental Data
- 2.5.3. Identification of Potential Market Spaces
- 2.5.4. GAP Analysis
- 2.5.5. Potential Attractive Price Points
- 2.5.6. Prevailing Market Risks & Challenges
- 2.5.7. Preferred Sales & Marketing Strategies
- 2.5.8. Key Recommendations and Analysis
- 2.5.9. A Way Forward
- 2.1. Global Computer Vision and Image Recognition Technology Market Outlook
- 3. Industry Data and Premium Insights
- 3.1. Global Information Technology & Media Ecosystem Overview, 2025
- 3.1.1. Information Technology & Media Industry Analysis
- 3.1.2. Key Trends for Information Technology & Media Industry
- 3.1.3. Regional Distribution for Information Technology & Media Industry
- 3.2. Supplier Customer Data
- 3.3. Technology Roadmap and Developments
- 3.1. Global Information Technology & Media Ecosystem Overview, 2025
- 4. Market Overview
- 4.1. Market Dynamics
- 4.1.1. Drivers
- 4.1.1.1. Rising demand for automated image analysis, object detection, and visual inspection across industries.
- 4.1.1.2. Growing integration of deep learning algorithms for facial recognition, anomaly detection, and real-time surveillance applications.
- 4.1.1.3. Increasing investment in cloud-based vision APIs, edge-enabled cameras, and AI-powered analytics platforms for scalable computer vision deployment.
- 4.1.2. Restraints
- 4.1.2.1. High costs associated with advanced GPU infrastructure, model training, and high-resolution imaging systems.
- 4.1.2.2. Integration challenges with legacy imaging tools, fragmented data formats, and varied enterprise security requirements.
- 4.1.1. Drivers
- 4.2. Key Trend Analysis
- 4.3. Regulatory Framework
- 4.3.1. Key Regulations, Norms, and Subsidies, by Key Countries
- 4.3.2. Tariffs and Standards
- 4.3.3. Impact Analysis of Regulations on the Market
- 4.4. Value Chain Analysis
- 4.4.1. Data Acquisition, Labeling & Model Training Infrastructure Providers
- 4.4.2. System Integrators/ Technology Providers
- 4.4.3. Computer Vision and Image Recognition Technology Providers
- 4.4.4. End Users
- 4.5. Cost Structure Analysis
- 4.5.1. Parameter’s Share for Cost Associated
- 4.5.2. COGP vs COGS
- 4.5.3. Profit Margin Analysis
- 4.6. Pricing Analysis
- 4.6.1. Regional Pricing Analysis
- 4.6.2. Segmental Pricing Trends
- 4.6.3. Factors Influencing Pricing
- 4.7. Porter’s Five Forces Analysis
- 4.8. PESTEL Analysis
- 4.9. Global Computer Vision and Image Recognition Technology Market Demand
- 4.9.1. Historical Market Size –Value (US$ Bn), 2020-2024
- 4.9.2. Current and Future Market Size –Value (US$ Bn), 2026–2035
- 4.9.2.1. Y-o-Y Growth Trends
- 4.9.2.2. Absolute $ Opportunity Assessment
- 4.1. Market Dynamics
- 5. Competition Landscape
- 5.1. Competition structure
- 5.1.1. Fragmented v/s consolidated
- 5.2. Company Share Analysis, 2025
- 5.2.1. Global Company Market Share
- 5.2.2. By Region
- 5.2.2.1. North America
- 5.2.2.2. Europe
- 5.2.2.3. Asia Pacific
- 5.2.2.4. Middle East
- 5.2.2.5. Africa
- 5.2.2.6. South America
- 5.3. Product Comparison Matrix
- 5.3.1. Specifications
- 5.3.2. Market Positioning
- 5.3.3. Pricing
- 5.1. Competition structure
- 6. Global Computer Vision and Image Recognition Technology Market Analysis, by Component
- 6.1. Key Segment Analysis
- 6.2. Computer Vision and Image Recognition Technology Market Size (Value - US$ Bn), Analysis, and Forecasts, by Component, 2021-2035
- 6.2.1. Vision Algorithms & Models
- 6.2.2. Cameras & Image Sensors
- 6.2.3. Edge Devices & Vision Accelerators
- 6.2.4. Middleware & SDKs (CV libraries, APIs)
- 6.2.5. Cloud Vision Services & Platforms
- 6.2.6. Annotation & Labeling Tools
- 6.2.7. Analytics & Visualization Dashboards
- 6.2.8. Model Management & MLOps for CV
- 6.2.9. Others
- 7. Global Computer Vision and Image Recognition Technology Market Analysis, by Deployment Mode
- 7.1. Key Segment Analysis
- 7.2. Computer Vision and Image Recognition Technology Market Size (Value - US$ Bn), Analysis, and Forecasts, by Deployment Mode, 2021-2035
- 7.2.1. Cloud-Based
- 7.2.2. On-Premises
- 7.2.3. Hybrid
- 8. Global Computer Vision and Image Recognition Technology Market Analysis, by Technology
- 8.1. Key Segment Analysis
- 8.2. Computer Vision and Image Recognition Technology Market Size (Value - US$ Bn), Analysis, and Forecasts, by Technology, 2021-2035
- 8.2.1. Deep Learning / CNN-based Models
- 8.2.2. Transformer-based Vision Models (ViT, etc.)
- 8.2.3. Classical Computer Vision (feature-based)
- 8.2.4. 3D Vision / Depth Sensing & Stereo Vision
- 8.2.5. Optical Character Recognition (OCR)
- 8.2.6. Facial Recognition / Biometrics
- 8.2.7. Instance / Semantic / Panoptic Segmentation
- 8.2.8. Object Detection & Tracking
- 8.2.9. Others
- 9. Global Computer Vision and Image Recognition Technology Market Analysis, by Functionality
- 9.1. Key Segment Analysis
- 9.2. Computer Vision and Image Recognition Technology Market Size (Value - US$ Bn), Analysis, and Forecasts, by Functionality, 2021-2035
- 9.2.1. Real-time Object Detection & Alerts
- 9.2.2. Visual Quality / Defect Classification
- 9.2.3. Facial / Emotion / Gaze Analysis
- 9.2.4. Visual Search & Similarity Matching
- 9.2.5. Scene Understanding & Contextual Reasoning
- 9.2.6. Pose Estimation & Human Activity Recognition
- 9.2.7. Anomaly Detection & Predictive Maintenance
- 9.2.8. Others
- 10. Global Computer Vision and Image Recognition Technology Market Analysis, by Integration
- 10.1. Key Segment Analysis
- 10.2. Computer Vision and Image Recognition Technology Market Size (Value - US$ Bn), Analysis, and Forecasts, by Integration, 2021-2035
- 10.2.1. Camera OEM + Embedded AI bundles
- 10.2.2. Robotics / Automation platform integrations
- 10.2.3. VMS / Video analytics integrations (security)
- 10.2.4. ERP / MES / Healthcare PACS integrations
- 10.2.5. Third-party model marketplace & pre-trained models
- 10.2.6. Others
- 11. Global Computer Vision and Image Recognition Technology Market Analysis, by Organization Size
- 11.1. Key Segment Analysis
- 11.2. Computer Vision and Image Recognition Technology Market Size (Value - US$ Bn), Analysis, and Forecasts, by Organization Size, 2021-2035
- 11.2.1. Large Enterprises
- 11.2.2. Small & Medium Enterprises (SMEs)
- 12. Global Computer Vision and Image Recognition Technology Market Analysis, by Application/ Use Case
- 12.1. Key Segment Analysis
- 12.2. Computer Vision and Image Recognition Technology Market Size (Value - US$ Bn), Analysis, and Forecasts, by Application/ Use Case, 2021-2035
- 12.2.1. Automated Visual Inspection (manufacturing)
- 12.2.2. Autonomous Vehicles & ADAS
- 12.2.3. Surveillance & Security Monitoring
- 12.2.4. Retail Analytics & Visual Merchandising
- 12.2.5. Medical Imaging & Diagnostics
- 12.2.6. Agriculture / Precision Farming (crop analytics)
- 12.2.7. Robotics Perception & Navigation
- 12.2.8. OCR & Document Intelligence
- 12.2.9. Others
- 13. Global Computer Vision and Image Recognition Technology Market Analysis, by Industry Vertical
- 13.1. Key Segment Analysis
- 13.2. Computer Vision and Image Recognition Technology Market Size (Value - US$ Bn), Analysis, and Forecasts, by Industry Vertical, 2021-2035
- 13.2.1. Automotive & Transportation
- 13.2.2. Healthcare & Life Sciences
- 13.2.3. Manufacturing & Industrial Automation
- 13.2.4. Security & Public Safety
- 13.2.5. Retail & E-commerce
- 13.2.6. Agriculture & Forestry
- 13.2.7. Media & Entertainment
- 13.2.8. Smart Cities & Infrastructure
- 13.2.9. Others
- 14. Global Computer Vision and Image Recognition Technology Market Analysis and Forecasts, by Region
- 14.1. Key Findings
- 14.2. Computer Vision and Image Recognition Technology Market Size (Value - US$ Bn), Analysis, and Forecasts, by Region, 2021-2035
- 14.2.1. North America
- 14.2.2. Europe
- 14.2.3. Asia Pacific
- 14.2.4. Middle East
- 14.2.5. Africa
- 14.2.6. South America
- 15. North America Computer Vision and Image Recognition Technology Market Analysis
- 15.1. Key Segment Analysis
- 15.2. Regional Snapshot
- 15.3. North America Computer Vision and Image Recognition Technology Market Size Value - US$ Bn), Analysis, and Forecasts, 2021-2035
- 15.3.1. Component
- 15.3.2. Deployment Mode
- 15.3.3. Technology
- 15.3.4. Functionality
- 15.3.5. Integration
- 15.3.6. Organization Size
- 15.3.7. Application/ Use Case
- 15.3.8. Industry Vertical
- 15.3.9. Country
- 15.3.9.1. USA
- 15.3.9.2. Canada
- 15.3.9.3. Mexico
- 15.4. USA Computer Vision and Image Recognition Technology Market
- 15.4.1. Country Segmental Analysis
- 15.4.2. Component
- 15.4.3. Deployment Mode
- 15.4.4. Technology
- 15.4.5. Functionality
- 15.4.6. Integration
- 15.4.7. Organization Size
- 15.4.8. Application/ Use Case
- 15.4.9. Industry Vertical
- 15.5. Canada Computer Vision and Image Recognition Technology Market
- 15.5.1. Country Segmental Analysis
- 15.5.2. Component
- 15.5.3. Deployment Mode
- 15.5.4. Technology
- 15.5.5. Functionality
- 15.5.6. Integration
- 15.5.7. Organization Size
- 15.5.8. Application/ Use Case
- 15.5.9. Industry Vertical
- 15.6. Mexico Computer Vision and Image Recognition Technology Market
- 15.6.1. Country Segmental Analysis
- 15.6.2. Component
- 15.6.3. Deployment Mode
- 15.6.4. Technology
- 15.6.5. Functionality
- 15.6.6. Integration
- 15.6.7. Organization Size
- 15.6.8. Application/ Use Case
- 15.6.9. Industry Vertical
- 16. Europe Computer Vision and Image Recognition Technology Market Analysis
- 16.1. Key Segment Analysis
- 16.2. Regional Snapshot
- 16.3. Europe Computer Vision and Image Recognition Technology Market Size (Value - US$ Bn), Analysis, and Forecasts, 2021-2035
- 16.3.1. Component
- 16.3.2. Deployment Mode
- 16.3.3. Technology
- 16.3.4. Functionality
- 16.3.5. Integration
- 16.3.6. Organization Size
- 16.3.7. Application/ Use Case
- 16.3.8. Industry Vertical
- 16.3.9. Country
- 16.3.9.1. Germany
- 16.3.9.2. United Kingdom
- 16.3.9.3. France
- 16.3.9.4. Italy
- 16.3.9.5. Spain
- 16.3.9.6. Netherlands
- 16.3.9.7. Nordic Countries
- 16.3.9.8. Poland
- 16.3.9.9. Russia & CIS
- 16.3.9.10. Rest of Europe
- 16.4. Germany Computer Vision and Image Recognition Technology Market
- 16.4.1. Country Segmental Analysis
- 16.4.2. Component
- 16.4.3. Deployment Mode
- 16.4.4. Technology
- 16.4.5. Functionality
- 16.4.6. Integration
- 16.4.7. Organization Size
- 16.4.8. Application/ Use Case
- 16.4.9. Industry Vertical
- 16.5. United Kingdom Computer Vision and Image Recognition Technology Market
- 16.5.1. Country Segmental Analysis
- 16.5.2. Component
- 16.5.3. Deployment Mode
- 16.5.4. Technology
- 16.5.5. Functionality
- 16.5.6. Integration
- 16.5.7. Organization Size
- 16.5.8. Application/ Use Case
- 16.5.9. Industry Vertical
- 16.6. France Computer Vision and Image Recognition Technology Market
- 16.6.1. Country Segmental Analysis
- 16.6.2. Component
- 16.6.3. Deployment Mode
- 16.6.4. Technology
- 16.6.5. Functionality
- 16.6.6. Integration
- 16.6.7. Organization Size
- 16.6.8. Application/ Use Case
- 16.6.9. Industry Vertical
- 16.7. Italy Computer Vision and Image Recognition Technology Market
- 16.7.1. Country Segmental Analysis
- 16.7.2. Component
- 16.7.3. Deployment Mode
- 16.7.4. Technology
- 16.7.5. Functionality
- 16.7.6. Integration
- 16.7.7. Organization Size
- 16.7.8. Application/ Use Case
- 16.7.9. Industry Vertical
- 16.8. Spain Computer Vision and Image Recognition Technology Market
- 16.8.1. Country Segmental Analysis
- 16.8.2. Component
- 16.8.3. Deployment Mode
- 16.8.4. Technology
- 16.8.5. Functionality
- 16.8.6. Integration
- 16.8.7. Organization Size
- 16.8.8. Application/ Use Case
- 16.8.9. Industry Vertical
- 16.9. Netherlands Computer Vision and Image Recognition Technology Market
- 16.9.1. Country Segmental Analysis
- 16.9.2. Component
- 16.9.3. Deployment Mode
- 16.9.4. Technology
- 16.9.5. Functionality
- 16.9.6. Integration
- 16.9.7. Organization Size
- 16.9.8. Application/ Use Case
- 16.9.9. Industry Vertical
- 16.10. Nordic Countries Computer Vision and Image Recognition Technology Market
- 16.10.1. Country Segmental Analysis
- 16.10.2. Component
- 16.10.3. Deployment Mode
- 16.10.4. Technology
- 16.10.5. Functionality
- 16.10.6. Integration
- 16.10.7. Organization Size
- 16.10.8. Application/ Use Case
- 16.10.9. Industry Vertical
- 16.11. Poland Computer Vision and Image Recognition Technology Market
- 16.11.1. Country Segmental Analysis
- 16.11.2. Component
- 16.11.3. Deployment Mode
- 16.11.4. Technology
- 16.11.5. Functionality
- 16.11.6. Integration
- 16.11.7. Organization Size
- 16.11.8. Application/ Use Case
- 16.11.9. Industry Vertical
- 16.12. Russia & CIS Computer Vision and Image Recognition Technology Market
- 16.12.1. Country Segmental Analysis
- 16.12.2. Component
- 16.12.3. Deployment Mode
- 16.12.4. Technology
- 16.12.5. Functionality
- 16.12.6. Integration
- 16.12.7. Organization Size
- 16.12.8. Application/ Use Case
- 16.12.9. Industry Vertical
- 16.13. Rest of Europe Computer Vision and Image Recognition Technology Market
- 16.13.1. Country Segmental Analysis
- 16.13.2. Component
- 16.13.3. Deployment Mode
- 16.13.4. Technology
- 16.13.5. Functionality
- 16.13.6. Integration
- 16.13.7. Organization Size
- 16.13.8. Application/ Use Case
- 16.13.9. Industry Vertical
- 17. Asia Pacific Computer Vision and Image Recognition Technology Market Analysis
- 17.1. Key Segment Analysis
- 17.2. Regional Snapshot
- 17.3. Asia Pacific Computer Vision and Image Recognition Technology Market Size (Value - US$ Bn), Analysis, and Forecasts, 2021-2035
- 17.3.1. Component
- 17.3.2. Deployment Mode
- 17.3.3. Technology
- 17.3.4. Functionality
- 17.3.5. Integration
- 17.3.6. Organization Size
- 17.3.7. Application/ Use Case
- 17.3.8. Industry Vertical
- 17.3.9. Country
- 17.3.9.1. China
- 17.3.9.2. India
- 17.3.9.3. Japan
- 17.3.9.4. South Korea
- 17.3.9.5. Australia and New Zealand
- 17.3.9.6. Indonesia
- 17.3.9.7. Malaysia
- 17.3.9.8. Thailand
- 17.3.9.9. Vietnam
- 17.3.9.10. Rest of Asia Pacific
- 17.4. China Computer Vision and Image Recognition Technology Market
- 17.4.1. Country Segmental Analysis
- 17.4.2. Component
- 17.4.3. Deployment Mode
- 17.4.4. Technology
- 17.4.5. Functionality
- 17.4.6. Integration
- 17.4.7. Organization Size
- 17.4.8. Application/ Use Case
- 17.4.9. Industry Vertical
- 17.5. India Computer Vision and Image Recognition Technology Market
- 17.5.1. Country Segmental Analysis
- 17.5.2. Component
- 17.5.3. Deployment Mode
- 17.5.4. Technology
- 17.5.5. Functionality
- 17.5.6. Integration
- 17.5.7. Organization Size
- 17.5.8. Application/ Use Case
- 17.5.9. Industry Vertical
- 17.6. Japan Computer Vision and Image Recognition Technology Market
- 17.6.1. Country Segmental Analysis
- 17.6.2. Component
- 17.6.3. Deployment Mode
- 17.6.4. Technology
- 17.6.5. Functionality
- 17.6.6. Integration
- 17.6.7. Organization Size
- 17.6.8. Application/ Use Case
- 17.6.9. Industry Vertical
- 17.7. South Korea Computer Vision and Image Recognition Technology Market
- 17.7.1. Country Segmental Analysis
- 17.7.2. Component
- 17.7.3. Deployment Mode
- 17.7.4. Technology
- 17.7.5. Functionality
- 17.7.6. Integration
- 17.7.7. Organization Size
- 17.7.8. Application/ Use Case
- 17.7.9. Industry Vertical
- 17.8. Australia and New Zealand Computer Vision and Image Recognition Technology Market
- 17.8.1. Country Segmental Analysis
- 17.8.2. Component
- 17.8.3. Deployment Mode
- 17.8.4. Technology
- 17.8.5. Functionality
- 17.8.6. Integration
- 17.8.7. Organization Size
- 17.8.8. Application/ Use Case
- 17.8.9. Industry Vertical
- 17.9. Indonesia Computer Vision and Image Recognition Technology Market
- 17.9.1. Country Segmental Analysis
- 17.9.2. Component
- 17.9.3. Deployment Mode
- 17.9.4. Technology
- 17.9.5. Functionality
- 17.9.6. Integration
- 17.9.7. Organization Size
- 17.9.8. Application/ Use Case
- 17.9.9. Industry Vertical
- 17.10. Malaysia Computer Vision and Image Recognition Technology Market
- 17.10.1. Country Segmental Analysis
- 17.10.2. Component
- 17.10.3. Deployment Mode
- 17.10.4. Technology
- 17.10.5. Functionality
- 17.10.6. Integration
- 17.10.7. Organization Size
- 17.10.8. Application/ Use Case
- 17.10.9. Industry Vertical
- 17.11. Thailand Computer Vision and Image Recognition Technology Market
- 17.11.1. Country Segmental Analysis
- 17.11.2. Component
- 17.11.3. Deployment Mode
- 17.11.4. Technology
- 17.11.5. Functionality
- 17.11.6. Integration
- 17.11.7. Organization Size
- 17.11.8. Application/ Use Case
- 17.11.9. Industry Vertical
- 17.12. Vietnam Computer Vision and Image Recognition Technology Market
- 17.12.1. Country Segmental Analysis
- 17.12.2. Component
- 17.12.3. Deployment Mode
- 17.12.4. Technology
- 17.12.5. Functionality
- 17.12.6. Integration
- 17.12.7. Organization Size
- 17.12.8. Application/ Use Case
- 17.12.9. Industry Vertical
- 17.13. Rest of Asia Pacific Computer Vision and Image Recognition Technology Market
- 17.13.1. Country Segmental Analysis
- 17.13.2. Component
- 17.13.3. Deployment Mode
- 17.13.4. Technology
- 17.13.5. Functionality
- 17.13.6. Integration
- 17.13.7. Organization Size
- 17.13.8. Application/ Use Case
- 17.13.9. Industry Vertical
- 18. Middle East Computer Vision and Image Recognition Technology Market Analysis
- 18.1. Key Segment Analysis
- 18.2. Regional Snapshot
- 18.3. Middle East Computer Vision and Image Recognition Technology Market Size (Value - US$ Bn), Analysis, and Forecasts, 2021-2035
- 18.3.1. Component
- 18.3.2. Deployment Mode
- 18.3.3. Technology
- 18.3.4. Functionality
- 18.3.5. Integration
- 18.3.6. Organization Size
- 18.3.7. Application/ Use Case
- 18.3.8. Industry Vertical
- 18.3.9. Country
- 18.3.9.1. Turkey
- 18.3.9.2. UAE
- 18.3.9.3. Saudi Arabia
- 18.3.9.4. Israel
- 18.3.9.5. Rest of Middle East
- 18.4. Turkey Computer Vision and Image Recognition Technology Market
- 18.4.1. Country Segmental Analysis
- 18.4.2. Component
- 18.4.3. Deployment Mode
- 18.4.4. Technology
- 18.4.5. Functionality
- 18.4.6. Integration
- 18.4.7. Organization Size
- 18.4.8. Application/ Use Case
- 18.4.9. Industry Vertical
- 18.5. UAE Computer Vision and Image Recognition Technology Market
- 18.5.1. Country Segmental Analysis
- 18.5.2. Component
- 18.5.3. Deployment Mode
- 18.5.4. Technology
- 18.5.5. Functionality
- 18.5.6. Integration
- 18.5.7. Organization Size
- 18.5.8. Application/ Use Case
- 18.5.9. Industry Vertical
- 18.6. Saudi Arabia Computer Vision and Image Recognition Technology Market
- 18.6.1. Country Segmental Analysis
- 18.6.2. Component
- 18.6.3. Deployment Mode
- 18.6.4. Technology
- 18.6.5. Functionality
- 18.6.6. Integration
- 18.6.7. Organization Size
- 18.6.8. Application/ Use Case
- 18.6.9. Industry Vertical
- 18.7. Israel Computer Vision and Image Recognition Technology Market
- 18.7.1. Country Segmental Analysis
- 18.7.2. Component
- 18.7.3. Deployment Mode
- 18.7.4. Technology
- 18.7.5. Functionality
- 18.7.6. Integration
- 18.7.7. Organization Size
- 18.7.8. Application/ Use Case
- 18.7.9. Industry Vertical
- 18.8. Rest of Middle East Computer Vision and Image Recognition Technology Market
- 18.8.1. Country Segmental Analysis
- 18.8.2. Component
- 18.8.3. Deployment Mode
- 18.8.4. Technology
- 18.8.5. Functionality
- 18.8.6. Integration
- 18.8.7. Organization Size
- 18.8.8. Application/ Use Case
- 18.8.9. Industry Vertical
- 19. Africa Computer Vision and Image Recognition Technology Market Analysis
- 19.1. Key Segment Analysis
- 19.2. Regional Snapshot
- 19.3. Africa Computer Vision and Image Recognition Technology Market Size (Value - US$ Bn), Analysis, and Forecasts, 2021-2035
- 19.3.1. Component
- 19.3.2. Deployment Mode
- 19.3.3. Technology
- 19.3.4. Functionality
- 19.3.5. Integration
- 19.3.6. Organization Size
- 19.3.7. Application/ Use Case
- 19.3.8. Industry Vertical
- 19.3.9. Country
- 19.3.9.1. South Africa
- 19.3.9.2. Egypt
- 19.3.9.3. Nigeria
- 19.3.9.4. Algeria
- 19.3.9.5. Rest of Africa
- 19.4. South Africa Computer Vision and Image Recognition Technology Market
- 19.4.1. Country Segmental Analysis
- 19.4.2. Component
- 19.4.3. Deployment Mode
- 19.4.4. Technology
- 19.4.5. Functionality
- 19.4.6. Integration
- 19.4.7. Organization Size
- 19.4.8. Application/ Use Case
- 19.4.9. Industry Vertical
- 19.5. Egypt Computer Vision and Image Recognition Technology Market
- 19.5.1. Country Segmental Analysis
- 19.5.2. Component
- 19.5.3. Deployment Mode
- 19.5.4. Technology
- 19.5.5. Functionality
- 19.5.6. Integration
- 19.5.7. Organization Size
- 19.5.8. Application/ Use Case
- 19.5.9. Industry Vertical
- 19.6. Nigeria Computer Vision and Image Recognition Technology Market
- 19.6.1. Country Segmental Analysis
- 19.6.2. Component
- 19.6.3. Deployment Mode
- 19.6.4. Technology
- 19.6.5. Functionality
- 19.6.6. Integration
- 19.6.7. Organization Size
- 19.6.8. Application/ Use Case
- 19.6.9. Industry Vertical
- 19.7. Algeria Computer Vision and Image Recognition Technology Market
- 19.7.1. Country Segmental Analysis
- 19.7.2. Component
- 19.7.3. Deployment Mode
- 19.7.4. Technology
- 19.7.5. Functionality
- 19.7.6. Integration
- 19.7.7. Organization Size
- 19.7.8. Application/ Use Case
- 19.7.9. Industry Vertical
- 19.8. Rest of Africa Computer Vision and Image Recognition Technology Market
- 19.8.1. Country Segmental Analysis
- 19.8.2. Component
- 19.8.3. Deployment Mode
- 19.8.4. Technology
- 19.8.5. Functionality
- 19.8.6. Integration
- 19.8.7. Organization Size
- 19.8.8. Application/ Use Case
- 19.8.9. Industry Vertical
- 20. South America Computer Vision and Image Recognition Technology Market Analysis
- 20.1. Key Segment Analysis
- 20.2. Regional Snapshot
- 20.3. South America Computer Vision and Image Recognition Technology Market Size (Value - US$ Bn), Analysis, and Forecasts, 2021-2035
- 20.3.1. Component
- 20.3.2. Deployment Mode
- 20.3.3. Technology
- 20.3.4. Functionality
- 20.3.5. Integration
- 20.3.6. Organization Size
- 20.3.7. Application/ Use Case
- 20.3.8. Industry Vertical
- 20.3.9. Country
- 20.3.9.1. Brazil
- 20.3.9.2. Argentina
- 20.3.9.3. Rest of South America
- 20.4. Brazil Computer Vision and Image Recognition Technology Market
- 20.4.1. Country Segmental Analysis
- 20.4.2. Component
- 20.4.3. Deployment Mode
- 20.4.4. Technology
- 20.4.5. Functionality
- 20.4.6. Integration
- 20.4.7. Organization Size
- 20.4.8. Application/ Use Case
- 20.4.9. Industry Vertical
- 20.5. Argentina Computer Vision and Image Recognition Technology Market
- 20.5.1. Country Segmental Analysis
- 20.5.2. Component
- 20.5.3. Deployment Mode
- 20.5.4. Technology
- 20.5.5. Functionality
- 20.5.6. Integration
- 20.5.7. Organization Size
- 20.5.8. Application/ Use Case
- 20.5.9. Industry Vertical
- 20.6. Rest of South America Computer Vision and Image Recognition Technology Market
- 20.6.1. Country Segmental Analysis
- 20.6.2. Component
- 20.6.3. Deployment Mode
- 20.6.4. Technology
- 20.6.5. Functionality
- 20.6.6. Integration
- 20.6.7. Organization Size
- 20.6.8. Application/ Use Case
- 20.6.9. Industry Vertical
- 21. Key Players/ Company Profile
- 21.1. Amazon Web Services
- 21.1.1. Company Details/ Overview
- 21.1.2. Company Financials
- 21.1.3. Key Customers and Competitors
- 21.1.4. Business/ Industry Portfolio
- 21.1.5. Product Portfolio/ Specification Details
- 21.1.6. Pricing Data
- 21.1.7. Strategic Overview
- 21.1.8. Recent Developments
- 21.2. Axis Communications
- 21.3. Basler
- 21.4. Bosch
- 21.5. Canon
- 21.6. Cognex
- 21.7. Dahua Technology
- 21.8. Google
- 21.9. Hikvision
- 21.10. IBM Corporation
- 21.11. Intel Corporation
- 21.12. Keyence
- 21.13. Megvii
- 21.14. Microsoft
- 21.15. NVIDIA Corporation
- 21.16. OpenCV
- 21.17. Qualcomm
- 21.18. SenseTime
- 21.19. Sony Corporation
- 21.20. Teledyne FLIR
- 21.21. Other Key Players
- 21.1. Amazon Web Services
Note* - This is just tentative list of players. While providing the report, we will cover more number of players based on their revenue and share for each geography
Research Design
Our research design integrates both demand-side and supply-side analysis through a balanced combination of primary and secondary research methodologies. By utilizing both bottom-up and top-down approaches alongside rigorous data triangulation methods, we deliver robust market intelligence that supports strategic decision-making.
MarketGenics' comprehensive research design framework ensures the delivery of accurate, reliable, and actionable market intelligence. Through the integration of multiple research approaches, rigorous validation processes, and expert analysis, we provide our clients with the insights needed to make informed strategic decisions and capitalize on market opportunities.

MarketGenics leverages a dedicated industry panel of experts and a comprehensive suite of paid databases to effectively collect, consolidate, and analyze market intelligence.
Our approach has consistently proven to be reliable and effective in generating accurate market insights, identifying key industry trends, and uncovering emerging business opportunities.
Through both primary and secondary research, we capture and analyze critical company-level data such as manufacturing footprints, including technical centers, R&D facilities, sales offices, and headquarters.
Our expert panel further enhances our ability to estimate market size for specific brands based on validated field-level intelligence.
Our data mining techniques incorporate both parametric and non-parametric methods, allowing for structured data collection, sorting, processing, and cleaning.
Demand projections are derived from large-scale data sets analyzed through proprietary algorithms, culminating in robust and reliable market sizing.
Research Approach
The bottom-up approach builds market estimates by starting with the smallest addressable market units and systematically aggregating them to create comprehensive market size projections.
This method begins with specific, granular data points and builds upward to create the complete market landscape.
Customer Analysis → Segmental Analysis → Geographical Analysis
The top-down approach starts with the broadest possible market data and systematically narrows it down through a series of filters and assumptions to arrive at specific market segments or opportunities.
This method begins with the big picture and works downward to increasingly specific market slices.
TAM → SAM → SOM


Research Methods
Desk / Secondary Research
While analysing the market, we extensively study secondary sources, directories, and databases to identify and collect information useful for this technical, market-oriented, and commercial report. Secondary sources that we utilize are not only the public sources, but it is a combination of Open Source, Associations, Paid Databases, MG Repository & Knowledgebase, and others.
- Company websites, annual reports, financial reports, broker reports, and investor presentations
- National government documents, statistical databases and reports
- News articles, press releases and web-casts specific to the companies operating in the market, Magazines, reports, and others
- We gather information from commercial data sources for deriving company specific data such as segmental revenue, share for geography, product revenue, and others
- Internal and external proprietary databases (industry-specific), relevant patent, and regulatory databases
- Governing Bodies, Government Organizations
- Relevant Authorities, Country-specific Associations for Industries
We also employ the model mapping approach to estimate the product level market data through the players' product portfolio
Primary Research
Primary research/ interviews is vital in analyzing the market. Most of the cases involves paid primary interviews. Primary sources include primary interviews through e-mail interactions, telephonic interviews, surveys as well as face-to-face interviews with the different stakeholders across the value chain including several industry experts.
| Type of Respondents | Number of Primaries |
|---|---|
| Tier 2/3 Suppliers | ~20 |
| Tier 1 Suppliers | ~25 |
| End-users | ~25 |
| Industry Expert/ Panel/ Consultant | ~30 |
| Total | ~100 |
MG Knowledgebase
• Repository of industry blog, newsletter and case studies
• Online platform covering detailed market reports, and company profiles
Forecasting Factors and Models
Forecasting Factors
- Historical Trends – Past market patterns, cycles, and major events that shaped how markets behave over time. Understanding past trends helps predict future behavior.
- Industry Factors – Specific characteristics of the industry like structure, regulations, and innovation cycles that affect market dynamics.
- Macroeconomic Factors – Economic conditions like GDP growth, inflation, and employment rates that affect how much money people have to spend.
- Demographic Factors – Population characteristics like age, income, and location that determine who can buy your product.
- Technology Factors – How quickly people adopt new technology and how much technology infrastructure exists.
- Regulatory Factors – Government rules, laws, and policies that can help or restrict market growth.
- Competitive Factors – Analyzing competition structure such as degree of competition and bargaining power of buyers and suppliers.
Forecasting Models / Techniques
Multiple Regression Analysis
- Identify and quantify factors that drive market changes
- Statistical modeling to establish relationships between market drivers and outcomes
Time Series Analysis – Seasonal Patterns
- Understand regular cyclical patterns in market demand
- Advanced statistical techniques to separate trend, seasonal, and irregular components
Time Series Analysis – Trend Analysis
- Identify underlying market growth patterns and momentum
- Statistical analysis of historical data to project future trends
Expert Opinion – Expert Interviews
- Gather deep industry insights and contextual understanding
- In-depth interviews with key industry stakeholders
Multi-Scenario Development
- Prepare for uncertainty by modeling different possible futures
- Creating optimistic, pessimistic, and most likely scenarios
Time Series Analysis – Moving Averages
- Sophisticated forecasting for complex time series data
- Auto-regressive integrated moving average models with seasonal components
Econometric Models
- Apply economic theory to market forecasting
- Sophisticated economic models that account for market interactions
Expert Opinion – Delphi Method
- Harness collective wisdom of industry experts
- Structured, multi-round expert consultation process
Monte Carlo Simulation
- Quantify uncertainty and probability distributions
- Thousands of simulations with varying input parameters
Research Analysis
Our research framework is built upon the fundamental principle of validating market intelligence from both demand and supply perspectives. This dual-sided approach ensures comprehensive market understanding and reduces the risk of single-source bias.
Demand-Side Analysis: We understand end-user/application behavior, preferences, and market needs along with the penetration of the product for specific application.
Supply-Side Analysis: We estimate overall market revenue, analyze the segmental share along with industry capacity, competitive landscape, and market structure.
Validation & Evaluation
Data triangulation is a validation technique that uses multiple methods, sources, or perspectives to examine the same research question, thereby increasing the credibility and reliability of research findings. In market research, triangulation serves as a quality assurance mechanism that helps identify and minimize bias, validate assumptions, and ensure accuracy in market estimates.
- Data Source Triangulation – Using multiple data sources to examine the same phenomenon
- Methodological Triangulation – Using multiple research methods to study the same research question
- Investigator Triangulation – Using multiple researchers or analysts to examine the same data
- Theoretical Triangulation – Using multiple theoretical perspectives to interpret the same data

Custom Market Research Services
We will customise the research for you, in case the report listed above does not meet your requirements.
Get 10% Free Customisation