Data Center Accelerators Market Size, Share & Trends Analysis Report by Accelerator Type (Graphics Processing Units, Field-Programmable Gate Arrays, Application-Specific Integrated Circuits, Tensor Processing Units, Data Processing Units, Intelligence Processing Units, Others), Processor Architecture, Rated Power Consumption, Memory Capacity, Computing Performance (TFLOPS), Interconnect Technology, Cooling Technology, Deployment Model, End-use, and Geography (North America, Europe, Asia Pacific, Middle East, Africa, and South America) – Global Industry Data, Trends, and Forecasts, 2026–2035
|
|
|
Segmental Data Insights |
|
|
Demand Trends |
|
|
Competitive Landscape |
|
|
Strategic Development |
|
|
Future Outlook & Opportunities |
|
Data Center Accelerators Market Size, Share, and Growth
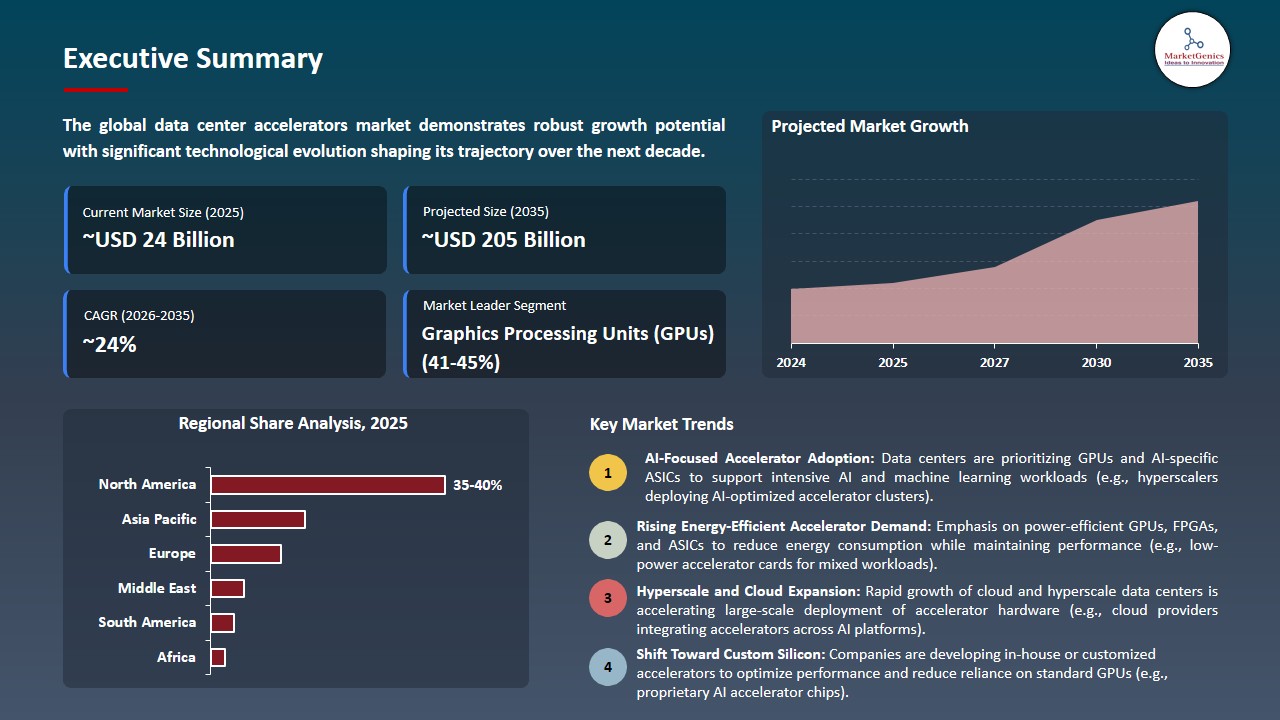
The global data center accelerators market is experiencing robust growth, with its estimated value of USD 23.7 billion in the year 2025 and USD 205.3 billion by 2035, registering a CAGR of 24.1%, during the forecast period. The global data center accelerators market, driven by the rising need for faster data processing, AI and machine learning workloads, cloud computing expansion, and energy-efficient high-performance computing, enabling improved server performance and reduced operational costs.
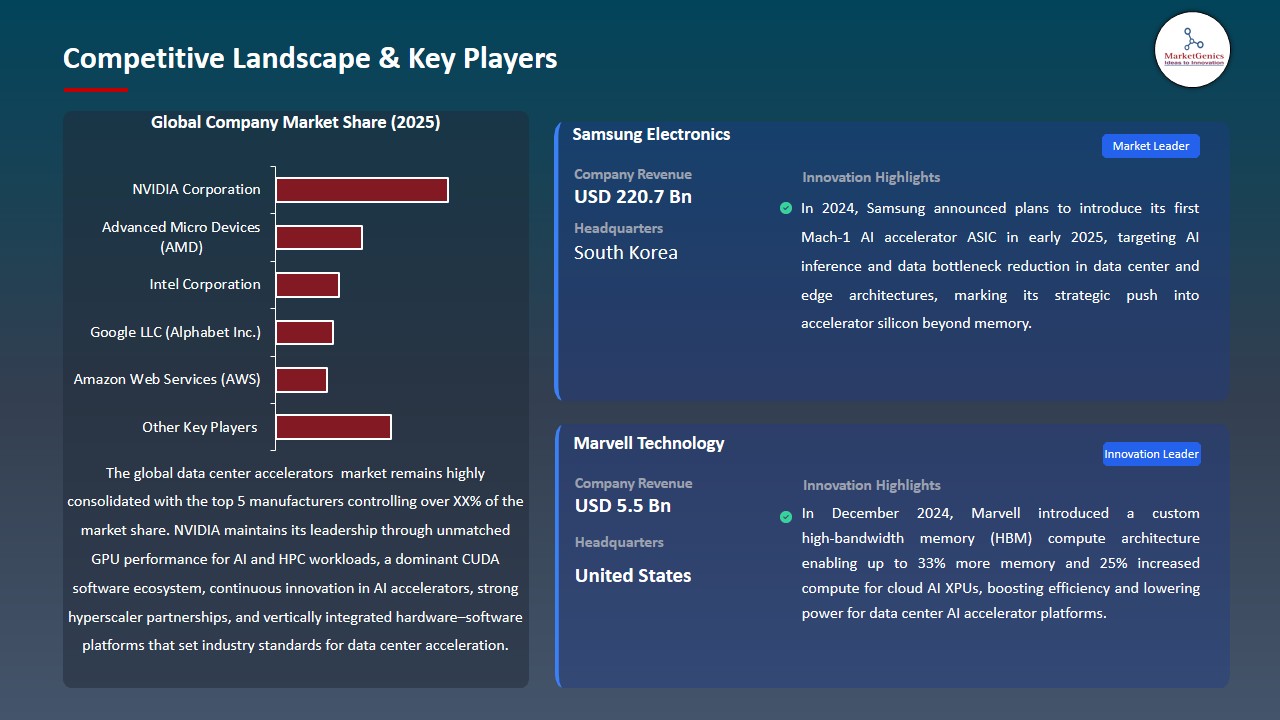
"The leading cloud data center operators have scaled with custom infrastructure. Enhancing XPUs by tailoring HBM for specific performance, power, and total cost of ownership is the latest step in a new paradigm in the way AI accelerators are designed and delivered," said Will Chu, Senior Vice President and General Manager of the Custom, Compute and Storage Group at Marvell.
This surge in generative AI application by business and hyperscalers is leading to significant investment in solutions in more complex data center accelerators market to handle compute-intensive model training and inference and an increase in the demand for high performance, energy-efficient solutions. For instance, in May 2024, NVIDIA started volume shipments of its B200 GPUs based on Blackwell, which offered multi-fold performance and energy efficiency benefits in cloud data centers with regard to AI. This force is increasing the intensity of capex and driving up the market to high-performance, GPU-based and AI-optimized accelerator architecture.
Additionally, cloud service providers are moving towards the creation of proprietary architectures in the market to enhance the cost and performance and decrease reliance on off-the-shelf solutions based on the GPUs in the data center accelerators. For instance, in 2024, Amazon Web Services introduced Trainium2, which provides much higher training throughput and reduced cost per model on large-scale AI workloads. This trend is expanding the competitive environment and by implication increasing the growth in demand of both merchant and in-house data center accelerators in a sustainable manner in the global market.
Key adjacent opportunities in the global data center accelerators market include AI hardware platforms, high-performance computing (HPC) systems, cloud gaming infrastructure, edge computing devices, and quantum computing integration. The expansions in these neighboring markets lead to growth in such areas leading to the demand and innovation of accelerator solutions globally.
Data Center Accelerators Market Dynamics and Trends
Driver: Accelerating Adoption of Heterogeneous Compute Architectures for Complex AI Workloads
-
Data centers are moving towards having heterogeneous compute, inclusive of GPUs, FPGAs and ASICs, to address the ever-growing demands of more complex artificial intelligence (AI) and high-performance computing (HPC) workloads. As opposed to the usual CPU-centric systems, heterogeneous systems distribute duties to the most appropriate accelerator kind, enhancing their execution, diminishing their latency, and enhancing their energy effectiveness in massive training and inference.
- In December 2024, NVIDIA unveiled its Grace Hopper Superchip at the Supercomputing Conference, an ARM-based CPU with Hopper GPUs in a single coherent architecture specifically trained on AI and HPC workloads. Similarly, the adoption of these systems by the industry is high with several hyperscale cloud providers promising to incorporate them into their upgraded infrastructure in 2025.
- By enabling parallel processing across specialized hardware, organizations can accelerate model development, optimize resource utilization, and support real-time analytics at scale.
- Adoption of heterogeneous compute architectures increases the processing throughput and cost efficiency and diversifies the accelerator market in cloud, enterprise, and research data centers.
Restraint: Escalating Operational Complexity and Skill Shortages Hampering Deployment
-
The emergence of accelerators in data centres is posing massive operational problems to organizations due to the fast-changing nature of the technologies. The accelerators, such as GPUs, FPGAs, and ASICs, cannot be used effectively without sophisticated orchestration, integration, and even maintenance, to work in a heterogeneous computing environment. The requirements of both high technical skill and compatibility with legacy systems are necessary to ensure maximum performance.
- Several companies have a hard time finding candidates who have the specialized engineering skills required to run and optimize these deployments. The resulting impact of these skills gap may include extended deployment times, inefficiency in resource utilization, and high costs of operation especially in the balancing of workloads among various types of accelerators.
- Additionally, the control of firmware updates, system interoperability and workload scheduling on complex accelerator architectures presents additional technical complexity.
- Persistent talent shortages and intricate system management increase deployment risk and costs, constraining near-term growth of the global data center accelerators market and slowing broader industry adoption.
Opportunity: Expansion of Custom ASIC Development for Specialized Data Center Functions
-
The increasing need of highly efficient, workload-specific compute solutions is spurring the spread of custom application-specific integrated circuits (ASICs) into data center environments. These dedicated ASICs are designed to perform specific functions such as AI inference, encryption, networking and real-time analytics, unlike general-purpose GPUs, they provide superior performance per watt and lower operational latency.
- In October 2025, Qualcomm announced its AI300 lineup of AI inference accelerators, designed to be used in hyperscale data centers with large transformer models. The AI300 series promises a higher bandwidth memory, inbuilt security, and power efficiency which effectively response to the current increasing demand of the high-performance computing infrastructure which is workload-optimized.
- Deployment of custom ASICs enables enterprises and cloud service providers to lower total cost of ownership, reduce energy consumption, and accelerate AI workloads without relying exclusively on general-purpose GPU platforms.
- The growing popularity of specialized ASIC solutions is broadening the data center accelerator market, enhancing differentiated product provision and customized and efficient high-performance computing.
Key Trend: Trend Toward Energy‑Efficient, Scalable Accelerator Architectures in Data Centers
-
Scalable accelerators providing high computing performance and focusing on sustainability objectives are becoming more of a priority in the data center industry. The increased power usage and cooling needs of large-scale AI jobs have led operators to find solutions to achieve the highest possible throughput per watt without reducing the performance.
- The major manufacturing companies are also coming up with innovative designs of architecture and interconnects that maximize the energy efficiency of data centers and allow data centers to scale the compute resources but at minimal cost of operation and environmental impact. For instance, in 2025, Intel’s Crescent Island AI chip, slated for release in 2026, which emphasizes modularity, energy efficiency, and scalable deployment to support diverse AI workloads. This architecture is aimed to fight with the established players by maintaining the balance between high performance and low consumption of energy.
- These energy-centric designs can also allow operators to effectively control the total cost of ownership through increased operational efficiency as well as reduced power consumption, and sustainability goals.
- The scalable accelerator designs which are energy efficient are influencing purchasing behavior and driving the next-generation solutions into hyperscale, enterprise, and research data centres.
Data-Center-Accelerators-Market Analysis and Segmental Data
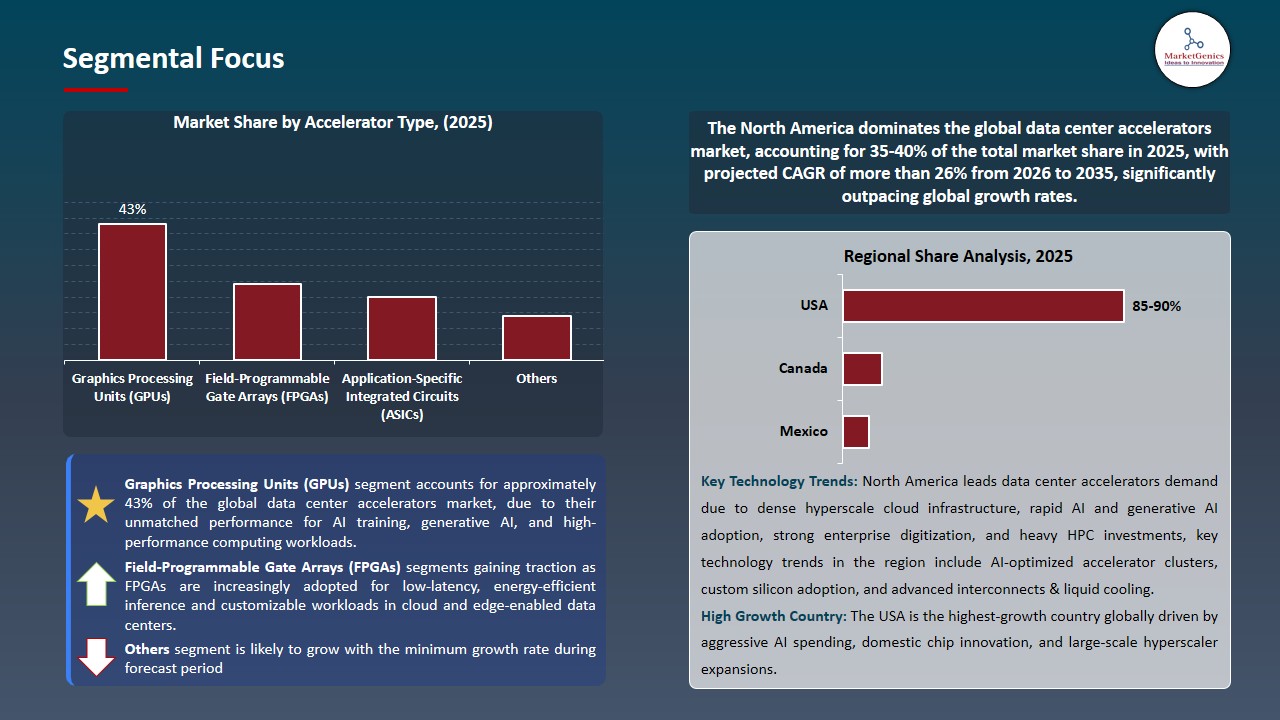
Graphics Processing Units (GPUs) Dominate Global Data Center Accelerators Market
-
The data center accelerators market continues to be dominated by graphics processing units (GPUs), due to their outstanding parallel computing power, strong software ecosystem, and scalability to workloads of AI and machine learning. The features make GPUs faster than other accelerators, including FPGAs and ASICs, when it comes to running complex deep learning training and inference operations.
- Furthermore, the increasing use of AI-oriented infrastructure by hyperscale cloud-service providers and enterprises has only deepened the grip of the GPUs since more and more organizations are investing in high-performance computing and generative AI applications to improve their operational effectiveness and enable more sophisticated calculations.
- For instance, in November 2025, GMI Cloud announced a 500 million AI data center in Taiwan, based on some 7,000 Nvidia Blackwell GPUs, capable of processing millions of tokens per second and supporting high-level AI workloads underlining real-world implementation of GPU-based high-performance accelerators.
- The GPUs have become the foundation of the contemporary AI-based data centers, enabling the accelerated training and inference of large models directly and triggering capital investment and competitive divergence across the cloud ecosystem.
North America Leads Global Data Center Accelerators Market Demand
-
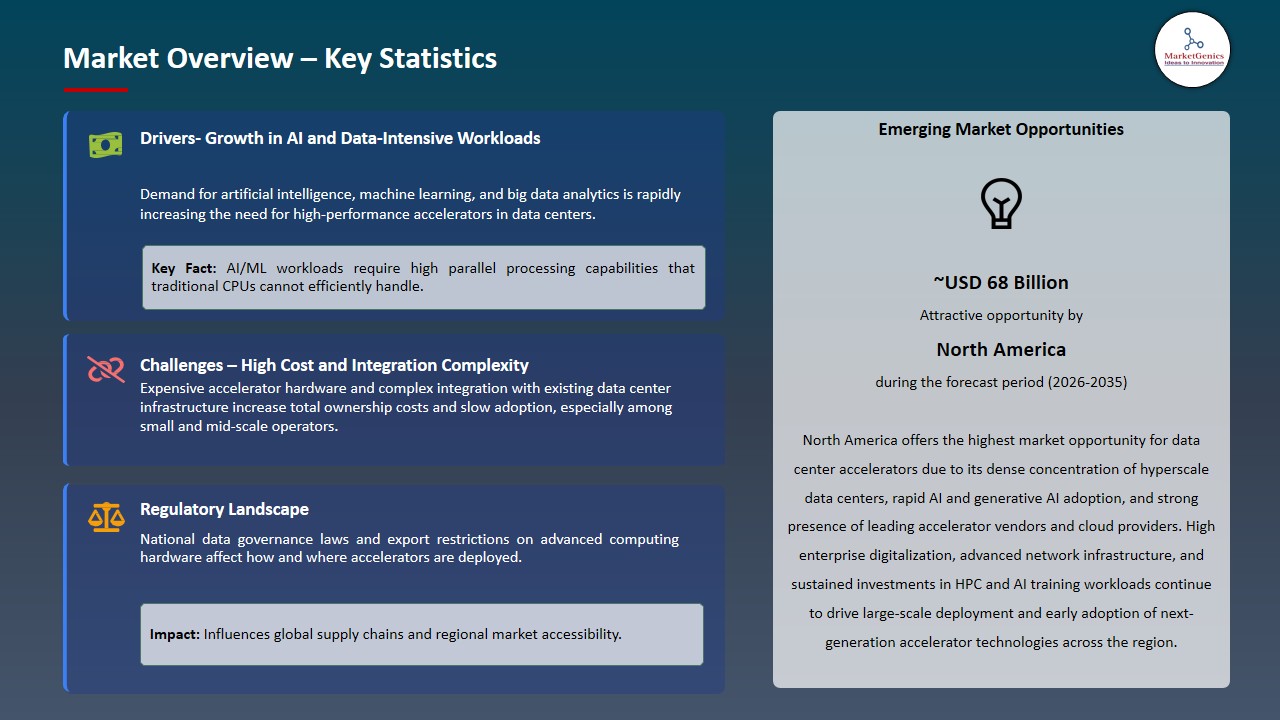
North America leads the data center accelerators market, due to the investments in AI infrastructure are high, and the hyperscale ecosystem is well-developed, and the use of GPU-accelerated computing is a long-term demand both in the enterprise and cloud setting.
- For instance, the major hyperscalers in North America like AWS, Microsoft Azure, and Google Cloud kept growing the number of accelerators to drive generative AI services and real-time analytics, which bolstered regional needs of high-performance computing infrastructure. This growth has made North America a leading location in the world where high-performance AI computing can be done and has fuelled innovation and widespread use of accelerator technologies.
- Additionally, North America has world-leading manufacturers of accelerators and AI research institutions, which increases the market demand, as the supply and innovation ecosystems encourage accelerator technology adoption. The proximity to chip designers and software developers accelerates the integration of next-generation architectures into data centers and enterprise systems.
- For instance, in 2025, AI startup Lambda secured $1.5 billion to expand GPU‑based data centers, highlighting strong investor confidence and robust demand in North America’s AI accelerator market. This financing indicates the increasing presence of North America in AI acceleration and the enhancement of the pace of high-performance GPU infrastructure adoption.
Data-Center-Accelerators-Market Ecosystem
The global data center accelerators market is highly consolidated, with high concentration among key players such as NVIDIA Corporation, Advanced Micro Devices (AMD), Intel Corporation, Google LLC (Alphabet Inc.), and Amazon Web Services (AWS), who dominate through advanced GPU architectures, effective software ecosystems, strategic alliances, and extensive cloud deployments, consolidating the control over the market and dominating the technological market. This consolidation leads to standardization in the technology, a rise in competition to be innovative, and system strengthening of the market of a handful of dominant players in the current trends of global data center accelerators.
Recent Development and Strategic Overview:
-
In October 2025, Cisco launched the P200 networking chip to enable long-distance connectivity between AI data centers. By consolidating the functionality of multiple chips, the solution reduces power consumption by approximately 65%, supporting efficient synchronization of accelerator clusters across global AI infrastructures.
- In May 2025, Marvell Technology introduced an innovative multi-die packaging platform specifically designed for custom AI accelerator chips. The solution enhances computational performance while reducing costs, supporting the deployment of larger multi-die accelerator architectures within cloud and AI data center infrastructures. Production has commenced to meet market demand.
Report Scope
|
Detail |
|
|
Market Size in 2025 |
USD 23.7 Bn |
|
Market Forecast Value in 2035 |
USD 205.3 Bn |
|
Growth Rate (CAGR) |
24.1% |
|
Forecast Period |
2026 – 2035 |
|
Historical Data Available for |
2021 – 2024 |
|
Market Size Units |
US$ Billion for Value |
|
Report Format |
Electronic (PDF) + Excel |
|
North America |
Europe |
Asia Pacific |
Middle East |
Africa |
South America |
|
|
|
|
|
|
|
Companies Covered |
|||||
|
|
|
|
|
|
Data-Center-Accelerators-Market Segmentation and Highlights
|
Segment |
Sub-segment |
|
Data Center Accelerators Market, By Accelerator Type |
|
|
Data Center Accelerators Market, By Processor Architecture |
|
|
Data Center Accelerators Market, By Rated Power Consumption |
|
|
Data Center Accelerators Market, By Memory Capacity |
|
|
Data Center Accelerators Market, By Computing Performance (TFLOPS)
|
|
|
Data Center Accelerators Market, By Interconnect Technology
|
|
|
Data Center Accelerators Market, By Cooling Technology |
|
|
Data Center Accelerators Market, By Deployment Model |
|
|
Data Center Accelerators Market, By End-use |
|
Frequently Asked Questions
Table of Contents
- 1. Research Methodology and Assumptions
- 1.1. Definitions
- 1.2. Research Design and Approach
- 1.3. Data Collection Methods
- 1.4. Base Estimates and Calculations
- 1.5. Forecasting Models
- 1.5.1. Key Forecast Factors & Impact Analysis
- 1.6. Secondary Research
- 1.6.1. Open Sources
- 1.6.2. Paid Databases
- 1.6.3. Associations
- 1.7. Primary Research
- 1.7.1. Primary Sources
- 1.7.2. Primary Interviews with Stakeholders across Ecosystem
- 2. Executive Summary
- 2.1. Global Data Center Accelerators Market Outlook
- 2.1.1. Data Center Accelerators Market Size (Value - US$ Bn), and Forecasts, 2021-2035
- 2.1.2. Compounded Annual Growth Rate Analysis
- 2.1.3. Growth Opportunity Analysis
- 2.1.4. Segmental Share Analysis
- 2.1.5. Geographical Share Analysis
- 2.2. Market Analysis and Facts
- 2.3. Supply-Demand Analysis
- 2.4. Competitive Benchmarking
- 2.5. Go-to- Market Strategy
- 2.5.1. Customer/ End-use Industry Assessment
- 2.5.2. Growth Opportunity Data, 2026-2035
- 2.5.2.1. Regional Data
- 2.5.2.2. Country Data
- 2.5.2.3. Segmental Data
- 2.5.3. Identification of Potential Market Spaces
- 2.5.4. GAP Analysis
- 2.5.5. Potential Attractive Price Points
- 2.5.6. Prevailing Market Risks & Challenges
- 2.5.7. Preferred Sales & Marketing Strategies
- 2.5.8. Key Recommendations and Analysis
- 2.5.9. A Way Forward
- 2.1. Global Data Center Accelerators Market Outlook
- 3. Industry Data and Premium Insights
- 3.1. Global Semiconductors & Electronics Industry Overview, 2025
- 3.1.1. Semiconductors & Electronics Ecosystem Analysis
- 3.1.2. Key Trends for Semiconductors & Electronics Industry
- 3.1.3. Regional Distribution for Semiconductors & Electronics Industry
- 3.2. Supplier Customer Data
- 3.3. Technology Roadmap and Developments
- 3.4. Trade Analysis
- 3.4.1. Import & Export Analysis, 2025
- 3.4.2. Top Importing Countries
- 3.4.3. Top Exporting Countries
- 3.5. Trump Tariff Impact Analysis
- 3.5.1. Manufacturer
- 3.5.1.1. Based on the component & Raw material
- 3.5.2. Supply Chain
- 3.5.3. End Consumer
- 3.5.1. Manufacturer
- 3.6. Raw Material Analysis
- 3.1. Global Semiconductors & Electronics Industry Overview, 2025
- 4. Market Overview
- 4.1. Market Dynamics
- 4.1.1. Drivers
- 4.1.1.1. Rapid adoption of AI, machine learning, and deep learning workloads
- 4.1.1.2. Rising demand for high-performance computing and data-intensive applications
- 4.1.1.3. Expansion of hyperscale and cloud data center infrastructure
- 4.1.2. Restraints
- 4.1.2.1. High initial investment and total cost of ownership
- 4.1.2.2. Integration complexity and shortage of skilled professionals
- 4.1.1. Drivers
- 4.2. Key Trend Analysis
- 4.3. Regulatory Framework
- 4.3.1. Key Regulations, Norms, and Subsidies, by Key Countries
- 4.3.2. Tariffs and Standards
- 4.3.3. Impact Analysis of Regulations on the Market
- 4.4. Value Chain Analysis
- 4.4.1. Raw Material & Component Suppliers
- 4.4.2. Accelerator Chip Manufacturers
- 4.4.3. Cloud Service Providers & Hyperscale Data Centers
- 4.4.4. End Users
- 4.5. Porter’s Five Forces Analysis
- 4.6. PESTEL Analysis
- 4.7. Global Data Center Accelerators Market Demand
- 4.7.1. Historical Market Size – Value (US$ Bn), 2020-2024
- 4.7.2. Current and Future Market Size – Value (US$ Bn), 2026–2035
- 4.7.2.1. Y-o-Y Growth Trends
- 4.7.2.2. Absolute $ Opportunity Assessment
- 4.1. Market Dynamics
- 5. Competition Landscape
- 5.1. Competition structure
- 5.1.1. Fragmented v/s consolidated
- 5.2. Company Share Analysis, 2025
- 5.2.1. Global Company Market Share
- 5.2.2. By Region
- 5.2.2.1. North America
- 5.2.2.2. Europe
- 5.2.2.3. Asia Pacific
- 5.2.2.4. Middle East
- 5.2.2.5. Africa
- 5.2.2.6. South America
- 5.3. Product Comparison Matrix
- 5.3.1. Specifications
- 5.3.2. Market Positioning
- 5.3.3. Pricing
- 5.1. Competition structure
- 6. Global Data Center Accelerators Market Analysis, by Accelerator Type
- 6.1. Key Segment Analysis
- 6.2. Data Center Accelerators Market Size (Value - US$ Bn), Analysis, and Forecasts, by Accelerator Type, 2021-2035
- 6.2.1. Graphics Processing Units (GPUs)
- 6.2.2. Field-Programmable Gate Arrays (FPGAs)
- 6.2.3. Application-Specific Integrated Circuits (ASICs)
- 6.2.4. Tensor Processing Units (TPUs)
- 6.2.5. Data Processing Units (DPUs)
- 6.2.6. Intelligence Processing Units (IPUs)
- 6.2.7. Others
- 7. Global Data Center Accelerators Market Analysis, by Processor Architecture
- 7.1. Key Segment Analysis
- 7.2. Data Center Accelerators Market Size (Value - US$ Bn), Analysis, and Forecasts, by Processor Architecture, 2021-2035
- 7.2.1. x86 Architecture
- 7.2.2. ARM Architecture
- 7.2.3. RISC-V Architecture
- 7.2.4. Hybrid Architecture
- 8. Global Data Center Accelerators Market Analysis, by Rated Power Consumption
- 8.1. Key Segment Analysis
- 8.2. Data Center Accelerators Market Size (Value - US$ Bn), Analysis, and Forecasts, by Rated Power Consumption, 2021-2035
- 8.2.1. Less than 75W
- 8.2.2. 75W to 150W
- 8.2.3. 150W to 300W
- 8.2.4. 300W to 500W
- 8.2.5. Above 500W
- 9. Global Data Center Accelerators Market Analysis, by Memory Capacity
- 9.1. Key Segment Analysis
- 9.2. Data Center Accelerators Market Size (Value - US$ Bn), Analysis, and Forecasts, by Memory Capacity, 2021-2035
- 9.2.1. Less than 16GB
- 9.2.2. 16GB to 32GB
- 9.2.3. 32GB to 64GB
- 9.2.4. Above 64GB
- 10. Global Data Center Accelerators Market Analysis, by Computing Performance (TFLOPS)
- 10.1. Key Segment Analysis
- 10.2. Data Center Accelerators Market Size (Value - US$ Bn), Analysis, and Forecasts, by Computing Performance (TFLOPS), 2021-2035
- 10.2.1. Up to 50 TFLOPS
- 10.2.2. 50-200 TFLOPS
- 10.2.3. 200-500 TFLOPS
- 10.2.4. Above 500 TFLOPS
- 11. Global Data Center Accelerators Market Analysis, by Interconnect Technology
- 11.1. Key Segment Analysis
- 11.2. Data Center Accelerators Market Size (Value - US$ Bn), Analysis, and Forecasts, by Interconnect Technology, 2021-2035
- 11.2.1. PCIe
- 11.2.2. NVLink
- 11.2.3. Infinity Fabric
- 11.2.4. CXL (Compute Express Link)
- 11.2.5. Others
- 12. Global Data Center Accelerators Market Analysis, by Cooling Technology
- 12.1. Key Segment Analysis
- 12.2. Data Center Accelerators Market Size (Value - US$ Bn), Analysis, and Forecasts, by Cooling Technology, 2021-2035
- 12.2.1. Air Cooling
- 12.2.2. Liquid Cooling
- 12.2.3. Immersion Cooling
- 12.2.4. Hybrid Cooling
- 13. Global Data Center Accelerators Market Analysis, by Deployment Model
- 13.1. Key Segment Analysis
- 13.2. Data Center Accelerators Market Size (Value - US$ Bn), Analysis, and Forecasts, by Deployment Model, 2021-2035
- 13.2.1. On-Premises Data Centers
- 13.2.2. Colocation Data Centers
- 13.2.3. Cloud Service Provider Data Centers
- 13.2.4. Edge Data Centers
- 13.2.5. Hyperscale Data Centers
- 14. Global Data Center Accelerators Market Analysis, by End-use
- 14.1. Key Segment Analysis
- 14.2. Data Center Accelerators Market Size (Value - US$ Bn), Analysis, and Forecasts, by End-use, 2021-2035
- 14.2.1. Cloud Service Providers
- 14.2.1.1. AI/ML Training
- 14.2.1.2. AI/ML Inference
- 14.2.1.3. High Performance Computing (HPC)
- 14.2.1.4. Big Data Analytics
- 14.2.1.5. Virtual Desktop Infrastructure (VDI)
- 14.2.1.6. Content Delivery
- 14.2.1.7. Others
- 14.2.2. Enterprise Data Centers
- 14.2.3. BFSI (Banking, Financial Services, and Insurance)
- 14.2.4. Telecommunications
- 14.2.5. Healthcare & Life Sciences
- 14.2.6. Manufacturing & Industrial
- 14.2.7. Retail & E-commerce
- 14.2.8. Automotive & Transportation
- 14.2.9. Government & Defense
- 14.2.10. Energy & Utilities
- 14.2.11. Other End-use
- 14.2.1. Cloud Service Providers
- 15. Global Data Center Accelerators Market Analysis and Forecasts, by Region
- 15.1. Key Findings
- 15.2. Data Center Accelerators Market Size (Value - US$ Bn), Analysis, and Forecasts, by Region, 2021-2035
- 15.2.1. North America
- 15.2.2. Europe
- 15.2.3. Asia Pacific
- 15.2.4. Middle East
- 15.2.5. Africa
- 15.2.6. South America
- 16. North America Data Center Accelerators Market Analysis
- 16.1. Key Segment Analysis
- 16.2. Regional Snapshot
- 16.3. North America Data Center Accelerators Market Size (Value - US$ Bn), Analysis, and Forecasts, 2021-2035
- 16.3.1. Accelerator Type
- 16.3.2. Processor Architecture
- 16.3.3. Rated Power Consumption
- 16.3.4. Memory Capacity
- 16.3.5. Computing Performance (TFLOPS)
- 16.3.6. Interconnect Technology
- 16.3.7. Cooling Technology
- 16.3.8. Deployment Model
- 16.3.9. End-use
- 16.3.10. Country
- 16.3.10.1. USA
- 16.3.10.2. Canada
- 16.3.10.3. Mexico
- 16.4. USA Data Center Accelerators Market
- 16.4.1. Country Segmental Analysis
- 16.4.2. Accelerator Type
- 16.4.3. Processor Architecture
- 16.4.4. Rated Power Consumption
- 16.4.5. Memory Capacity
- 16.4.6. Computing Performance (TFLOPS)
- 16.4.7. Interconnect Technology
- 16.4.8. Cooling Technology
- 16.4.9. Deployment Model
- 16.4.10. End-use
- 16.5. Canada Data Center Accelerators Market
- 16.5.1. Country Segmental Analysis
- 16.5.2. Accelerator Type
- 16.5.3. Processor Architecture
- 16.5.4. Rated Power Consumption
- 16.5.5. Memory Capacity
- 16.5.6. Computing Performance (TFLOPS)
- 16.5.7. Interconnect Technology
- 16.5.8. Cooling Technology
- 16.5.9. Deployment Model
- 16.5.10. End-use
- 16.6. Mexico Data Center Accelerators Market
- 16.6.1. Country Segmental Analysis
- 16.6.2. Accelerator Type
- 16.6.3. Processor Architecture
- 16.6.4. Rated Power Consumption
- 16.6.5. Memory Capacity
- 16.6.6. Computing Performance (TFLOPS)
- 16.6.7. Interconnect Technology
- 16.6.8. Cooling Technology
- 16.6.9. Deployment Model
- 16.6.10. End-use
- 17. Europe Data Center Accelerators Market Analysis
- 17.1. Key Segment Analysis
- 17.2. Regional Snapshot
- 17.3. Europe Data Center Accelerators Market Size (Value - US$ Bn), Analysis, and Forecasts, 2021-2035
- 17.3.1. Accelerator Type
- 17.3.2. Processor Architecture
- 17.3.3. Rated Power Consumption
- 17.3.4. Memory Capacity
- 17.3.5. Computing Performance (TFLOPS)
- 17.3.6. Interconnect Technology
- 17.3.7. Cooling Technology
- 17.3.8. Deployment Model
- 17.3.9. End-use
- 17.3.10. Country
- 17.3.10.1. Germany
- 17.3.10.2. United Kingdom
- 17.3.10.3. France
- 17.3.10.4. Italy
- 17.3.10.5. Spain
- 17.3.10.6. Netherlands
- 17.3.10.7. Nordic Countries
- 17.3.10.8. Poland
- 17.3.10.9. Russia & CIS
- 17.3.10.10. Rest of Europe
- 17.4. Germany Data Center Accelerators Market
- 17.4.1. Country Segmental Analysis
- 17.4.2. Accelerator Type
- 17.4.3. Processor Architecture
- 17.4.4. Rated Power Consumption
- 17.4.5. Memory Capacity
- 17.4.6. Computing Performance (TFLOPS)
- 17.4.7. Interconnect Technology
- 17.4.8. Cooling Technology
- 17.4.9. Deployment Model
- 17.4.10. End-use
- 17.5. United Kingdom Data Center Accelerators Market
- 17.5.1. Country Segmental Analysis
- 17.5.2. Accelerator Type
- 17.5.3. Processor Architecture
- 17.5.4. Rated Power Consumption
- 17.5.5. Memory Capacity
- 17.5.6. Computing Performance (TFLOPS)
- 17.5.7. Interconnect Technology
- 17.5.8. Cooling Technology
- 17.5.9. Deployment Model
- 17.5.10. End-use
- 17.6. France Data Center Accelerators Market
- 17.6.1. Country Segmental Analysis
- 17.6.2. Accelerator Type
- 17.6.3. Processor Architecture
- 17.6.4. Rated Power Consumption
- 17.6.5. Memory Capacity
- 17.6.6. Computing Performance (TFLOPS)
- 17.6.7. Interconnect Technology
- 17.6.8. Cooling Technology
- 17.6.9. Deployment Model
- 17.6.10. End-use
- 17.7. Italy Data Center Accelerators Market
- 17.7.1. Country Segmental Analysis
- 17.7.2. Accelerator Type
- 17.7.3. Processor Architecture
- 17.7.4. Rated Power Consumption
- 17.7.5. Memory Capacity
- 17.7.6. Computing Performance (TFLOPS)
- 17.7.7. Interconnect Technology
- 17.7.8. Cooling Technology
- 17.7.9. Deployment Model
- 17.7.10. End-use
- 17.8. Spain Data Center Accelerators Market
- 17.8.1. Country Segmental Analysis
- 17.8.2. Accelerator Type
- 17.8.3. Processor Architecture
- 17.8.4. Rated Power Consumption
- 17.8.5. Memory Capacity
- 17.8.6. Computing Performance (TFLOPS)
- 17.8.7. Interconnect Technology
- 17.8.8. Cooling Technology
- 17.8.9. Deployment Model
- 17.8.10. End-use
- 17.9. Netherlands Data Center Accelerators Market
- 17.9.1. Country Segmental Analysis
- 17.9.2. Accelerator Type
- 17.9.3. Processor Architecture
- 17.9.4. Rated Power Consumption
- 17.9.5. Memory Capacity
- 17.9.6. Computing Performance (TFLOPS)
- 17.9.7. Interconnect Technology
- 17.9.8. Cooling Technology
- 17.9.9. Deployment Model
- 17.9.10. End-use
- 17.10. Nordic Countries Data Center Accelerators Market
- 17.10.1. Country Segmental Analysis
- 17.10.2. Accelerator Type
- 17.10.3. Processor Architecture
- 17.10.4. Rated Power Consumption
- 17.10.5. Memory Capacity
- 17.10.6. Computing Performance (TFLOPS)
- 17.10.7. Interconnect Technology
- 17.10.8. Cooling Technology
- 17.10.9. Deployment Model
- 17.10.10. End-use
- 17.11. Poland Data Center Accelerators Market
- 17.11.1. Country Segmental Analysis
- 17.11.2. Accelerator Type
- 17.11.3. Processor Architecture
- 17.11.4. Rated Power Consumption
- 17.11.5. Memory Capacity
- 17.11.6. Computing Performance (TFLOPS)
- 17.11.7. Interconnect Technology
- 17.11.8. Cooling Technology
- 17.11.9. Deployment Model
- 17.11.10. End-use
- 17.12. Russia & CIS Data Center Accelerators Market
- 17.12.1. Country Segmental Analysis
- 17.12.2. Accelerator Type
- 17.12.3. Processor Architecture
- 17.12.4. Rated Power Consumption
- 17.12.5. Memory Capacity
- 17.12.6. Computing Performance (TFLOPS)
- 17.12.7. Interconnect Technology
- 17.12.8. Cooling Technology
- 17.12.9. Deployment Model
- 17.12.10. End-use
- 17.13. Rest of Europe Data Center Accelerators Market
- 17.13.1. Country Segmental Analysis
- 17.13.2. Accelerator Type
- 17.13.3. Processor Architecture
- 17.13.4. Rated Power Consumption
- 17.13.5. Memory Capacity
- 17.13.6. Computing Performance (TFLOPS)
- 17.13.7. Interconnect Technology
- 17.13.8. Cooling Technology
- 17.13.9. Deployment Model
- 17.13.10. End-use
- 18. Asia Pacific Data Center Accelerators Market Analysis
- 18.1. Key Segment Analysis
- 18.2. Regional Snapshot
- 18.3. Asia Pacific Data Center Accelerators Market Size (Value - US$ Bn), Analysis, and Forecasts, 2021-2035
- 18.3.1. Accelerator Type
- 18.3.2. Processor Architecture
- 18.3.3. Rated Power Consumption
- 18.3.4. Memory Capacity
- 18.3.5. Computing Performance (TFLOPS)
- 18.3.6. Interconnect Technology
- 18.3.7. Cooling Technology
- 18.3.8. Deployment Model
- 18.3.9. End-use
- 18.3.10. Country
- 18.3.10.1. China
- 18.3.10.2. India
- 18.3.10.3. Japan
- 18.3.10.4. South Korea
- 18.3.10.5. Australia and New Zealand
- 18.3.10.6. Indonesia
- 18.3.10.7. Malaysia
- 18.3.10.8. Thailand
- 18.3.10.9. Vietnam
- 18.3.10.10. Rest of Asia Pacific
- 18.4. China Data Center Accelerators Market
- 18.4.1. Country Segmental Analysis
- 18.4.2. Accelerator Type
- 18.4.3. Processor Architecture
- 18.4.4. Rated Power Consumption
- 18.4.5. Memory Capacity
- 18.4.6. Computing Performance (TFLOPS)
- 18.4.7. Interconnect Technology
- 18.4.8. Cooling Technology
- 18.4.9. Deployment Model
- 18.4.10. End-use
- 18.5. India Data Center Accelerators Market
- 18.5.1. Country Segmental Analysis
- 18.5.2. Accelerator Type
- 18.5.3. Processor Architecture
- 18.5.4. Rated Power Consumption
- 18.5.5. Memory Capacity
- 18.5.6. Computing Performance (TFLOPS)
- 18.5.7. Interconnect Technology
- 18.5.8. Cooling Technology
- 18.5.9. Deployment Model
- 18.5.10. End-use
- 18.6. Japan Data Center Accelerators Market
- 18.6.1. Country Segmental Analysis
- 18.6.2. Accelerator Type
- 18.6.3. Processor Architecture
- 18.6.4. Rated Power Consumption
- 18.6.5. Memory Capacity
- 18.6.6. Computing Performance (TFLOPS)
- 18.6.7. Interconnect Technology
- 18.6.8. Cooling Technology
- 18.6.9. Deployment Model
- 18.6.10. End-use
- 18.7. South Korea Data Center Accelerators Market
- 18.7.1. Country Segmental Analysis
- 18.7.2. Accelerator Type
- 18.7.3. Processor Architecture
- 18.7.4. Rated Power Consumption
- 18.7.5. Memory Capacity
- 18.7.6. Computing Performance (TFLOPS)
- 18.7.7. Interconnect Technology
- 18.7.8. Cooling Technology
- 18.7.9. Deployment Model
- 18.7.10. End-use
- 18.8. Australia and New Zealand Data Center Accelerators Market
- 18.8.1. Country Segmental Analysis
- 18.8.2. Accelerator Type
- 18.8.3. Processor Architecture
- 18.8.4. Rated Power Consumption
- 18.8.5. Memory Capacity
- 18.8.6. Computing Performance (TFLOPS)
- 18.8.7. Interconnect Technology
- 18.8.8. Cooling Technology
- 18.8.9. Deployment Model
- 18.8.10. End-use
- 18.9. Indonesia Data Center Accelerators Market
- 18.9.1. Country Segmental Analysis
- 18.9.2. Accelerator Type
- 18.9.3. Processor Architecture
- 18.9.4. Rated Power Consumption
- 18.9.5. Memory Capacity
- 18.9.6. Computing Performance (TFLOPS)
- 18.9.7. Interconnect Technology
- 18.9.8. Cooling Technology
- 18.9.9. Deployment Model
- 18.9.10. End-use
- 18.10. Malaysia Data Center Accelerators Market
- 18.10.1. Country Segmental Analysis
- 18.10.2. Accelerator Type
- 18.10.3. Processor Architecture
- 18.10.4. Rated Power Consumption
- 18.10.5. Memory Capacity
- 18.10.6. Computing Performance (TFLOPS)
- 18.10.7. Interconnect Technology
- 18.10.8. Cooling Technology
- 18.10.9. Deployment Model
- 18.10.10. End-use
- 18.11. Thailand Data Center Accelerators Market
- 18.11.1. Country Segmental Analysis
- 18.11.2. Accelerator Type
- 18.11.3. Processor Architecture
- 18.11.4. Rated Power Consumption
- 18.11.5. Memory Capacity
- 18.11.6. Computing Performance (TFLOPS)
- 18.11.7. Interconnect Technology
- 18.11.8. Cooling Technology
- 18.11.9. Deployment Model
- 18.11.10. End-use
- 18.12. Vietnam Data Center Accelerators Market
- 18.12.1. Country Segmental Analysis
- 18.12.2. Accelerator Type
- 18.12.3. Processor Architecture
- 18.12.4. Rated Power Consumption
- 18.12.5. Memory Capacity
- 18.12.6. Computing Performance (TFLOPS)
- 18.12.7. Interconnect Technology
- 18.12.8. Cooling Technology
- 18.12.9. Deployment Model
- 18.12.10. End-use
- 18.13. Rest of Asia Pacific Data Center Accelerators Market
- 18.13.1. Country Segmental Analysis
- 18.13.2. Accelerator Type
- 18.13.3. Processor Architecture
- 18.13.4. Rated Power Consumption
- 18.13.5. Memory Capacity
- 18.13.6. Computing Performance (TFLOPS)
- 18.13.7. Interconnect Technology
- 18.13.8. Cooling Technology
- 18.13.9. Deployment Model
- 18.13.10. End-use
- 19. Middle East Data Center Accelerators Market Analysis
- 19.1. Key Segment Analysis
- 19.2. Regional Snapshot
- 19.3. Middle East Data Center Accelerators Market Size (Value - US$ Bn), Analysis, and Forecasts, 2021-2035
- 19.3.1. Accelerator Type
- 19.3.2. Processor Architecture
- 19.3.3. Rated Power Consumption
- 19.3.4. Memory Capacity
- 19.3.5. Computing Performance (TFLOPS)
- 19.3.6. Interconnect Technology
- 19.3.7. Cooling Technology
- 19.3.8. Deployment Model
- 19.3.9. End-use
- 19.3.10. Country
- 19.3.10.1. Turkey
- 19.3.10.2. UAE
- 19.3.10.3. Saudi Arabia
- 19.3.10.4. Israel
- 19.3.10.5. Rest of Middle East
- 19.4. Turkey Data Center Accelerators Market
- 19.4.1. Country Segmental Analysis
- 19.4.2. Accelerator Type
- 19.4.3. Processor Architecture
- 19.4.4. Rated Power Consumption
- 19.4.5. Memory Capacity
- 19.4.6. Computing Performance (TFLOPS)
- 19.4.7. Interconnect Technology
- 19.4.8. Cooling Technology
- 19.4.9. Deployment Model
- 19.4.10. End-use
- 19.5. UAE Data Center Accelerators Market
- 19.5.1. Country Segmental Analysis
- 19.5.2. Accelerator Type
- 19.5.3. Processor Architecture
- 19.5.4. Rated Power Consumption
- 19.5.5. Memory Capacity
- 19.5.6. Computing Performance (TFLOPS)
- 19.5.7. Interconnect Technology
- 19.5.8. Cooling Technology
- 19.5.9. Deployment Model
- 19.5.10. End-use
- 19.6. Saudi Arabia Data Center Accelerators Market
- 19.6.1. Country Segmental Analysis
- 19.6.2. Accelerator Type
- 19.6.3. Processor Architecture
- 19.6.4. Rated Power Consumption
- 19.6.5. Memory Capacity
- 19.6.6. Computing Performance (TFLOPS)
- 19.6.7. Interconnect Technology
- 19.6.8. Cooling Technology
- 19.6.9. Deployment Model
- 19.6.10. End-use
- 19.7. Israel Data Center Accelerators Market
- 19.7.1. Country Segmental Analysis
- 19.7.2. Accelerator Type
- 19.7.3. Processor Architecture
- 19.7.4. Rated Power Consumption
- 19.7.5. Memory Capacity
- 19.7.6. Computing Performance (TFLOPS)
- 19.7.7. Interconnect Technology
- 19.7.8. Cooling Technology
- 19.7.9. Deployment Model
- 19.7.10. End-use
- 19.8. Rest of Middle East Data Center Accelerators Market
- 19.8.1. Country Segmental Analysis
- 19.8.2. Accelerator Type
- 19.8.3. Processor Architecture
- 19.8.4. Rated Power Consumption
- 19.8.5. Memory Capacity
- 19.8.6. Computing Performance (TFLOPS)
- 19.8.7. Interconnect Technology
- 19.8.8. Cooling Technology
- 19.8.9. Deployment Model
- 19.8.10. End-use
- 20. Africa Data Center Accelerators Market Analysis
- 20.1. Key Segment Analysis
- 20.2. Regional Snapshot
- 20.3. Africa Data Center Accelerators Market Size (Value - US$ Bn), Analysis, and Forecasts, 2021-2035
- 20.3.1. Accelerator Type
- 20.3.2. Processor Architecture
- 20.3.3. Rated Power Consumption
- 20.3.4. Memory Capacity
- 20.3.5. Computing Performance (TFLOPS)
- 20.3.6. Interconnect Technology
- 20.3.7. Cooling Technology
- 20.3.8. Deployment Model
- 20.3.9. End-use
- 20.3.10. Country
- 20.3.10.1. South Africa
- 20.3.10.2. Egypt
- 20.3.10.3. Nigeria
- 20.3.10.4. Algeria
- 20.3.10.5. Rest of Africa
- 20.4. South Africa Data Center Accelerators Market
- 20.4.1. Country Segmental Analysis
- 20.4.2. Accelerator Type
- 20.4.3. Processor Architecture
- 20.4.4. Rated Power Consumption
- 20.4.5. Memory Capacity
- 20.4.6. Computing Performance (TFLOPS)
- 20.4.7. Interconnect Technology
- 20.4.8. Cooling Technology
- 20.4.9. Deployment Model
- 20.4.10. End-use
- 20.5. Egypt Data Center Accelerators Market
- 20.5.1. Country Segmental Analysis
- 20.5.2. Accelerator Type
- 20.5.3. Processor Architecture
- 20.5.4. Rated Power Consumption
- 20.5.5. Memory Capacity
- 20.5.6. Computing Performance (TFLOPS)
- 20.5.7. Interconnect Technology
- 20.5.8. Cooling Technology
- 20.5.9. Deployment Model
- 20.5.10. End-use
- 20.6. Nigeria Data Center Accelerators Market
- 20.6.1. Country Segmental Analysis
- 20.6.2. Accelerator Type
- 20.6.3. Processor Architecture
- 20.6.4. Rated Power Consumption
- 20.6.5. Memory Capacity
- 20.6.6. Computing Performance (TFLOPS)
- 20.6.7. Interconnect Technology
- 20.6.8. Cooling Technology
- 20.6.9. Deployment Model
- 20.6.10. End-use
- 20.7. Algeria Data Center Accelerators Market
- 20.7.1. Country Segmental Analysis
- 20.7.2. Accelerator Type
- 20.7.3. Processor Architecture
- 20.7.4. Rated Power Consumption
- 20.7.5. Memory Capacity
- 20.7.6. Computing Performance (TFLOPS)
- 20.7.7. Interconnect Technology
- 20.7.8. Cooling Technology
- 20.7.9. Deployment Model
- 20.7.10. End-use
- 20.8. Rest of Africa Data Center Accelerators Market
- 20.8.1. Country Segmental Analysis
- 20.8.2. Accelerator Type
- 20.8.3. Processor Architecture
- 20.8.4. Rated Power Consumption
- 20.8.5. Memory Capacity
- 20.8.6. Computing Performance (TFLOPS)
- 20.8.7. Interconnect Technology
- 20.8.8. Cooling Technology
- 20.8.9. Deployment Model
- 20.8.10. End-use
- 21. South America Data Center Accelerators Market Analysis
- 21.1. Key Segment Analysis
- 21.2. Regional Snapshot
- 21.3. South America Data Center Accelerators Market Size (Value - US$ Bn), Analysis, and Forecasts, 2021-2035
- 21.3.1. Accelerator Type
- 21.3.2. Processor Architecture
- 21.3.3. Rated Power Consumption
- 21.3.4. Memory Capacity
- 21.3.5. Computing Performance (TFLOPS)
- 21.3.6. Interconnect Technology
- 21.3.7. Cooling Technology
- 21.3.8. Deployment Model
- 21.3.9. End-use
- 21.3.10. Country
- 21.3.10.1. Brazil
- 21.3.10.2. Argentina
- 21.3.10.3. Rest of South America
- 21.4. Brazil Data Center Accelerators Market
- 21.4.1. Country Segmental Analysis
- 21.4.2. Accelerator Type
- 21.4.3. Processor Architecture
- 21.4.4. Rated Power Consumption
- 21.4.5. Memory Capacity
- 21.4.6. Computing Performance (TFLOPS)
- 21.4.7. Interconnect Technology
- 21.4.8. Cooling Technology
- 21.4.9. Deployment Model
- 21.4.10. End-use
- 21.5. Argentina Data Center Accelerators Market
- 21.5.1. Country Segmental Analysis
- 21.5.2. Accelerator Type
- 21.5.3. Processor Architecture
- 21.5.4. Rated Power Consumption
- 21.5.5. Memory Capacity
- 21.5.6. Computing Performance (TFLOPS)
- 21.5.7. Interconnect Technology
- 21.5.8. Cooling Technology
- 21.5.9. Deployment Model
- 21.5.10. End-use
- 21.6. Rest of South America Data Center Accelerators Market
- 21.6.1. Country Segmental Analysis
- 21.6.2. Accelerator Type
- 21.6.3. Processor Architecture
- 21.6.4. Rated Power Consumption
- 21.6.5. Memory Capacity
- 21.6.6. Computing Performance (TFLOPS)
- 21.6.7. Interconnect Technology
- 21.6.8. Cooling Technology
- 21.6.9. Deployment Model
- 21.6.10. End-use
- 22. Key Players/ Company Profile
- 22.1. Advanced Micro Devices (AMD)
- 22.1.1. Company Details/ Overview
- 22.1.2. Company Financials
- 22.1.3. Key Customers and Competitors
- 22.1.4. Business/ Industry Portfolio
- 22.1.5. Product Portfolio/ Specification Details
- 22.1.6. Pricing Data
- 22.1.7. Strategic Overview
- 22.1.8. Recent Developments
- 22.2. Amazon Web Services (AWS)
- 22.3. Ampere Computing
- 22.4. Baidu Inc.
- 22.5. Broadcom Inc.
- 22.6. Cerebras Systems
- 22.7. Flex Logix Technologies
- 22.8. Fujitsu Limited
- 22.9. Google LLC (Alphabet Inc.)
- 22.10. Graphcore
- 22.11. Hailo Technologies
- 22.12. Huawei Technologies
- 22.13. Imagination Technologies
- 22.14. Intel Corporation
- 22.15. Marvell Technology
- 22.16. Microsoft Corporation
- 22.17. NEC Corporation
- 22.18. NVIDIA Corporation
- 22.19. SambaNova Systems
- 22.20. Samsung Electronics
- 22.21. Synopsys Inc.
- 22.22. Other Key Players
- 22.1. Advanced Micro Devices (AMD)
Note* - This is just tentative list of players. While providing the report, we will cover more number of players based on their revenue and share for each geography
Research Design
Our research design integrates both demand-side and supply-side analysis through a balanced combination of primary and secondary research methodologies. By utilizing both bottom-up and top-down approaches alongside rigorous data triangulation methods, we deliver robust market intelligence that supports strategic decision-making.
MarketGenics' comprehensive research design framework ensures the delivery of accurate, reliable, and actionable market intelligence. Through the integration of multiple research approaches, rigorous validation processes, and expert analysis, we provide our clients with the insights needed to make informed strategic decisions and capitalize on market opportunities.

MarketGenics leverages a dedicated industry panel of experts and a comprehensive suite of paid databases to effectively collect, consolidate, and analyze market intelligence.
Our approach has consistently proven to be reliable and effective in generating accurate market insights, identifying key industry trends, and uncovering emerging business opportunities.
Through both primary and secondary research, we capture and analyze critical company-level data such as manufacturing footprints, including technical centers, R&D facilities, sales offices, and headquarters.
Our expert panel further enhances our ability to estimate market size for specific brands based on validated field-level intelligence.
Our data mining techniques incorporate both parametric and non-parametric methods, allowing for structured data collection, sorting, processing, and cleaning.
Demand projections are derived from large-scale data sets analyzed through proprietary algorithms, culminating in robust and reliable market sizing.
Research Approach
The bottom-up approach builds market estimates by starting with the smallest addressable market units and systematically aggregating them to create comprehensive market size projections.
This method begins with specific, granular data points and builds upward to create the complete market landscape.
Customer Analysis → Segmental Analysis → Geographical Analysis
The top-down approach starts with the broadest possible market data and systematically narrows it down through a series of filters and assumptions to arrive at specific market segments or opportunities.
This method begins with the big picture and works downward to increasingly specific market slices.
TAM → SAM → SOM


Research Methods
Desk / Secondary Research
While analysing the market, we extensively study secondary sources, directories, and databases to identify and collect information useful for this technical, market-oriented, and commercial report. Secondary sources that we utilize are not only the public sources, but it is a combination of Open Source, Associations, Paid Databases, MG Repository & Knowledgebase, and others.
- Company websites, annual reports, financial reports, broker reports, and investor presentations
- National government documents, statistical databases and reports
- News articles, press releases and web-casts specific to the companies operating in the market, Magazines, reports, and others
- We gather information from commercial data sources for deriving company specific data such as segmental revenue, share for geography, product revenue, and others
- Internal and external proprietary databases (industry-specific), relevant patent, and regulatory databases
- Governing Bodies, Government Organizations
- Relevant Authorities, Country-specific Associations for Industries
We also employ the model mapping approach to estimate the product level market data through the players' product portfolio
Primary Research
Primary research/ interviews is vital in analyzing the market. Most of the cases involves paid primary interviews. Primary sources include primary interviews through e-mail interactions, telephonic interviews, surveys as well as face-to-face interviews with the different stakeholders across the value chain including several industry experts.
| Type of Respondents | Number of Primaries |
|---|---|
| Tier 2/3 Suppliers | ~20 |
| Tier 1 Suppliers | ~25 |
| End-users | ~25 |
| Industry Expert/ Panel/ Consultant | ~30 |
| Total | ~100 |
MG Knowledgebase
• Repository of industry blog, newsletter and case studies
• Online platform covering detailed market reports, and company profiles
Forecasting Factors and Models
Forecasting Factors
- Historical Trends – Past market patterns, cycles, and major events that shaped how markets behave over time. Understanding past trends helps predict future behavior.
- Industry Factors – Specific characteristics of the industry like structure, regulations, and innovation cycles that affect market dynamics.
- Macroeconomic Factors – Economic conditions like GDP growth, inflation, and employment rates that affect how much money people have to spend.
- Demographic Factors – Population characteristics like age, income, and location that determine who can buy your product.
- Technology Factors – How quickly people adopt new technology and how much technology infrastructure exists.
- Regulatory Factors – Government rules, laws, and policies that can help or restrict market growth.
- Competitive Factors – Analyzing competition structure such as degree of competition and bargaining power of buyers and suppliers.
Forecasting Models / Techniques
Multiple Regression Analysis
- Identify and quantify factors that drive market changes
- Statistical modeling to establish relationships between market drivers and outcomes
Time Series Analysis – Seasonal Patterns
- Understand regular cyclical patterns in market demand
- Advanced statistical techniques to separate trend, seasonal, and irregular components
Time Series Analysis – Trend Analysis
- Identify underlying market growth patterns and momentum
- Statistical analysis of historical data to project future trends
Expert Opinion – Expert Interviews
- Gather deep industry insights and contextual understanding
- In-depth interviews with key industry stakeholders
Multi-Scenario Development
- Prepare for uncertainty by modeling different possible futures
- Creating optimistic, pessimistic, and most likely scenarios
Time Series Analysis – Moving Averages
- Sophisticated forecasting for complex time series data
- Auto-regressive integrated moving average models with seasonal components
Econometric Models
- Apply economic theory to market forecasting
- Sophisticated economic models that account for market interactions
Expert Opinion – Delphi Method
- Harness collective wisdom of industry experts
- Structured, multi-round expert consultation process
Monte Carlo Simulation
- Quantify uncertainty and probability distributions
- Thousands of simulations with varying input parameters
Research Analysis
Our research framework is built upon the fundamental principle of validating market intelligence from both demand and supply perspectives. This dual-sided approach ensures comprehensive market understanding and reduces the risk of single-source bias.
Demand-Side Analysis: We understand end-user/application behavior, preferences, and market needs along with the penetration of the product for specific application.
Supply-Side Analysis: We estimate overall market revenue, analyze the segmental share along with industry capacity, competitive landscape, and market structure.
Validation & Evaluation
Data triangulation is a validation technique that uses multiple methods, sources, or perspectives to examine the same research question, thereby increasing the credibility and reliability of research findings. In market research, triangulation serves as a quality assurance mechanism that helps identify and minimize bias, validate assumptions, and ensure accuracy in market estimates.
- Data Source Triangulation – Using multiple data sources to examine the same phenomenon
- Methodological Triangulation – Using multiple research methods to study the same research question
- Investigator Triangulation – Using multiple researchers or analysts to examine the same data
- Theoretical Triangulation – Using multiple theoretical perspectives to interpret the same data

Custom Market Research Services
We will customise the research for you, in case the report listed above does not meet your requirements.
Get 10% Free Customisation