Electric Bus Market Size, Share & Trends Analysis Report by Bus Type (Urban Buses, Intercity / Coach Buses, School Buses, Mini / Feeder Buses, Others), Battery Type, Length, Power Output, Seating Capacity, Speed Range, Range, Charging Type, Drive Type, Propulsion Type, Ownership Model, End-use, and Geography (North America, Europe, Asia Pacific, Middle East, Africa, and South America) – Global Industry Data, Trends, and Forecasts, 2026–2035
Market Overview:
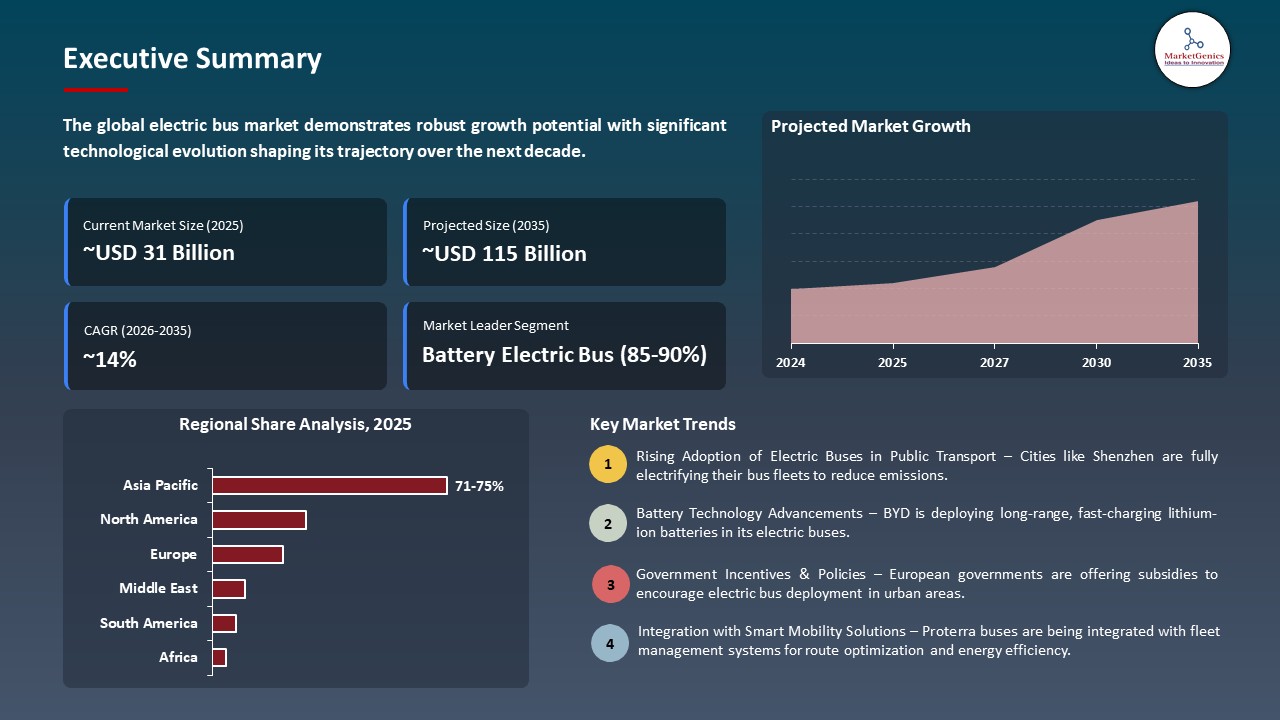
According to MarketGenics, the global Electric Bus market is projected to grow from USD 31.2 billion in 2025 to USD 114.7 billion by 2035, registering a CAGR of 13.9% during the forecast period.
|
|
|
Segmental Data Insights |
|
|
Demand Trends |
|
|
Competitive Landscape |
|
|
Strategic Development |
|
|
Future Outlook & Opportunities |
|
Electric Bus market Size, Share, and Growth
Digitally enhanced vehicle architectures, embedded power electronics intelligence and real-time operational analytics are leading the global electric-bus-market as transit operators are able to understand vehicle health, energy flow, and route performance in a wide array of urban and intercity settings.
Rohan Dewan, Co-Founder of LeafyBus, said, the industry is moving toward cleaner mobility, but the real progress comes when EV travel is not experimental - it is consistent, commercially viable and widely accessible. With these new buses and our expanding charging ecosystem, we are accelerating the rollout of a national electric network that delivers a simple, comfortable and future-ready travel experience for millions.
The global electric bus market is growing with the cities and transport authorities focusing on the mobility of zero-emissions, real-time tracking of their fleets, and an increase in the passenger throughput of both urban and intercity routes. Electrification of vehicles like large capacity traction batteries, digitally controlled drives and onboard diagnostics are allowing consistent changeovers of diesel fleet without service performance being compromised. For instance, in October 2025, JBM Electric Vehicles rolled out the ECOLIFE e12 electric city bus at Busworld Europe in Brussels, which is provided with built-in telematics, high-tech safety features, and made lightweight to support efficient urban public transport.
The combination of AI-based fleet analytics and cloud-connected vehicles is enhancing the work of electric buses with predictive maintenance, efficient routing, and fuel-efficient driving. Telematics of the vehicles and real-time monitoring of the batteries are cutting down the downtimes and enhancing the availability of the fleet. For instance, in March 2024, Stratio Automotive joined forces with Singapore-based SBS Transit to implement an AI-based predictive maintenance system that can monitor the health of the vehicles and batteries used in electric buses in real time, thus improving the dependability of the buses.
The adjacent opportunities in grid-interactive charging, battery lifecycle management, and integration of renewable energy are continuing to increase the attractiveness of markets. Electric buses are transforming not only as transport assets but also into smart, connected mobility systems that help decarbonize the transport system, make cities resilient, and sustainably operate over the long term as a support pillar of next-generation public transportation across the globe.
 Electric Bus market Dynamics and Trends
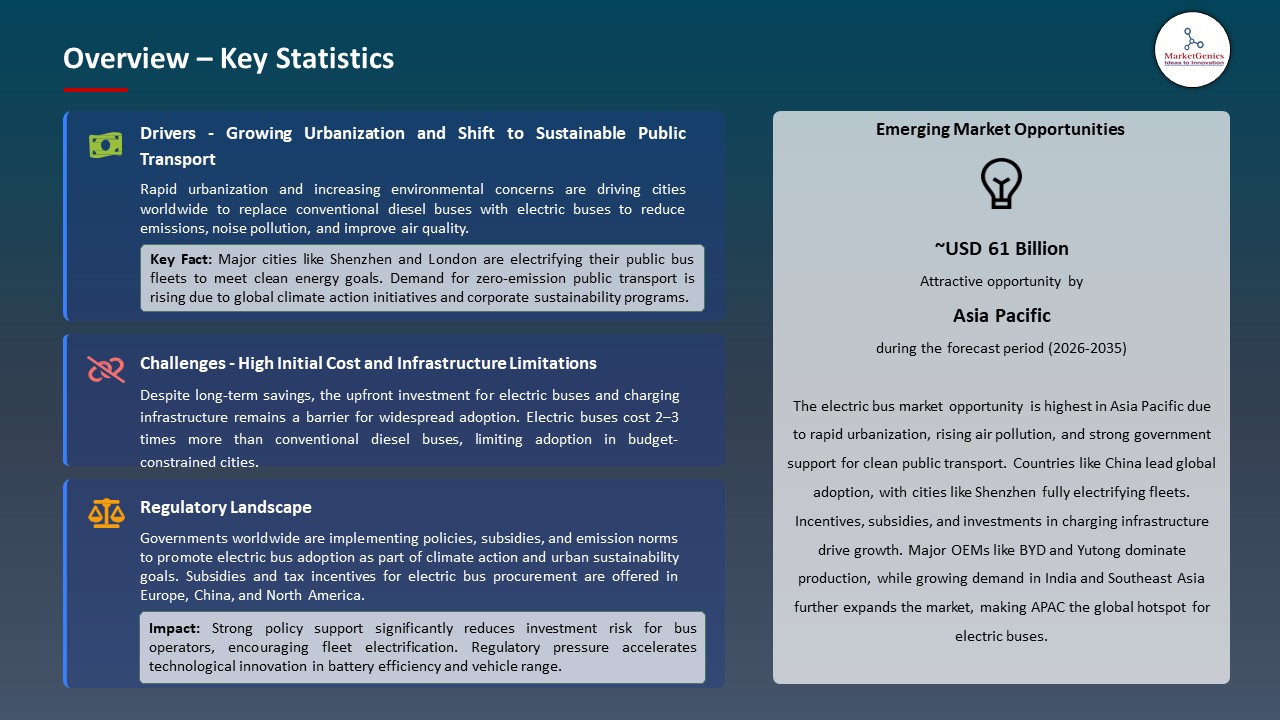
Driver: Strong Government Policies & Environmental Regulations
-
The growing attention to the air quality of cities, the goal to achieve carbon-neutral movement, and sustainable mobility of the population is pushing the mass deployment of electric buses around the globe as governments strive to reduce emissions even while ensuring effective and cost-effective public transport networks.
- Incentives and regulatory requirements that are supported by policy are hastening the electrification of fleets since they mitigate financial and operational risks on the part of transit operators. For instance, in August 2025, the PM-E-Drive Scheme in India granted subsidies on the installation of over 10,900 electric buses in mega cities such as Bengaluru, Delhi, Hyderabad, Ahmedabad, and Surat to help the country go fossil fuel free in its public transport.
- The adoption of electric buses by the government as part of clean mobility and smart city is solidifying the long-term adoption and environmental adherence across all levels of globe.
Restraint: High Upfront Costs
-
High initial capital cost of electric buses, such as advanced battery packs, power electronics and dedicated charging infrastructure, is still inhibiting adoption especially to small and mid-size transit agencies in comparison to traditional diesel or CNG fleets.
- Continuous operation investment e.g. depot developments, large-capacity grid connections, rapid chargers, battery swap reserves, and fleet and energy management software are additional increases to the initial upfront financial cost of an electric bus operator.
- Poor grid preparedness, availability of funding, and availability of skilled labor in emerging markets are still pulling down the implementation of large scale electric buses.
Opportunity: Technological Advancements in Battery & Charging Systems
-
The integration of the next-generation battery chemistries with the improved technologies in the charging is generating a good growth potential in the global electric bus market as it can expand the range length, quicker charging, and increased frequency of routes.
- Smart charging systems with high-performance batteries are facilitating real-time optimization of energy consumption and life of assets. For instance, in June 2024, Toshiba, Sojitz, and CBMM created and tested a prototype electric bus powered by next-generation lithium-ion batteries with niobium titanium oxide anodes, allowing the charge to be refueled in about 10 minutes without compromising on energy density to support intensive bus operations.
- Scalable battery and ultra-fast charging solution is lowering overall cost of ownership and increasing the uptake of large-scale electric buses across the globe.
Key Trend: Shift to Long‑Range & Smart Charging Solutions
-
The uptake of long-range electric buses in conjunction with smart charging infrastructure is rapidly expanding the global electric bus market as it allows buses to cover larger distances, have greater capacity, and maximise energy utilisation in the city, intercity, and transit buses services.
- AI analytics, IoT-enabled chargers, and cloud-based fleets are increasingly being incorporated into real-time charging and energy management platforms, to provide actionable insights; For instance, in June 2025 partnership between Optibus and cloud-based fleet manager Dhemax, to implement an AI-powered smart charging platform to optimize charging schedules, route requirements, and battery health to reduce downtime and improve efficiency.
- Built-in smart charge systems allow scalable and energy-efficient electric bus fleets that are more sustainable.
Electric Bus Market Analysis and Segmental Data
Battery Electric Bus (BEB) Dominate Global Electric Bus Market
-
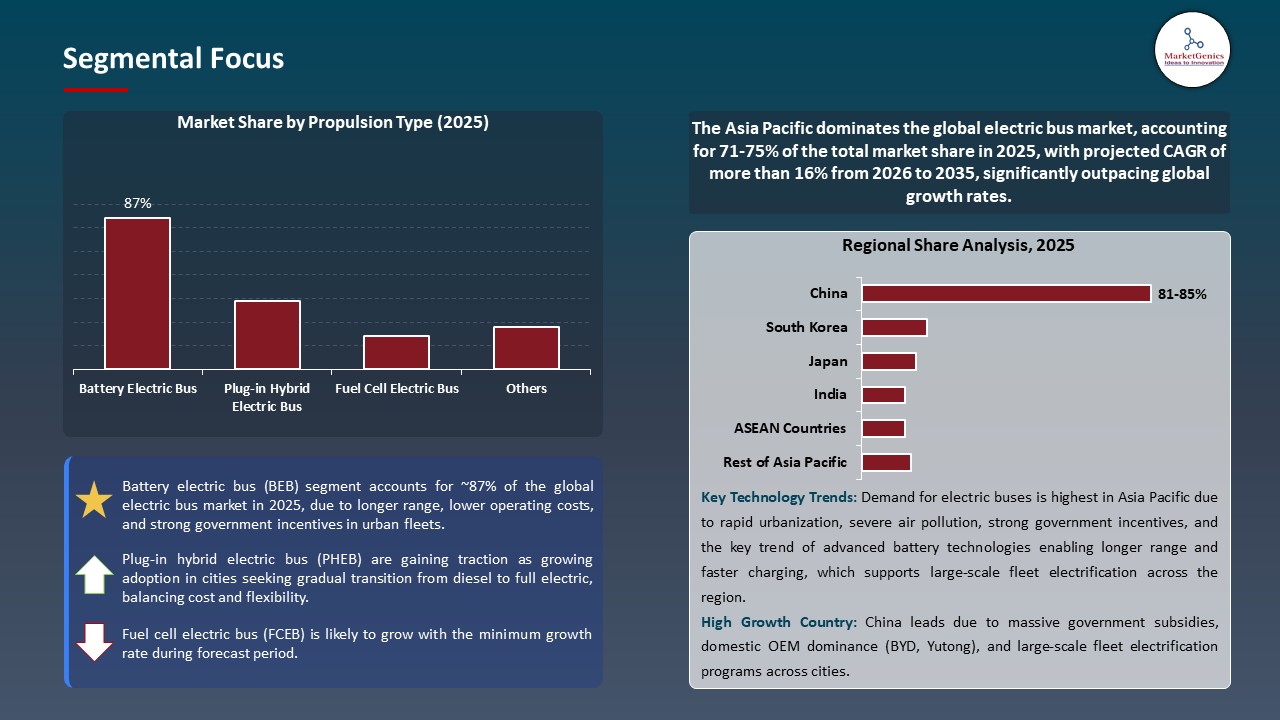
The battery electric buses (BEBs) dominate the electric bus market since it is a necessity of zero-emission transport, reduced operational expenses, and increased vehicle life than that of a diesel or hybrid bus.
- High capacity and long-range BEBs, having advanced battery management systems, are quickly being implemented, which allows longer daily routes, quicker charging and efficient fleet operations. For instance, in March 2025, implementation at the government level is the delivery of more than 1,200 long-range electric buses to major cities in China and India by BYD within the framework of government fleet electrification, reinforcing its use in the public transportation network.
- Extended charging stations, intelligent fleet, and long-term procurement agreements enhance BEB dominance in the global electric bus market.
Asia Pacific Leads Global Electric Bus Market Demand
-
Asia Pacific leads the electric bus market since it has far-reaching electrification requirements, significant procurement initiatives, and a swift implementation of battery electric buses in major cities in China, India, Singapore, Japan, and South Korea.
- The application of high-tech electric bus fleets is developing at an accelerated rate, integrated high-speed charging systems, energy management frameworks, and green financing are being implemented to enhance performance. For instance, in 2024, 360 new electric buses commissioned in Singapore with a contract worth 166.4 million that were announced in March 2025 and with a further 660 buses tendered by 2027 to aid its intention of increasing its electric buses to over 5000.
- Strong local manufacturing scale-ups, policy incentives and public-private partnerships continue to reinforce the domination of Asia Pacific in the global electric bus market.
Electric Bus Market Ecosystem
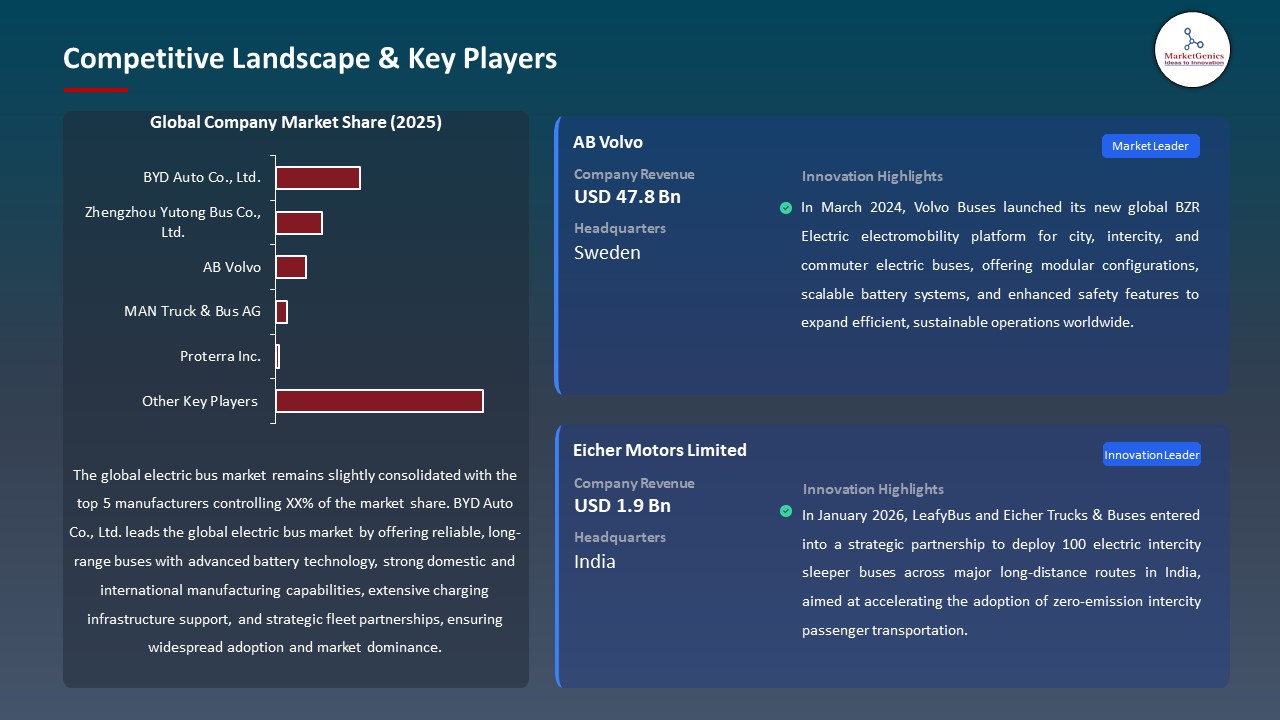
The global electric bus market moderately consolidated, and the intensity of competition is aimed at battery technology, electric powertrain, charging infrastructure, IoT-based fleet control, and telematics. The existence of BYD Auto Co., Ltd., Zhengzhou Yutong Bus Co., Ltd., AB Volvo, MAN Truck & Bus AG, and Proterra Inc. justifies the magnitude of the market share since these providers offer a complete electric bus ecosystem, which comprise highly effective battery system, high efficiency drive trains, connectivity modules, energy management programs, telematics platforms and charging systems.
BYD Auto Co., Ltd. creates LFP batteries, efficient drive systems, and fleet management systems to enhance range and energy consumption. Zhengzhou Yutong Bus Co., Ltd. combines predictive maintenance based on the modular bus designs and IoT telematics. AB Volvo is specializing in connected fleet and battery thermal management. MAN Truck & Bus AG lays stress on V2G capabilities and telematics dashboard, whereas Proterra Inc. gives modular chassis, depot charging, and route optimization software to achieve maximum operational performance.
Government incentives of zero-emission public transportation, increased use of smart mobility solutions, and collaboration with energy providers, technology start-ups, and research organizations are accelerating the development of battery energy density, interoperability of charging, fleet telematics, and use of real-time operational data. These ecosystem relationships enhance competitive differentiation, allow the implementation of mass transit of electric buses, and accelerate the development of environmentally friendly urban transportation, so the Electric Bus worldwide market is at work to mitigate emissions, enhance operational efficiency, and support climate-resistant sustainable mass transportation.
 Recent Development and Strategic Overview
-
In February 2026, LeafyBus and Eicher Trucks and Buses signed a strategic alliance to roll out 100 electric intercity sleeper buses (Skyline Pro E, 13.5 m) along major long-haul routes in India, to hasten the shift to zero-emission intercity passenger transportation.
- In January 2025, JBM Auto unveiled four new sets of electric buses and electric ambulance, the Galaxy luxury coach, Xpress intercity bus, e-MediLife electric medical mobile unit, and the e-SkyLife 9 meter electric tarmac coach to develop sustainable and diversified e-mobility solutions.
Report Scope
|
Detail |
|
|
Market Size in 2025 |
USD 31.2 Bn |
|
Market Forecast Value in 2035 |
USD 114.7 Bn |
|
Growth Rate (CAGR) |
13.9% |
|
Forecast Period |
2026 – 2035 |
|
Historical Data Available for |
2021 – 2024 |
|
Market Size Units |
US$ Billion for Value Thousand Units for Volume |
|
Report Format |
Electronic (PDF) + Excel |
|
North America |
Europe |
Asia Pacific |
Middle East |
Africa |
South America |
|
|
|
|
|
|
|
Companies Covered |
|||||
|
|
|
|
|
|
Electric Bus Market Segmentation and Highlights
|
Segment |
Sub-segment |
|
Electric Bus Market, By Bus Type |
|
|
Electric Bus Market, By Battery Type |
|
|
Electric Bus Market, By Length |
|
|
Electric Bus Market, By Power Output |
|
|
Electric Bus Market, By Seating Capacity |
|
|
Electric Bus Market, Speed Range |
|
|
Electric Bus Market, By Range |
|
|
Electric Bus Market, By Charging Type |
|
|
Electric Bus Market, By Drive Type |
|
|
Electric Bus Market, By Propulsion Type |
|
|
Electric Bus Market, By Ownership Model |
|
|
Electric Bus Market, By End-use |
|
Frequently Asked Questions
Table of Contents
- 1. Research Methodology and Assumptions
- 1.1. Definitions
- 1.2. Research Design and Approach
- 1.3. Data Collection Methods
- 1.4. Base Estimates and Calculations
- 1.5. Forecasting Models
- 1.5.1. Key Forecast Factors & Impact Analysis
- 1.6. Secondary Research
- 1.6.1. Open Sources
- 1.6.2. Paid Databases
- 1.6.3. Associations
- 1.7. Primary Research
- 1.7.1. Primary Sources
- 1.7.2. Primary Interviews with Stakeholders across Ecosystem
- 2. Executive Summary
- 2.1. Global Electric Bus Market Outlook
- 2.1.1. Electric Bus Market Size (Volume - Thousand Units & Value - US$ Bn), and Forecasts, 2021-2035
- 2.1.2. Compounded Annual Growth Rate Analysis
- 2.1.3. Growth Opportunity Analysis
- 2.1.4. Segmental Share Analysis
- 2.1.5. Geographical Share Analysis
- 2.2. Market Analysis and Facts
- 2.3. Supply-Demand Analysis
- 2.4. Competitive Benchmarking
- 2.5. Go-to- Market Strategy
- 2.5.1. Customer/ End-use Industry Assessment
- 2.5.2. Growth Opportunity Data, 2026-2035
- 2.5.2.1. Regional Data
- 2.5.2.2. Country Data
- 2.5.2.3. Segmental Data
- 2.5.3. Identification of Potential Market Spaces
- 2.5.4. GAP Analysis
- 2.5.5. Potential Attractive Price Points
- 2.5.6. Prevailing Market Risks & Challenges
- 2.5.7. Preferred Sales & Marketing Strategies
- 2.5.8. Key Recommendations and Analysis
- 2.5.9. A Way Forward
- 2.1. Global Electric Bus Market Outlook
- 3. Industry Data and Premium Insights
- 3.1. Global Automotive & Transportation Industry Overview, 2025
- 3.1.1. Automotive & Transportation Industry Ecosystem Analysis
- 3.1.2. Key Trends for Automotive & Transportation Industry
- 3.1.3. Regional Distribution for Automotive & Transportation Industry
- 3.2. Supplier Customer Data
- 3.3. Technology Roadmap and Developments
- 3.4. Trade Analysis
- 3.4.1. Import & Export Analysis, 2025
- 3.4.2. Top Importing Countries
- 3.4.3. Top Exporting Countries
- 3.5. Trump Tariff Impact Analysis
- 3.5.1. Manufacturer
- 3.5.1.1. Based on the component & Raw material
- 3.5.2. Supply Chain
- 3.5.3. End Consumer
- 3.5.1. Manufacturer
- 3.6. Raw Material Analysis
- 3.1. Global Automotive & Transportation Industry Overview, 2025
- 4. Market Overview
- 4.1. Market Dynamics
- 4.1.1. Drivers
- 4.1.1.1. Increasing government support through emission regulations, subsidies, and incentives for zero‑emission buses.
- 4.1.1.2. Lower total cost of ownership due to reduced fuel and maintenance expenses compared to diesel buses.
- 4.1.1.3. Advancements in battery technology, including higher energy density and faster charging.
- 4.1.2. Restraints
- 4.1.2.1. High upfront capital costs for electric buses and charging infrastructure.
- 4.1.2.2. Limited and underdeveloped charging infrastructure in many regions.
- 4.1.1. Drivers
- 4.2. Key Trend Analysis
- 4.3. Regulatory Framework
- 4.3.1. Key Regulations, Norms, and Subsidies, by Key Countries
- 4.3.2. Tariffs and Standards
- 4.3.3. Impact Analysis of Regulations on the Market
- 4.4. Value Chain Analysis
- 4.4.1. Component Suppliers
- 4.4.2. Manufacturers
- 4.4.3. Dealers/ Channel Partners
- 4.4.4. End-Users/ Customers
- 4.5. Porter’s Five Forces Analysis
- 4.6. PESTEL Analysis
- 4.7. Global Electric Bus Market Demand
- 4.7.1. Historical Market Size – (Volume - Thousand Units & Value - US$ Bn), 2020-2024
- 4.7.2. Current and Future Market Size – (Volume - Thousand Units & Value - US$ Bn), 2026–2035
- 4.7.3. Y-o-Y Growth Trends
- 4.7.4. Absolute $ Opportunity Assessment
- 4.1. Market Dynamics
- 5. Competition Landscape
- 5.1. Competition structure
- 5.1.1. Fragmented v/s consolidated
- 5.2. Company Share Analysis, 2025
- 5.2.1. Global Company Market Share
- 5.2.2. By Region
- 5.2.2.1. North America
- 5.2.2.2. Europe
- 5.2.2.3. Asia Pacific
- 5.2.2.4. Middle East
- 5.2.2.5. Africa
- 5.2.2.6. South America
- 5.3. Product Comparison Matrix
- 5.3.1. Specifications
- 5.3.2. Market Positioning
- 5.3.3. Pricing
- 5.1. Competition structure
- 6. Global Electric Bus Market Analysis, by Bus Type
- 6.1. Key Segment Analysis
- 6.2. Electric Bus Market Size (Volume - Thousand Units & Value - US$ Bn), Analysis, and Forecasts, by Bus Type, 2021-2035
- 6.2.1. Urban Buses
- 6.2.2. Intercity / Coach Buses
- 6.2.3. School Buses
- 6.2.4. Mini / Feeder Buses
- 6.2.5. Others
- 7. Global Electric Bus Market Analysis, by Battery Type
- 7.1. Key Segment Analysis
- 7.2. Electric Bus Market Size (Volume - Thousand Units & Value - US$ Bn), Analysis, and Forecasts, by Battery Type, 2021-2035
- 7.2.1. Lithium-Ion Battery
- 7.2.1.1. Lithium Iron Phosphate (LFP)
- 7.2.1.2. Lithium Nickel Manganese Cobalt Oxide (NMC)
- 7.2.1.3. Lithium Titanate Oxide (LTO)
- 7.2.1.4. Others
- 7.2.2. Nickel-Metal Hydride Battery
- 7.2.3. Solid-State Battery
- 7.2.4. Others
- 7.2.1. Lithium-Ion Battery
- 8. Global Electric Bus Market Analysis, by Length
- 8.1. Key Segment Analysis
- 8.2. Electric Bus Market Size (Volume - Thousand Units & Value - US$ Bn), Analysis, and Forecasts, by Length, 2021-2035
- 8.2.1. Less than 9 meters
- 8.2.2. 9-12 meters
- 8.2.3. 12-15 meters
- 8.2.4. Above 15 meters
- 9. Global Electric Bus Market Analysis, by Power Output
- 9.1. Key Segment Analysis
- 9.2. Electric Bus Market Size (Volume - Thousand Units & Value - US$ Bn), Analysis, and Forecasts, by Power Output, 2021-2035
- 9.2.1. Less than 200 kW
- 9.2.2. 200-300 kW
- 9.2.3. 300-400 kW
- 9.2.4. Above 400 kW
- 10. Global Electric Bus Market Analysis, by Seating Capacity
- 10.1. Key Segment Analysis
- 10.2. Electric Bus Market Size (Volume - Thousand Units & Value - US$ Bn), Analysis, and Forecasts, by Seating Capacity, 2021-2035
- 10.2.1. Up to 30 seats
- 10.2.2. 31-40 seats
- 10.2.3. 41-50 seats
- 10.2.4. Above 50 seats
- 11. Global Electric Bus Market Analysis, by Speed Range
- 11.1. Key Segment Analysis
- 11.2. Electric Bus Market Size (Volume - Thousand Units & Value - US$ Bn), Analysis, and Forecasts, by Speed Range, 2021-2035
- 11.2.1. Up to 50 km/h
- 11.2.2. 50–80 km/h
- 11.2.3. 80–100 km/h
- 11.2.4. Above 100 km/h
- 12. Global Electric Bus Market Analysis, by Range
- 12.1. Key Segment Analysis
- 12.2. Electric Bus Market Size (Volume - Thousand Units & Value - US$ Bn), Analysis, and Forecasts, by Range, 2021-2035
- 12.2.1. Less than 150 km
- 12.2.2. 150-250 km
- 12.2.3. 251-350 km
- 12.2.4. Above 350 km
- 13. Global Electric Bus Market Analysis, by Charging Type
- 13.1. Key Segment Analysis
- 13.2. Electric Bus Market Size (Volume - Thousand Units & Value - US$ Bn), Analysis, and Forecasts, by Charging Type, 2021-2035
- 13.2.1. Plug-in Charging
- 13.2.2. Pantograph Charging
- 13.2.3. Wireless Charging
- 13.2.4. Battery Swapping
- 14. Global Electric Bus Market Analysis, by Drive Type
- 14.1. Key Segment Analysis
- 14.2. Electric Bus Market Size (Volume - Thousand Units & Value - US$ Bn), Analysis, and Forecasts, by Drive Type, 2021-2035
- 14.2.1. Front Wheel Drive
- 14.2.2. Rear Wheel Drive
- 14.2.3. All-Wheel Drive
- 15. Global Electric Bus Market Analysis, by Propulsion Type
- 15.1. Key Segment Analysis
- 15.2. Electric Bus Market Size (Volume - Thousand Units & Value - US$ Bn), Analysis, and Forecasts, by Propulsion Type, 2021-2035
- 15.2.1. Battery Electric Bus (BEB)
- 15.2.2. Plug-in Hybrid Electric Bus (PHEB)
- 15.2.3. Fuel Cell Electric Bus (FCEB)
- 16. Global Electric Bus Market Analysis, by Ownership Model
- 16.1. Key Segment Analysis
- 16.2. Electric Bus Market Size (Volume - Thousand Units & Value - US$ Bn), Analysis, and Forecasts, by Ownership Model, 2021-2035
- 16.2.1. Public/Government Owned
- 16.2.2. Private Owned
- 16.2.3. Leased
- 17. Global Electric Bus Market Analysis, by End-use
- 17.1. Key Segment Analysis
- 17.2. Electric Bus Market Size (Volume - Thousand Units & Value - US$ Bn), Analysis, and Forecasts, by End-use, 2021-2035
- 17.2.1. Public Transit
- 17.2.1.1. Intracity Bus Services
- 17.2.1.2. Intercity Bus Services
- 17.2.1.3. Bus Rapid Transit (BRT)
- 17.2.1.4. Express Transit Services
- 17.2.1.5. Others
- 17.2.2. Tourism & Hospitality
- 17.2.2.1. Sightseeing Tours
- 17.2.2.2. Hotel & Resort Shuttles
- 17.2.2.3. Airport Transfers
- 17.2.2.4. Recreational Transport
- 17.2.2.5. Others
- 17.2.3. Educational Institutions
- 17.2.3.1. School Buses
- 17.2.3.2. University Campus Shuttles
- 17.2.3.3. Educational Field Trips
- 17.2.3.4. Others
- 17.2.4. Corporate & Private
- 17.2.4.1. Employee Shuttle Services
- 17.2.4.2. Corporate Campus Transport
- 17.2.4.3. Private Charter Services
- 17.2.4.4. Others
- 17.2.5. Airport Operations
- 17.2.5.1. Terminal Shuttles
- 17.2.5.2. Apron Buses
- 17.2.5.3. Passenger Transfer Services
- 17.2.5.4. Others
- 17.2.6. Healthcare & Medical
- 17.2.6.1. Hospital Shuttles
- 17.2.6.2. Medical Facility Transport
- 17.2.6.3. Senior Care Facility Buses
- 17.2.6.4. Others
- 17.2.7. Government & Municipal
- 17.2.8. Event & Entertainment
- 17.2.9. Others
- 17.2.1. Public Transit
- 18. Global Electric Bus Market Analysis and Forecasts, by Region
- 18.1. Key Findings
- 18.2. Electric Bus Market Size (Volume - Thousand Units & Value - US$ Bn), Analysis, and Forecasts, by Region, 2021-2035
- 18.2.1. North America
- 18.2.2. Europe
- 18.2.3. Asia Pacific
- 18.2.4. Middle East
- 18.2.5. Africa
- 18.2.6. South America
- 19. North America Electric Bus Market Analysis
- 19.1. Key Segment Analysis
- 19.2. Regional Snapshot
- 19.3. North America Electric Bus Market Size (Volume - Thousand Units & Value - US$ Bn), Analysis, and Forecasts, 2021-2035
- 19.3.1. Bus Type
- 19.3.2. Battery Type
- 19.3.3. Length
- 19.3.4. Power Output
- 19.3.5. Seating Capacity
- 19.3.6. Speed Range
- 19.3.7. Range
- 19.3.8. Charging Type
- 19.3.9. Drive Type
- 19.3.10. Propulsion Type
- 19.3.11. Ownership Model
- 19.3.12. End-use
- 19.3.13. Country
- 19.3.13.1. USA
- 19.3.13.2. Canada
- 19.3.13.3. Mexico
- 19.4. USA Electric Bus Market
- 19.4.1. Country Segmental Analysis
- 19.4.2. Bus Type
- 19.4.3. Battery Type
- 19.4.4. Length
- 19.4.5. Power Output
- 19.4.6. Seating Capacity
- 19.4.7. Speed Range
- 19.4.8. Range
- 19.4.9. Charging Type
- 19.4.10. Drive Type
- 19.4.11. Propulsion Type
- 19.4.12. Ownership Model
- 19.4.13. End-use
- 19.5. Canada Electric Bus Market
- 19.5.1. Country Segmental Analysis
- 19.5.2. Bus Type
- 19.5.3. Battery Type
- 19.5.4. Length
- 19.5.5. Power Output
- 19.5.6. Seating Capacity
- 19.5.7. Speed Range
- 19.5.8. Range
- 19.5.9. Charging Type
- 19.5.10. Drive Type
- 19.5.11. Propulsion Type
- 19.5.12. Ownership Model
- 19.5.13. End-use
- 19.6. Mexico Electric Bus Market
- 19.6.1. Country Segmental Analysis
- 19.6.2. Bus Type
- 19.6.3. Battery Type
- 19.6.4. Length
- 19.6.5. Power Output
- 19.6.6. Seating Capacity
- 19.6.7. Speed Range
- 19.6.8. Range
- 19.6.9. Charging Type
- 19.6.10. Drive Type
- 19.6.11. Propulsion Type
- 19.6.12. Ownership Model
- 19.6.13. End-use
- 20. Europe Electric Bus Market Analysis
- 20.1. Key Segment Analysis
- 20.2. Regional Snapshot
- 20.3. Europe Electric Bus Market Size (Volume - Thousand Units & Value - US$ Bn), Analysis, and Forecasts, 2021-2035
- 20.3.1. Bus Type
- 20.3.2. Battery Type
- 20.3.3. Length
- 20.3.4. Power Output
- 20.3.5. Seating Capacity
- 20.3.6. Speed Range
- 20.3.7. Range
- 20.3.8. Charging Type
- 20.3.9. Drive Type
- 20.3.10. Propulsion Type
- 20.3.11. Ownership Model
- 20.3.12. End-use
- 20.3.13. Country
- 20.3.13.1. Germany
- 20.3.13.2. United Kingdom
- 20.3.13.3. France
- 20.3.13.4. Italy
- 20.3.13.5. Spain
- 20.3.13.6. Netherlands
- 20.3.13.7. Nordic Countries
- 20.3.13.8. Poland
- 20.3.13.9. Russia & CIS
- 20.3.13.10. Rest of Europe
- 20.4. Germany Electric Bus Market
- 20.4.1. Country Segmental Analysis
- 20.4.2. Bus Type
- 20.4.3. Battery Type
- 20.4.4. Length
- 20.4.5. Power Output
- 20.4.6. Seating Capacity
- 20.4.7. Speed Range
- 20.4.8. Range
- 20.4.9. Charging Type
- 20.4.10. Drive Type
- 20.4.11. Propulsion Type
- 20.4.12. Ownership Model
- 20.4.13. End-use
- 20.5. United Kingdom Electric Bus Market
- 20.5.1. Country Segmental Analysis
- 20.5.2. Bus Type
- 20.5.3. Battery Type
- 20.5.4. Length
- 20.5.5. Power Output
- 20.5.6. Seating Capacity
- 20.5.7. Speed Range
- 20.5.8. Range
- 20.5.9. Charging Type
- 20.5.10. Drive Type
- 20.5.11. Propulsion Type
- 20.5.12. Ownership Model
- 20.5.13. End-use
- 20.6. France Electric Bus Market
- 20.6.1. Country Segmental Analysis
- 20.6.2. Bus Type
- 20.6.3. Battery Type
- 20.6.4. Length
- 20.6.5. Power Output
- 20.6.6. Seating Capacity
- 20.6.7. Speed Range
- 20.6.8. Range
- 20.6.9. Charging Type
- 20.6.10. Drive Type
- 20.6.11. Propulsion Type
- 20.6.12. Ownership Model
- 20.6.13. End-use
- 20.7. Italy Electric Bus Market
- 20.7.1. Country Segmental Analysis
- 20.7.2. Bus Type
- 20.7.3. Battery Type
- 20.7.4. Length
- 20.7.5. Power Output
- 20.7.6. Seating Capacity
- 20.7.7. Speed Range
- 20.7.8. Range
- 20.7.9. Charging Type
- 20.7.10. Drive Type
- 20.7.11. Propulsion Type
- 20.7.12. Ownership Model
- 20.7.13. End-use
- 20.8. Spain Electric Bus Market
- 20.8.1. Country Segmental Analysis
- 20.8.2. Bus Type
- 20.8.3. Battery Type
- 20.8.4. Length
- 20.8.5. Power Output
- 20.8.6. Seating Capacity
- 20.8.7. Speed Range
- 20.8.8. Range
- 20.8.9. Charging Type
- 20.8.10. Drive Type
- 20.8.11. Propulsion Type
- 20.8.12. Ownership Model
- 20.8.13. End-use
- 20.9. Netherlands Electric Bus Market
- 20.9.1. Country Segmental Analysis
- 20.9.2. Bus Type
- 20.9.3. Battery Type
- 20.9.4. Length
- 20.9.5. Power Output
- 20.9.6. Seating Capacity
- 20.9.7. Speed Range
- 20.9.8. Range
- 20.9.9. Charging Type
- 20.9.10. Drive Type
- 20.9.11. Propulsion Type
- 20.9.12. Ownership Model
- 20.9.13. End-use
- 20.10. Nordic Countries Electric Bus Market
- 20.10.1. Country Segmental Analysis
- 20.10.2. Bus Type
- 20.10.3. Battery Type
- 20.10.4. Length
- 20.10.5. Power Output
- 20.10.6. Seating Capacity
- 20.10.7. Speed Range
- 20.10.8. Range
- 20.10.9. Charging Type
- 20.10.10. Drive Type
- 20.10.11. Propulsion Type
- 20.10.12. Ownership Model
- 20.10.13. End-use
- 20.11. Poland Electric Bus Market
- 20.11.1. Country Segmental Analysis
- 20.11.2. Bus Type
- 20.11.3. Battery Type
- 20.11.4. Length
- 20.11.5. Power Output
- 20.11.6. Seating Capacity
- 20.11.7. Speed Range
- 20.11.8. Range
- 20.11.9. Charging Type
- 20.11.10. Drive Type
- 20.11.11. Propulsion Type
- 20.11.12. Ownership Model
- 20.11.13. End-use
- 20.12. Russia & CIS Electric Bus Market
- 20.12.1. Country Segmental Analysis
- 20.12.2. Bus Type
- 20.12.3. Battery Type
- 20.12.4. Length
- 20.12.5. Power Output
- 20.12.6. Seating Capacity
- 20.12.7. Speed Range
- 20.12.8. Range
- 20.12.9. Charging Type
- 20.12.10. Drive Type
- 20.12.11. Propulsion Type
- 20.12.12. Ownership Model
- 20.12.13. End-use
- 20.13. Rest of Europe Electric Bus Market
- 20.13.1. Country Segmental Analysis
- 20.13.2. Bus Type
- 20.13.3. Battery Type
- 20.13.4. Length
- 20.13.5. Power Output
- 20.13.6. Seating Capacity
- 20.13.7. Speed Range
- 20.13.8. Range
- 20.13.9. Charging Type
- 20.13.10. Drive Type
- 20.13.11. Propulsion Type
- 20.13.12. Ownership Model
- 20.13.13. End-use
- 21. Asia Pacific Electric Bus Market Analysis
- 21.1. Key Segment Analysis
- 21.2. Regional Snapshot
- 21.3. Asia Pacific Electric Bus Market Size (Volume - Thousand Units & Value - US$ Bn), Analysis, and Forecasts, 2021-2035
- 21.3.1. Bus Type
- 21.3.2. Battery Type
- 21.3.3. Length
- 21.3.4. Power Output
- 21.3.5. Seating Capacity
- 21.3.6. Speed Range
- 21.3.7. Range
- 21.3.8. Charging Type
- 21.3.9. Drive Type
- 21.3.10. Propulsion Type
- 21.3.11. Ownership Model
- 21.3.12. End-use
- 21.3.13. Country
- 21.3.13.1. China
- 21.3.13.2. India
- 21.3.13.3. Japan
- 21.3.13.4. South Korea
- 21.3.13.5. Australia and New Zealand
- 21.3.13.6. Indonesia
- 21.3.13.7. Malaysia
- 21.3.13.8. Thailand
- 21.3.13.9. Vietnam
- 21.3.13.10. Rest of Asia Pacific
- 21.4. China Electric Bus Market
- 21.4.1. Country Segmental Analysis
- 21.4.2. Bus Type
- 21.4.3. Battery Type
- 21.4.4. Length
- 21.4.5. Power Output
- 21.4.6. Seating Capacity
- 21.4.7. Speed Range
- 21.4.8. Range
- 21.4.9. Charging Type
- 21.4.10. Drive Type
- 21.4.11. Propulsion Type
- 21.4.12. Ownership Model
- 21.4.13. End-use
- 21.5. India Electric Bus Market
- 21.5.1. Country Segmental Analysis
- 21.5.2. Bus Type
- 21.5.3. Battery Type
- 21.5.4. Length
- 21.5.5. Power Output
- 21.5.6. Seating Capacity
- 21.5.7. Speed Range
- 21.5.8. Range
- 21.5.9. Charging Type
- 21.5.10. Drive Type
- 21.5.11. Propulsion Type
- 21.5.12. Ownership Model
- 21.5.13. End-use
- 21.6. Japan Electric Bus Market
- 21.6.1. Country Segmental Analysis
- 21.6.2. Bus Type
- 21.6.3. Battery Type
- 21.6.4. Length
- 21.6.5. Power Output
- 21.6.6. Seating Capacity
- 21.6.7. Speed Range
- 21.6.8. Range
- 21.6.9. Charging Type
- 21.6.10. Drive Type
- 21.6.11. Propulsion Type
- 21.6.12. Ownership Model
- 21.6.13. End-use
- 21.7. South Korea Electric Bus Market
- 21.7.1. Country Segmental Analysis
- 21.7.2. Bus Type
- 21.7.3. Battery Type
- 21.7.4. Length
- 21.7.5. Power Output
- 21.7.6. Seating Capacity
- 21.7.7. Speed Range
- 21.7.8. Range
- 21.7.9. Charging Type
- 21.7.10. Drive Type
- 21.7.11. Propulsion Type
- 21.7.12. Ownership Model
- 21.7.13. End-use
- 21.8. Australia and New Zealand Electric Bus Market
- 21.8.1. Country Segmental Analysis
- 21.8.2. Bus Type
- 21.8.3. Battery Type
- 21.8.4. Length
- 21.8.5. Power Output
- 21.8.6. Seating Capacity
- 21.8.7. Speed Range
- 21.8.8. Range
- 21.8.9. Charging Type
- 21.8.10. Drive Type
- 21.8.11. Propulsion Type
- 21.8.12. Ownership Model
- 21.8.13. End-use
- 21.9. Indonesia Electric Bus Market
- 21.9.1. Country Segmental Analysis
- 21.9.2. Bus Type
- 21.9.3. Battery Type
- 21.9.4. Length
- 21.9.5. Power Output
- 21.9.6. Seating Capacity
- 21.9.7. Speed Range
- 21.9.8. Range
- 21.9.9. Charging Type
- 21.9.10. Drive Type
- 21.9.11. Propulsion Type
- 21.9.12. Ownership Model
- 21.9.13. End-use
- 21.10. Malaysia Electric Bus Market
- 21.10.1. Country Segmental Analysis
- 21.10.2. Bus Type
- 21.10.3. Battery Type
- 21.10.4. Length
- 21.10.5. Power Output
- 21.10.6. Seating Capacity
- 21.10.7. Speed Range
- 21.10.8. Range
- 21.10.9. Charging Type
- 21.10.10. Drive Type
- 21.10.11. Propulsion Type
- 21.10.12. Ownership Model
- 21.10.13. End-use
- 21.11. Thailand Electric Bus Market
- 21.11.1. Country Segmental Analysis
- 21.11.2. Bus Type
- 21.11.3. Battery Type
- 21.11.4. Length
- 21.11.5. Power Output
- 21.11.6. Seating Capacity
- 21.11.7. Speed Range
- 21.11.8. Range
- 21.11.9. Charging Type
- 21.11.10. Drive Type
- 21.11.11. Propulsion Type
- 21.11.12. Ownership Model
- 21.11.13. End-use
- 21.12. Vietnam Electric Bus Market
- 21.12.1. Country Segmental Analysis
- 21.12.2. Bus Type
- 21.12.3. Battery Type
- 21.12.4. Length
- 21.12.5. Power Output
- 21.12.6. Seating Capacity
- 21.12.7. Speed Range
- 21.12.8. Range
- 21.12.9. Charging Type
- 21.12.10. Drive Type
- 21.12.11. Propulsion Type
- 21.12.12. Ownership Model
- 21.12.13. End-use
- 21.13. Rest of Asia Pacific Electric Bus Market
- 21.13.1. Country Segmental Analysis
- 21.13.2. Bus Type
- 21.13.3. Battery Type
- 21.13.4. Length
- 21.13.5. Power Output
- 21.13.6. Seating Capacity
- 21.13.7. Speed Range
- 21.13.8. Range
- 21.13.9. Charging Type
- 21.13.10. Drive Type
- 21.13.11. Propulsion Type
- 21.13.12. Ownership Model
- 21.13.13. End-use
- 22. Middle East Electric Bus Market Analysis
- 22.1. Key Segment Analysis
- 22.2. Regional Snapshot
- 22.3. Middle East Electric Bus Market Size (Volume - Thousand Units & Value - US$ Bn), Analysis, and Forecasts, 2021-2035
- 22.3.1. Bus Type
- 22.3.2. Battery Type
- 22.3.3. Length
- 22.3.4. Power Output
- 22.3.5. Seating Capacity
- 22.3.6. Speed Range
- 22.3.7. Range
- 22.3.8. Charging Type
- 22.3.9. Drive Type
- 22.3.10. Propulsion Type
- 22.3.11. Ownership Model
- 22.3.12. End-use
- 22.3.13. Country
- 22.3.13.1. Turkey
- 22.3.13.2. UAE
- 22.3.13.3. Saudi Arabia
- 22.3.13.4. Israel
- 22.3.13.5. Rest of Middle East
- 22.4. Turkey Electric Bus Market
- 22.4.1. Country Segmental Analysis
- 22.4.2. Bus Type
- 22.4.3. Battery Type
- 22.4.4. Length
- 22.4.5. Power Output
- 22.4.6. Seating Capacity
- 22.4.7. Speed Range
- 22.4.8. Range
- 22.4.9. Charging Type
- 22.4.10. Drive Type
- 22.4.11. Propulsion Type
- 22.4.12. Ownership Model
- 22.4.13. End-use
- 22.5. UAE Electric Bus Market
- 22.5.1. Country Segmental Analysis
- 22.5.2. Bus Type
- 22.5.3. Battery Type
- 22.5.4. Length
- 22.5.5. Power Output
- 22.5.6. Seating Capacity
- 22.5.7. Speed Range
- 22.5.8. Range
- 22.5.9. Charging Type
- 22.5.10. Drive Type
- 22.5.11. Propulsion Type
- 22.5.12. Ownership Model
- 22.5.13. End-use
- 22.6. Saudi Arabia Electric Bus Market
- 22.6.1. Country Segmental Analysis
- 22.6.2. Bus Type
- 22.6.3. Battery Type
- 22.6.4. Length
- 22.6.5. Power Output
- 22.6.6. Seating Capacity
- 22.6.7. Speed Range
- 22.6.8. Range
- 22.6.9. Charging Type
- 22.6.10. Drive Type
- 22.6.11. Propulsion Type
- 22.6.12. Ownership Model
- 22.6.13. End-use
- 22.7. Israel Electric Bus Market
- 22.7.1. Country Segmental Analysis
- 22.7.2. Bus Type
- 22.7.3. Battery Type
- 22.7.4. Length
- 22.7.5. Power Output
- 22.7.6. Seating Capacity
- 22.7.7. Speed Range
- 22.7.8. Range
- 22.7.9. Charging Type
- 22.7.10. Drive Type
- 22.7.11. Propulsion Type
- 22.7.12. Ownership Model
- 22.7.13. End-use
- 22.8. Rest of Middle East Electric Bus Market
- 22.8.1. Country Segmental Analysis
- 22.8.2. Bus Type
- 22.8.3. Battery Type
- 22.8.4. Length
- 22.8.5. Power Output
- 22.8.6. Seating Capacity
- 22.8.7. Speed Range
- 22.8.8. Range
- 22.8.9. Charging Type
- 22.8.10. Drive Type
- 22.8.11. Propulsion Type
- 22.8.12. Ownership Model
- 22.8.13. End-use
- 23. Africa Electric Bus Market Analysis
- 23.1. Key Segment Analysis
- 23.2. Regional Snapshot
- 23.3. Africa Electric Bus Market Size (Volume - Thousand Units & Value - US$ Bn), Analysis, and Forecasts, 2021-2035
- 23.3.1. Bus Type
- 23.3.2. Battery Type
- 23.3.3. Length
- 23.3.4. Power Output
- 23.3.5. Seating Capacity
- 23.3.6. Speed Range
- 23.3.7. Range
- 23.3.8. Charging Type
- 23.3.9. Drive Type
- 23.3.10. Propulsion Type
- 23.3.11. Ownership Model
- 23.3.12. End-use
- 23.3.13. Country
- 23.3.13.1. South Africa
- 23.3.13.2. Egypt
- 23.3.13.3. Nigeria
- 23.3.13.4. Algeria
- 23.3.13.5. Rest of Africa
- 23.4. South Africa Electric Bus Market
- 23.4.1. Country Segmental Analysis
- 23.4.2. Bus Type
- 23.4.3. Battery Type
- 23.4.4. Length
- 23.4.5. Power Output
- 23.4.6. Seating Capacity
- 23.4.7. Speed Range
- 23.4.8. Range
- 23.4.9. Charging Type
- 23.4.10. Drive Type
- 23.4.11. Propulsion Type
- 23.4.12. Ownership Model
- 23.4.13. End-use
- 23.5. Egypt Electric Bus Market
- 23.5.1. Country Segmental Analysis
- 23.5.2. Bus Type
- 23.5.3. Battery Type
- 23.5.4. Length
- 23.5.5. Power Output
- 23.5.6. Seating Capacity
- 23.5.7. Speed Range
- 23.5.8. Range
- 23.5.9. Charging Type
- 23.5.10. Drive Type
- 23.5.11. Propulsion Type
- 23.5.12. Ownership Model
- 23.5.13. End-use
- 23.6. Nigeria Electric Bus Market
- 23.6.1. Country Segmental Analysis
- 23.6.2. Bus Type
- 23.6.3. Battery Type
- 23.6.4. Length
- 23.6.5. Power Output
- 23.6.6. Seating Capacity
- 23.6.7. Speed Range
- 23.6.8. Range
- 23.6.9. Charging Type
- 23.6.10. Drive Type
- 23.6.11. Propulsion Type
- 23.6.12. Ownership Model
- 23.6.13. End-use
- 23.7. Algeria Electric Bus Market
- 23.7.1. Country Segmental Analysis
- 23.7.2. Bus Type
- 23.7.3. Battery Type
- 23.7.4. Length
- 23.7.5. Power Output
- 23.7.6. Seating Capacity
- 23.7.7. Speed Range
- 23.7.8. Range
- 23.7.9. Charging Type
- 23.7.10. Drive Type
- 23.7.11. Propulsion Type
- 23.7.12. Ownership Model
- 23.7.13. End-use
- 23.8. Rest of Africa Electric Bus Market
- 23.8.1. Country Segmental Analysis
- 23.8.2. Bus Type
- 23.8.3. Battery Type
- 23.8.4. Length
- 23.8.5. Power Output
- 23.8.6. Seating Capacity
- 23.8.7. Speed Range
- 23.8.8. Range
- 23.8.9. Charging Type
- 23.8.10. Drive Type
- 23.8.11. Propulsion Type
- 23.8.12. Ownership Model
- 23.8.13. End-use
- 24. South America Electric Bus Market Analysis
- 24.1. Key Segment Analysis
- 24.2. Regional Snapshot
- 24.3. South America Electric Bus Market Size (Volume - Thousand Units & Value - US$ Bn), Analysis, and Forecasts, 2021-2035
- 24.3.1. Bus Type
- 24.3.2. Battery Type
- 24.3.3. Length
- 24.3.4. Power Output
- 24.3.5. Seating Capacity
- 24.3.6. Speed Range
- 24.3.7. Range
- 24.3.8. Charging Type
- 24.3.9. Drive Type
- 24.3.10. Propulsion Type
- 24.3.11. Ownership Model
- 24.3.12. End-use
- 24.3.13. Country
- 24.3.13.1. Brazil
- 24.3.13.2. Argentina
- 24.3.13.3. Rest of South America
- 24.4. Brazil Electric Bus Market
- 24.4.1. Country Segmental Analysis
- 24.4.2. Bus Type
- 24.4.3. Battery Type
- 24.4.4. Length
- 24.4.5. Power Output
- 24.4.6. Seating Capacity
- 24.4.7. Speed Range
- 24.4.8. Range
- 24.4.9. Charging Type
- 24.4.10. Drive Type
- 24.4.11. Propulsion Type
- 24.4.12. Ownership Model
- 24.4.13. End-use
- 24.5. Argentina Electric Bus Market
- 24.5.1. Country Segmental Analysis
- 24.5.2. Bus Type
- 24.5.3. Battery Type
- 24.5.4. Length
- 24.5.5. Power Output
- 24.5.6. Seating Capacity
- 24.5.7. Speed Range
- 24.5.8. Range
- 24.5.9. Charging Type
- 24.5.10. Drive Type
- 24.5.11. Propulsion Type
- 24.5.12. Ownership Model
- 24.5.13. End-use
- 24.6. Rest of South America Electric Bus Market
- 24.6.1. Country Segmental Analysis
- 24.6.2. Bus Type
- 24.6.3. Battery Type
- 24.6.4. Length
- 24.6.5. Power Output
- 24.6.6. Seating Capacity
- 24.6.7. Speed Range
- 24.6.8. Range
- 24.6.9. Charging Type
- 24.6.10. Drive Type
- 24.6.11. Propulsion Type
- 24.6.12. Ownership Model
- 24.6.13. End-use
- 25. Key Players/ Company Profile
- 25.1. AB Volvo.
- 25.1.1. Company Details/ Overview
- 25.1.2. Company Financials
- 25.1.3. Key Customers and Competitors
- 25.1.4. Business/ Industry Portfolio
- 25.1.5. Product Portfolio/ Specification Details
- 25.1.6. Pricing Data
- 25.1.7. Strategic Overview
- 25.1.8. Recent Developments
- 25.2. Alexander Dennis Limited
- 25.3. Ashok Leyland Limited
- 25.4. BONLUCK
- 25.5. BYD Auto Co., Ltd.
- 25.6. CaetanoBus
- 25.7. CRRC Corporation Limited
- 25.8. Daimler Buses / Mercedes‑Benz
- 25.9. Ebusco
- 25.10. Ebusco B.V.
- 25.11. Erisha Mobility
- 25.12. Gillig LLC
- 25.13. GreenPower Motor Company Inc.
- 25.14. HIGER Bus Company Limited
- 25.15. Hyundai Motor Company
- 25.16. JBM Auto
- 25.17. King Long United Automotive Industry Co., Ltd.
- 25.18. Lion Electric Company
- 25.19. MAN Truck & Bus AG
- 25.20. NFI Group Inc.
- 25.21. Olectra Greentech Limited
- 25.22. PMI Electro Mobility Solutions
- 25.23. Proterra Inc.
- 25.24. Scania AB
- 25.25. Solaris Bus & Coach S.A.
- 25.26. Switch Mobility
- 25.27. Tata Motors Limited
- 25.28. VDL Bus & Coach
- 25.29. Yutong Group
- 25.30. Zhengzhou Yutong Bus Co., Ltd
- 25.31. Zhongtong Bus & Holding Co., Ltd.
- 25.32. Other Key Players
- 25.1. AB Volvo.
Note* - This is just tentative list of players. While providing the report, we will cover more number of players based on their revenue and share for each geography
Research Design
Our research design integrates both demand-side and supply-side analysis through a balanced combination of primary and secondary research methodologies. By utilizing both bottom-up and top-down approaches alongside rigorous data triangulation methods, we deliver robust market intelligence that supports strategic decision-making.
MarketGenics' comprehensive research design framework ensures the delivery of accurate, reliable, and actionable market intelligence. Through the integration of multiple research approaches, rigorous validation processes, and expert analysis, we provide our clients with the insights needed to make informed strategic decisions and capitalize on market opportunities.

MarketGenics leverages a dedicated industry panel of experts and a comprehensive suite of paid databases to effectively collect, consolidate, and analyze market intelligence.
Our approach has consistently proven to be reliable and effective in generating accurate market insights, identifying key industry trends, and uncovering emerging business opportunities.
Through both primary and secondary research, we capture and analyze critical company-level data such as manufacturing footprints, including technical centers, R&D facilities, sales offices, and headquarters.
Our expert panel further enhances our ability to estimate market size for specific brands based on validated field-level intelligence.
Our data mining techniques incorporate both parametric and non-parametric methods, allowing for structured data collection, sorting, processing, and cleaning.
Demand projections are derived from large-scale data sets analyzed through proprietary algorithms, culminating in robust and reliable market sizing.
Research Approach
The bottom-up approach builds market estimates by starting with the smallest addressable market units and systematically aggregating them to create comprehensive market size projections.
This method begins with specific, granular data points and builds upward to create the complete market landscape.
Customer Analysis → Segmental Analysis → Geographical Analysis
The top-down approach starts with the broadest possible market data and systematically narrows it down through a series of filters and assumptions to arrive at specific market segments or opportunities.
This method begins with the big picture and works downward to increasingly specific market slices.
TAM → SAM → SOM


Research Methods
Desk / Secondary Research
While analysing the market, we extensively study secondary sources, directories, and databases to identify and collect information useful for this technical, market-oriented, and commercial report. Secondary sources that we utilize are not only the public sources, but it is a combination of Open Source, Associations, Paid Databases, MG Repository & Knowledgebase, and others.
- Company websites, annual reports, financial reports, broker reports, and investor presentations
- National government documents, statistical databases and reports
- News articles, press releases and web-casts specific to the companies operating in the market, Magazines, reports, and others
- We gather information from commercial data sources for deriving company specific data such as segmental revenue, share for geography, product revenue, and others
- Internal and external proprietary databases (industry-specific), relevant patent, and regulatory databases
- Governing Bodies, Government Organizations
- Relevant Authorities, Country-specific Associations for Industries
We also employ the model mapping approach to estimate the product level market data through the players' product portfolio
Primary Research
Primary research/ interviews is vital in analyzing the market. Most of the cases involves paid primary interviews. Primary sources include primary interviews through e-mail interactions, telephonic interviews, surveys as well as face-to-face interviews with the different stakeholders across the value chain including several industry experts.
| Type of Respondents | Number of Primaries |
|---|---|
| Tier 2/3 Suppliers | ~20 |
| Tier 1 Suppliers | ~25 |
| End-users | ~25 |
| Industry Expert/ Panel/ Consultant | ~30 |
| Total | ~100 |
MG Knowledgebase
• Repository of industry blog, newsletter and case studies
• Online platform covering detailed market reports, and company profiles
Forecasting Factors and Models
Forecasting Factors
- Historical Trends – Past market patterns, cycles, and major events that shaped how markets behave over time. Understanding past trends helps predict future behavior.
- Industry Factors – Specific characteristics of the industry like structure, regulations, and innovation cycles that affect market dynamics.
- Macroeconomic Factors – Economic conditions like GDP growth, inflation, and employment rates that affect how much money people have to spend.
- Demographic Factors – Population characteristics like age, income, and location that determine who can buy your product.
- Technology Factors – How quickly people adopt new technology and how much technology infrastructure exists.
- Regulatory Factors – Government rules, laws, and policies that can help or restrict market growth.
- Competitive Factors – Analyzing competition structure such as degree of competition and bargaining power of buyers and suppliers.
Forecasting Models / Techniques
Multiple Regression Analysis
- Identify and quantify factors that drive market changes
- Statistical modeling to establish relationships between market drivers and outcomes
Time Series Analysis – Seasonal Patterns
- Understand regular cyclical patterns in market demand
- Advanced statistical techniques to separate trend, seasonal, and irregular components
Time Series Analysis – Trend Analysis
- Identify underlying market growth patterns and momentum
- Statistical analysis of historical data to project future trends
Expert Opinion – Expert Interviews
- Gather deep industry insights and contextual understanding
- In-depth interviews with key industry stakeholders
Multi-Scenario Development
- Prepare for uncertainty by modeling different possible futures
- Creating optimistic, pessimistic, and most likely scenarios
Time Series Analysis – Moving Averages
- Sophisticated forecasting for complex time series data
- Auto-regressive integrated moving average models with seasonal components
Econometric Models
- Apply economic theory to market forecasting
- Sophisticated economic models that account for market interactions
Expert Opinion – Delphi Method
- Harness collective wisdom of industry experts
- Structured, multi-round expert consultation process
Monte Carlo Simulation
- Quantify uncertainty and probability distributions
- Thousands of simulations with varying input parameters
Research Analysis
Our research framework is built upon the fundamental principle of validating market intelligence from both demand and supply perspectives. This dual-sided approach ensures comprehensive market understanding and reduces the risk of single-source bias.
Demand-Side Analysis: We understand end-user/application behavior, preferences, and market needs along with the penetration of the product for specific application.
Supply-Side Analysis: We estimate overall market revenue, analyze the segmental share along with industry capacity, competitive landscape, and market structure.
Validation & Evaluation
Data triangulation is a validation technique that uses multiple methods, sources, or perspectives to examine the same research question, thereby increasing the credibility and reliability of research findings. In market research, triangulation serves as a quality assurance mechanism that helps identify and minimize bias, validate assumptions, and ensure accuracy in market estimates.
- Data Source Triangulation – Using multiple data sources to examine the same phenomenon
- Methodological Triangulation – Using multiple research methods to study the same research question
- Investigator Triangulation – Using multiple researchers or analysts to examine the same data
- Theoretical Triangulation – Using multiple theoretical perspectives to interpret the same data

Custom Market Research Services
We will customise the research for you, in case the report listed above does not meet your requirements.
Get 10% Free Customisation