Electric Vehicle Supply Equipment Market Size, Share & Trends Analysis Report by Charging Infrastructure (Public Charging Stations, Private Charging Stations), Charger Type, Power Output, Installation Type, Connectivity, Component, Vehicle Type, Business Model, Voltage Range, End-users and Geography (North America, Europe, Asia Pacific, Middle East, Africa, and South America) – Global Industry Data, Trends, and Forecasts, 2026–2035
|
|
|
Segmental Data Insights |
|
|
Demand Trends |
|
|
Competitive Landscape |
|
|
Strategic Development |
|
|
Future Outlook & Opportunities |
|
Electric Vehicle Supply Equipment Market Size, Share, and Growth
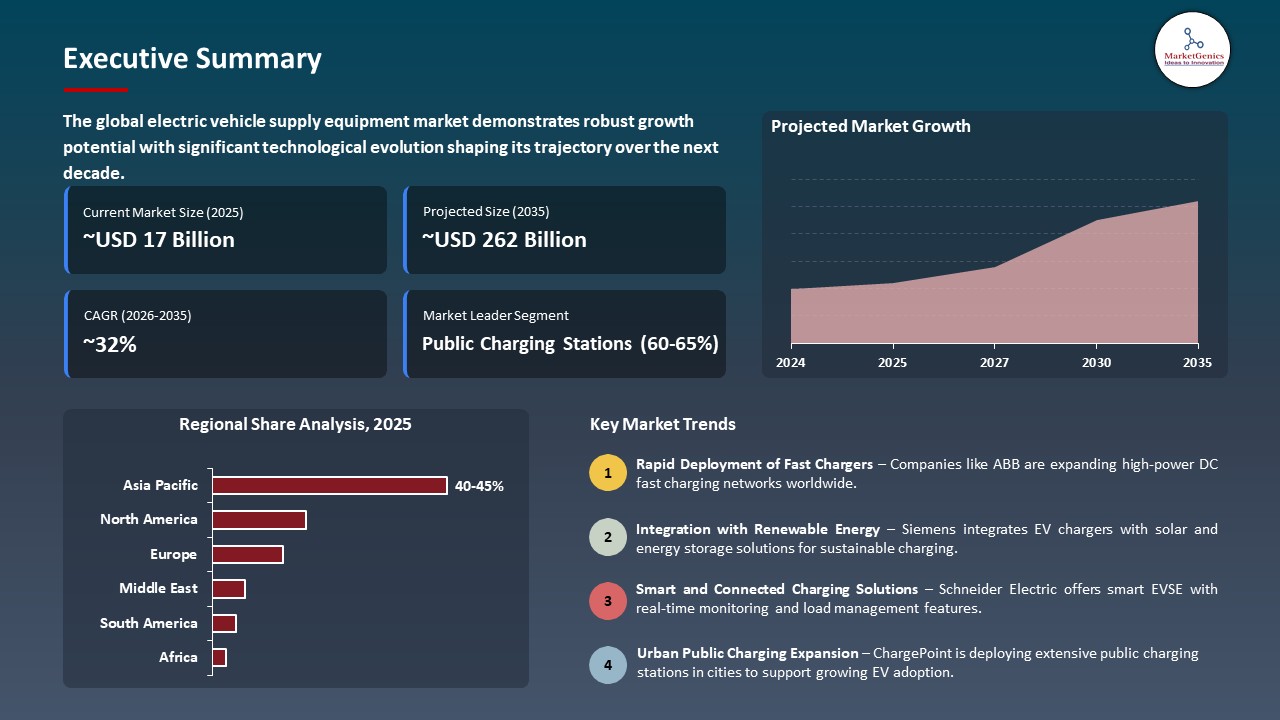
The global electric vehicle supply equipment market is witnessing strong growth, valued at USD 16.8 billion in 2025 and projected to reach USD 261.7 billion by 2035, expanding at a CAGR of 31.6% during the forecast period. North America is the fastest-growing electric vehicle supply equipment market due to rising electric vehicle adoption, supportive federal and state incentives, expansion of fast-charging networks, and increasing investments in smart grid and renewable energy integration for sustainable transportation.
Rick Wilmer, Chief Executive Officer at ChargePoint, said, “ChargePoint believes we have entered the next phase of EV adoption. Nearly 60% of the 19.3 billion electric miles we’ve enabled in nearly 18 years took place over the most recent two years, New EV sales are no longer the primary benchmark for charger demand, it is the total number of EVs on the road. Those installing chargers in 2026 should see accelerated ROI because of this utilization pressure”.
The electric vehicle supply equipment market is picking up with rapid electrification of transportation and enabling regulatory frameworks as governments and other stakeholders invest in scalable, high-power charging infrastructure to provide infrastructure support to rampant EV sales. As an example, to reduce wait times and electrify commercial fleets, in 2025 ABB added next-generation ultra-fast chargers to its Terra Turbo line, able to be used in 360 kW+ output to enable individual chargers to meet the demands of a large population. In early 2025, Tesla also converted its Supercharger system to V4, which provides charging speed up to 350 kW and is more energy efficient, speeding up the adoption of EVs by long-distance travelers.
Smart grid features and dynamic load management are being incorporated by manufacturers such as Siemens and Shell Recharge Solutions in charging stations to maximize energy consumption and reduce peak demand strain on utilities. These programs represent the move by the industry towards interoperable, high-capacity charging networks which meet urban, highway and fleet charging requirements. The increased supply of electric vehicle supply equipment is greatly decreasing the charging barriers, boosting the adoption of the electric vehicles, and changing the automotive energy environment.
The electric vehicle supply equipment market presents adjacent opportunities in renewable energy integration, smart grid solutions, energy storage systems, vehicle-to-grid (V2G) technology, and EV fleet charging services. Expanding these areas allows companies to offer comprehensive energy and mobility solutions. These adjacent markets enhance revenue streams while supporting sustainable transportation growth.
 Electric Vehicle Supply Equipment Market Dynamics and Trends
Driver: Expansion of Ultra‑Fast Charging Infrastructure Reduces EV Charging Time
-
The increase in the number of ultra-fast charging stations is facilitating the growth of the electric vehicle supply equipment market, as it significantly shortens the time taken to charge an EV, and eliminates range anxiety. High-power chargers, provide quick replenishment of passenger and commercial cars, using long-distance journeys and fleet.
- Public and highway installations increase convenience and ease, promoting the wider adoption of EVs and the generation of a long-term demand in advanced charging solutions in both urban and intercity networks.
- Mahindra unveiled the first two locations of its Charge IN ultra-fast EV charging network in India in November 2025, with 180 kW dual-gun chargers that could charge Mahindra eSUVs 20-80 per cent in 20 minutes.
- The growth in ultra-high charging networks is increasing adoption of EVs, prompting long-distance travel, and stimulating the long-term growth of the equipment market of electric vehicle supply.
Restraint: Fragmented Standards and Interoperability Challenges Across Charging Networks
-
The absence of standardized procedures and interoperability among electric vehicle charging networks is a major limiting factor to the electric vehicle supply equipment market. The lack of standardized communication protocols, types of connectors, proprietary software systems are the obstacles to smooth charging experiences of EV users, which confuses and restricts the compatibility of networks.
- The problems related to the use of the various charging networks are the same: fleet operators and individual EV owners may experience problems when attempting to use more than a single network, which results in inefficiencies, lengthy downtimes, and decreased user satisfaction. The ecosystem is also complicated by integration with the payment systems and vehicle management platforms, particularly in those areas where different vendors exist but do not share a unified standard. The difficulties complicate the operation of charging service providers who have to spend significant amounts of money on upgrading hardware and software to be able to be compatible on a larger scale.
- Lack of global standards and harmonized protocols can impede the adoption of public and commercial charging infrastructure, limiting the potential of the electric vehicle supply equipment market.
Opportunity: Growth in Bidirectional Charging and Vehicle‑to‑Grid (V2G) Services
-
The growing use of bidirectional charging and Vehicle-to-Grid (V2G) services is able to place a major opportunity in the electric vehicle supply equipment market where electric vehicles cannot just take power, but also provide it back to the grid.
- The capability has been shown to support grid stability, integration of renewable energy and management of peak loads and provides potential source of revenue to the owners of EVs as a result of energy trading. Increasing attention of utilities and fleet operators to V2G-enabled infrastructure is rapidly increasing investments, making these technologies one of the facilitators of sustainable and resilient energy ecosystems.
- Nuvve Holding Corp. is also moving forward with the U.S. Vehicle-to-Grid (V2G) in 2024 and making EVs capable of supplying energy back to the grid, improving reliability and providing a revenue opportunity to owners. The technology of the company facilitates fleet electrification, peak load management, and sustainable energy integration and makes EVs mobile energy storage units that enhance grid resilience.
- The trend is set to revolutionize the uptake of electric vehicle supply equipment, which will spearhead grid resilience and open up new sources of revenue.
Key Trend: Integration of Smart Charging Platforms with AI‑Driven Load Management
-
AI-based load management Smart charging platforms are emerging as a key trend in the electric vehicle supply equipment market, allowing operators to optimize energy demand among multiple vehicles, charging stations, and grid conditions. They use real-time data, predictive analytics, and adaptive algorithms to streamline charging programs, avoid grid overload, and effectively combine renewable energy sources.
- AI integrated with energy storage systems and smart load management will enable operators to minimize operation costs and increase station availability, user experience, and scalable, sustainable solutions in the entire electric mobility of urban and highway networks.
- In January 2025, Exicom announced its Harmony Boost EV charging system that combines renewable power, smart Battery Energy Storage System (BESS), and high-power distributed chargers with up to 400 kW per plug. The system is intelligent to operate solar power, grid power, fast-charging, reduce range anxiety, and load sharing.
- The adoption of efficient, reliable, and sustainable EV charging infrastructure is increasing, with the integration of AI-enabled smart charging and energy storage accelerating it.
 Electric Vehicle Supply Equipment Market Analysis and Segmental Data
Public Charging Stations Dominate Global Electric Vehicle Supply Equipment Market
-
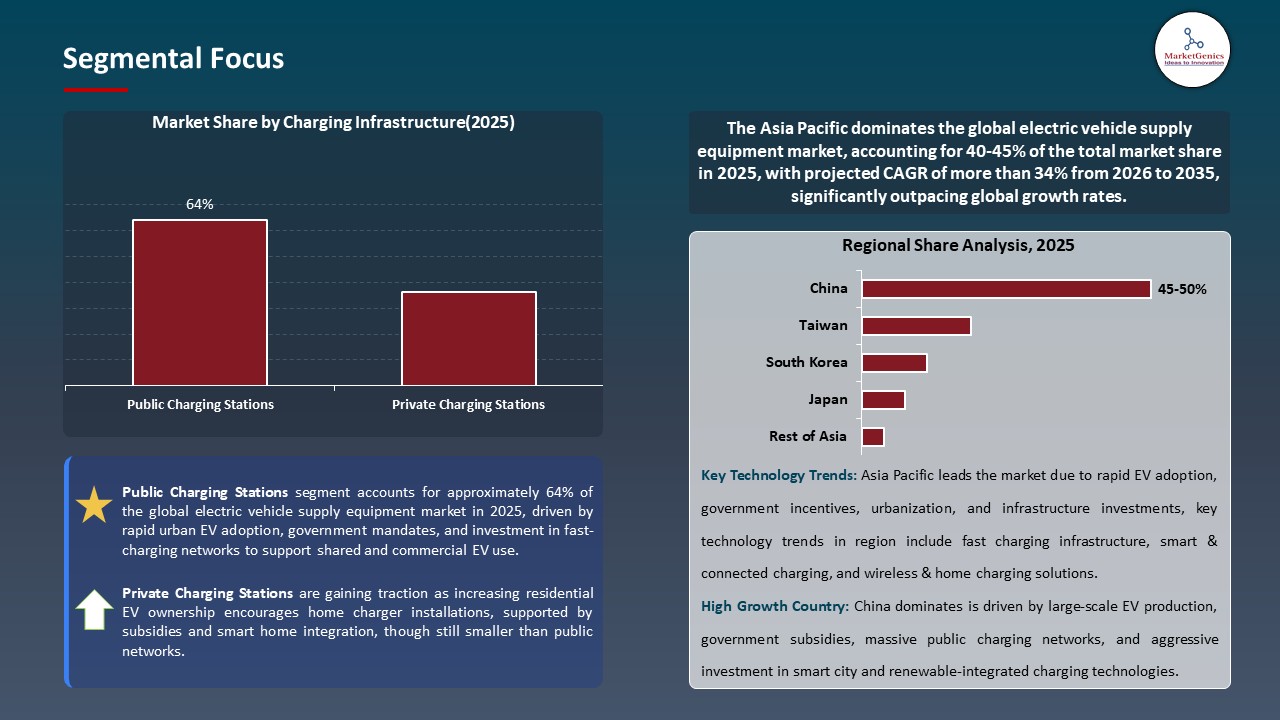
Public charging stations represent the leading segment in the global electric vehicle supply equipment market, accounting for the largest share due to their accessibility, convenience, and ability to support a wide range of electric vehicle types. Governments and private operators are investing heavily in expanding public charging networks across highways, urban centers, and commercial hubs to address growing EV adoption and reduce range anxiety.
- The prevalence of very fast and powerful DC chargers to both passenger and commercial EVs only strengthens this dominance since much less time is spent on charging a vehicle, and operation becomes more effective. The combination with smart grid and mobile applications, and energy management systems will increase user experience and interoperability among various EV brands and charging networks.
- The growth of the public charging system is turning out to be a critical step towards the increased adoption of EVs and the future of sustainable transportation worldwide.
Asia Pacific Leads Global Electric Vehicle Supply Equipment Market Demand
-
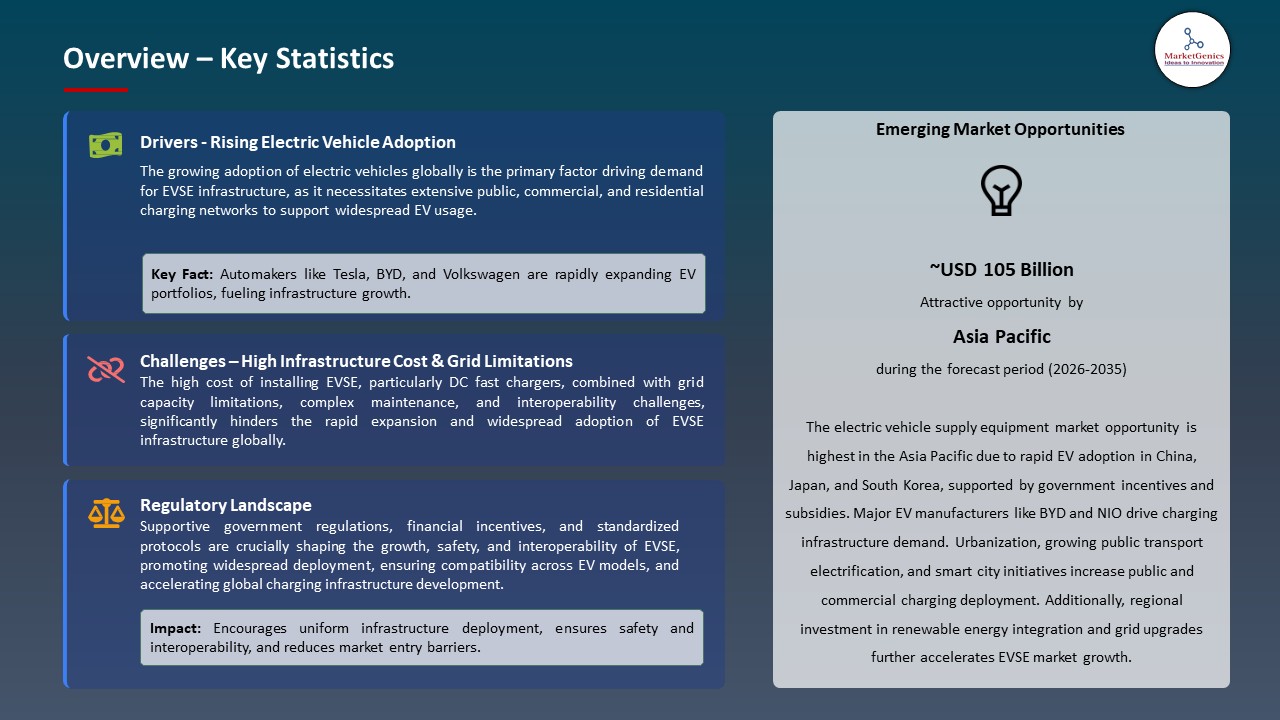
Asia Pacific is leading the global electric vehicle supply equipment market demand due to rapid growth in electric vehicle adoption, government incentives, and extensive investments in charging infrastructure. Countries such as China, India, and Japan are aggressively promoting EV usage through subsidies, tax benefits, and public-private partnerships, driving demand for reliable and scalable charging solutions.
- Both public and private charging networks with high-power DC fast chargers and smart charging networks with renewable energy sources are being deployed on a wide scale in the region. The growth of EVSE infrastructure is also being stimulated by urbanization, the development of e-commerce logistics fleets, and the growth of awareness of sustainable transportation. There is active involvement of manufacturers and energy firms in the development of innovating technologies to support the increasing commercial and consumer demands.
- The elevated EV adoption and infrastructure investment in the Asia Pacific is increasing market development and making it a leading EVSE in the world.
Electric Vehicle Supply Equipment Market Ecosystem
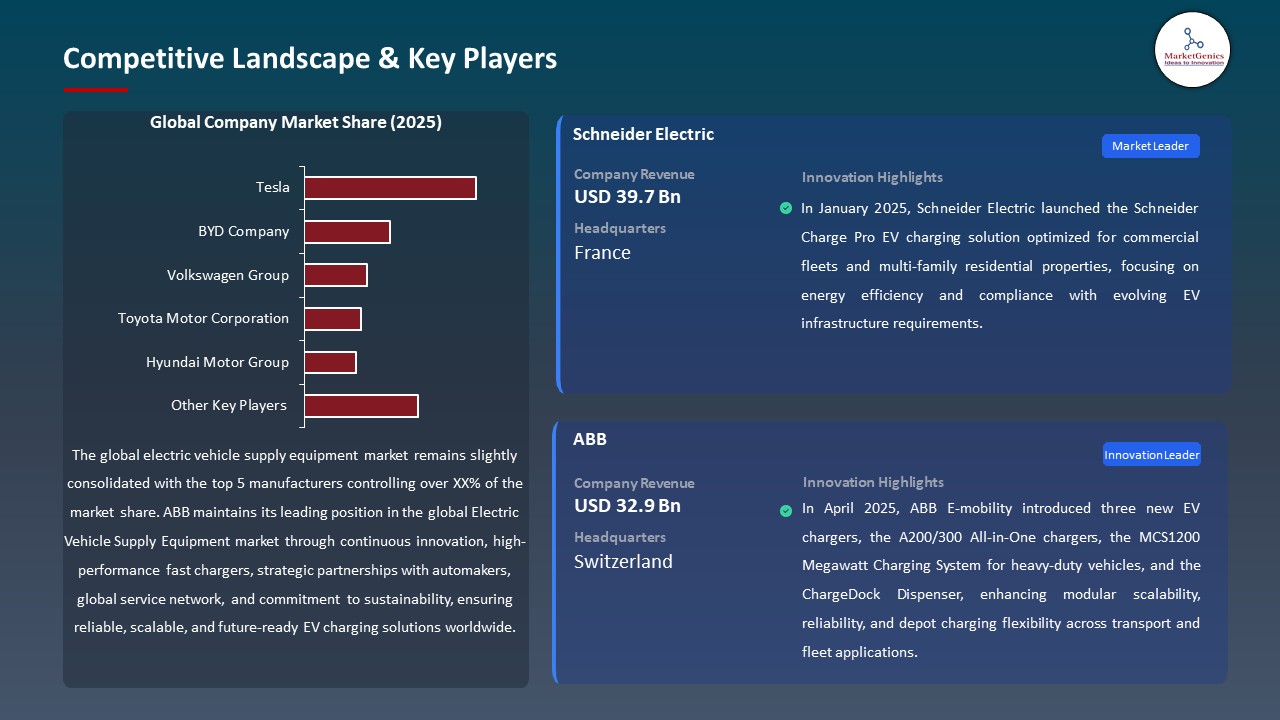
The global electric vehicle supply equipment market is consolidated, with key players including ABB, Tesla, ChargePoint Holdings, Siemens, and Schneider Electric. These firms will continue to have competitive advantages based on superior engineering skills, high-power charging systems, smart grids, and knowledge in software-based energy management systems. Strategic alliances with automotive OEMs, energy suppliers, and government bodies, international networks of services and compliance to high standards of safety and regulations, are further strengths of the company.
The supply equipment market value chain of the electric vehicles includes the design and development of a system, the production of the high-power charging system and software and artificial intelligence, the customization of the smart grid and energy management, the integration of the vehicle and commissioning, as well as the post-deployment support, including the maintenance, over-the-air updates, and user support. These phases are effective to provide efficient charging, competent working and integration of smooth interoperability among different types of vehicles and network.
Entry barriers are high because of huge investments in R&D, technical expertise, high compliance levels, and the necessity to win the trust of OEM. The electric vehicle supply equipment market throughout the world is differentiating, achieving operational efficiency, integrating V2G, and using AI-based energy optimization innovations to expand over the long term.
 Recent Development and Strategic Overview:
-
In November 2025, Uno Minda Ltd. has announced the launch of its Car EV Wall Charger, designed to provide home charging capabilities for electric vehicle owners across India. The wall-mounted unit delivers 7.4kW single-phase charging output at 230V AC and features a Type 2 integrated socket, making it compatible with all Type 2 connector electric vehicles
- In September 2024, Siemens partnered with E.ON to strengthen Europe’s public EV charging network through a two-year framework agreement, providing SICHARGE D high-power chargers and web-based backend services. E.ON also deployed IoT-enabled substations to optimize energy supply. The collaboration supports E.ON’s goal of installing 1,000 new chargers annually, addressing infrastructure shortages and rising EV adoption across Europe.
Report Scope
|
Detail |
|
|
Market Size in 2025 |
USD 16.8 Bn |
|
Market Forecast Value in 2035 |
USD 261.7 Bn |
|
Growth Rate (CAGR) |
31.6% |
|
Forecast Period |
2026 – 2035 |
|
Historical Data Available for |
2021 – 2024 |
|
Market Size Units |
US$ Billion for Value Million Units for Volume |
|
Report Format |
Electronic (PDF) + Excel |
|
North America |
Europe |
Asia Pacific |
Middle East |
Africa |
South America |
|
|
|
|
|
|
|
Companies Covered |
|||||
|
|
|
|
|
|
Electric Vehicle Supply Equipment Market Segmentation and Highlights
|
Segment |
Sub-segment |
|
Electric Vehicle Supply Equipment Market, By Charging Infrastructure |
|
|
Electric Vehicle Supply Equipment Market, By Charger Type |
|
|
Electric Vehicle Supply Equipment Market, By Power Output |
|
|
Electric Vehicle Supply Equipment Market, By Installation Type |
|
|
Electric Vehicle Supply Equipment Market, By Connectivity |
|
|
Electric Vehicle Supply Equipment Market, By Component |
|
|
Electric Vehicle Supply Equipment Market, By Vehicle Type |
|
|
Electric Vehicle Supply Equipment Market, By Business Model |
|
|
Electric Vehicle Supply Equipment Market, By Voltage Range |
|
|
Electric Vehicle Supply Equipment Market, By End-users |
|
Frequently Asked Questions
Table of Contents
- 1. Research Methodology and Assumptions
- 1.1. Definitions
- 1.2. Research Design and Approach
- 1.3. Data Collection Methods
- 1.4. Base Estimates and Calculations
- 1.5. Forecasting Models
- 1.5.1. Key Forecast Factors & Impact Analysis
- 1.6. Secondary Research
- 1.6.1. Open Sources
- 1.6.2. Paid Databases
- 1.6.3. Associations
- 1.7. Primary Research
- 1.7.1. Primary Sources
- 1.7.2. Primary Interviews with Stakeholders across Ecosystem
- 2. Executive Summary
- 2.1. Global Electric Vehicle Supply Equipment Market Outlook
- 2.1.1. Electric Vehicle Supply Equipment Market Size Volume (Million Units) and Value (US$ Bn), and Forecasts, 2021-2035
- 2.1.2. Compounded Annual Growth Rate Analysis
- 2.1.3. Growth Opportunity Analysis
- 2.1.4. Segmental Share Analysis
- 2.1.5. Geographical Share Analysis
- 2.2. Market Analysis and Facts
- 2.3. Supply-Demand Analysis
- 2.4. Competitive Benchmarking
- 2.5. Go-to- Market Strategy
- 2.5.1. Customer/ End-use Industry Assessment
- 2.5.2. Growth Opportunity Data, 2026-2035
- 2.5.2.1. Regional Data
- 2.5.2.2. Country Data
- 2.5.2.3. Segmental Data
- 2.5.3. Identification of Potential Market Spaces
- 2.5.4. GAP Analysis
- 2.5.5. Potential Attractive Price Points
- 2.5.6. Prevailing Market Risks & Challenges
- 2.5.7. Preferred Sales & Marketing Strategies
- 2.5.8. Key Recommendations and Analysis
- 2.5.9. A Way Forward
- 2.1. Global Electric Vehicle Supply Equipment Market Outlook
- 3. Industry Data and Premium Insights
- 3.1. Global Automotive & Transportation Industry Overview, 2025
- 3.1.1. Automotive & Transportation Industry Ecosystem Analysis
- 3.1.2. Key Trends for Automotive & Transportation Industry
- 3.1.3. Regional Distribution for Automotive & Transportation Control Industry
- 3.2. Supplier Customer Data
- 3.3. Technology Roadmap and Developments
- 3.4. Trade Analysis
- 3.4.1. Import & Export Analysis, 2025
- 3.4.2. Top Importing Countries
- 3.4.3. Top Exporting Countries
- 3.5. Trump Tariff Impact Analysis
- 3.5.1. Manufacturer
- 3.5.1.1. Based on the component & Raw material
- 3.5.2. Supply Chain
- 3.5.3. End Consumer
- 3.5.1. Manufacturer
- 3.6. Raw Material Analysis
- 3.1. Global Automotive & Transportation Industry Overview, 2025
- 4. Market Overview
- 4.1. Market Dynamics
- 4.1.1. Drivers
- 4.1.1.1. Rising global electric vehicle adoption.
- 4.1.1.2. Government incentives and charging infrastructure investments.
- 4.1.1.3. Advancements in fast and smart charging technologies.
- 4.1.2. Restraints
- 4.1.2.1. High installation and infrastructure costs.
- 4.1.2.2. Grid capacity and power supply constraints.
- 4.1.1. Drivers
- 4.2. Key Trend Analysis
- 4.3. Regulatory Framework
- 4.3.1. Key Regulations, Norms, and Subsidies, by Key Countries
- 4.3.2. Tariffs and Standards
- 4.3.3. Impact Analysis of Regulations on the Market
- 4.4. Value Chain Analysis
- 4.4.1. Component Suppliers
- 4.4.2. Manufacturers
- 4.4.3. System Integrators
- 4.4.4. Dealers & Channel Partners
- 4.4.5. End Users
- 4.5. Cost Structure Analysis
- 4.5.1. Parameter’s Share for Cost Associated
- 4.5.2. COGP vs COGS
- 4.5.3. Profit Margin Analysis
- 4.6. Pricing Analysis
- 4.6.1. Regional Pricing Analysis
- 4.6.2. Segmental Pricing Trends
- 4.6.3. Factors Influencing Pricing
- 4.7. Porter’s Five Forces Analysis
- 4.8. PESTEL Analysis
- 4.9. Global Electric Vehicle Supply Equipment Market Demand
- 4.9.1. Historical Market Size – Volume (Million Units) and Value (US$ Bn), 2020-2024
- 4.9.2. Current and Future Market Size – Volume (Million Units) and Value (US$ Bn), 2026–2035
- 4.9.2.1. Y-o-Y Growth Trends
- 4.9.2.2. Absolute $ Opportunity Assessment
- 4.1. Market Dynamics
- 5. Competition Landscape
- 5.1. Competition structure
- 5.1.1. Fragmented v/s consolidated
- 5.2. Company Share Analysis, 2025
- 5.2.1. Global Company Market Share
- 5.2.2. By Region
- 5.2.2.1. North America
- 5.2.2.2. Europe
- 5.2.2.3. Asia Pacific
- 5.2.2.4. Middle East
- 5.2.2.5. Africa
- 5.2.2.6. South America
- 5.3. Product Comparison Matrix
- 5.3.1. Specifications
- 5.3.2. Market Positioning
- 5.3.3. Pricing
- 5.1. Competition structure
- 6. Global Electric Vehicle Supply Equipment Market Analysis, by Charging Infrastructure
- 6.1. Key Segment Analysis
- 6.2. Electric Vehicle Supply Equipment Market Size (Volume (Million Units) and Value (US$ Bn)), Analysis, and Forecasts, by Charging Infrastructure, 2021-2035
- 6.2.1. Public Charging Stations
- 6.2.1.1. On-street Charging
- 6.2.1.2. Parking Lot Charging
- 6.2.1.3. Highway Charging Stations
- 6.2.2. Private Charging Stations
- 6.2.2.1. Home Charging
- 6.2.2.2. Workplace Charging
- 6.2.2.3. Fleet Depot Charging
- 6.2.1. Public Charging Stations
- 7. Global Electric Vehicle Supply Equipment Market Analysis, by Charger Type
- 7.1. Key Segment Analysis
- 7.2. Electric Vehicle Supply Equipment Market Size (Volume (Million Units) and Value (US$ Bn)), Analysis, and Forecasts, by Charger Type, 2021-2035
- 7.2.1. AC Chargers
- 7.2.1.1. Level 1 Chargers
- 7.2.1.2. Level 2 Chargers
- 7.2.2. DC Chargers
- 7.2.2.1. CHAdeMO
- 7.2.2.2. CCS (Combined Charging System)
- 7.2.2.3. Tesla Supercharger
- 7.2.2.4. GB/T
- 7.2.1. AC Chargers
- 8. Global Electric Vehicle Supply Equipment Market Analysis, by Power Output
- 8.1. Key Segment Analysis
- 8.2. Electric Vehicle Supply Equipment Market Size (Volume (Million Units) and Value (US$ Bn)), Analysis, and Forecasts, by Power Output, 2021-2035
- 8.2.1. ≤22 kW
- 8.2.2. 22-50 kW
- 8.2.3. 50-150 kW
- 8.2.4. >150 kW
- 9. Global Electric Vehicle Supply Equipment Market Analysis, by Installation Type
- 9.1. Key Segment Analysis
- 9.2. Electric Vehicle Supply Equipment Market Size (Volume (Million Units) and Value (US$ Bn)), Analysis, and Forecasts, by Installation Type, 2021-2035
- 9.2.1. Portable Chargers
- 9.2.2. Fixed Chargers
- 9.2.2.1. Wall-mounted
- 9.2.2.2. Floor-mounted
- 9.2.2.3. Pole-mounted
- 10. Global Electric Vehicle Supply Equipment Market Analysis, by Connectivity
- 10.1. Key Segment Analysis
- 10.2. Electric Vehicle Supply Equipment Market Size (Volume (Million Units) and Value (US$ Bn)), Analysis, and Forecasts, by Connectivity, 2021-2035
- 10.2.1. Non-Networked/Standalone Chargers
- 10.2.2. Networked/Smart Chargers
- 10.2.2.1. Wi-Fi Enabled
- 10.2.2.2. Cellular Enabled
- 10.2.2.3. Bluetooth Enabled
- 10.2.2.4. RFID Enabled
- 11. Global Electric Vehicle Supply Equipment Market Analysis, by Component
- 11.1. Key Segment Analysis
- 11.2. Electric Vehicle Supply Equipment Market Size (Volume (Million Units) and Value (US$ Bn)), Analysis, and Forecasts, by Component, 2021-2035
- 11.2.1. Hardware
- 11.2.1.1. Charging Units
- 11.2.1.2. Connectors/Cables
- 11.2.1.3. Control Panels
- 11.2.1.4. Cooling Systems
- 11.2.1.5. Power Modules
- 11.2.1.6. Others
- 11.2.2. Software
- 11.2.2.1. Charging Management Software
- 11.2.2.2. Payment Processing Systems
- 11.2.2.3. Energy Management Systems
- 11.2.2.4. Mobile Applications
- 11.2.3. Services
- 11.2.1. Hardware
- 12. Global Electric Vehicle Supply Equipment Market Analysis and Forecasts, by Vehicle Type
- 12.1. Key Findings
- 12.2. Electric Vehicle Supply Equipment Market Size (Volume (Million Units) and Value (US$ Bn)), Analysis, and Forecasts, by Vehicle Type, 2021-2035
- 12.2.1. Passenger Cars
- 12.2.1.1. Battery Electric Vehicles (BEV)
- 12.2.1.2. Plug-in Hybrid Electric Vehicles (PHEV)
- 12.2.2. Commercial Vehicles
- 12.2.2.1. Light Commercial Vehicles
- 12.2.2.2. Heavy Commercial Vehicles
- 12.2.2.3. Electric Buses
- 12.2.2.4. Electric Trucks
- 12.2.3. Two-Wheelers & Three-Wheelers
- 12.2.1. Passenger Cars
- 13. Global Electric Vehicle Supply Equipment Market Analysis and Forecasts, by Business Model
- 13.1. Key Findings
- 13.2. Electric Vehicle Supply Equipment Market Size (Volume (Million Units) and Value (US$ Bn)), Analysis, and Forecasts, by Business Model, 2021-2035
- 13.2.1. Business-to-Consumer (B2C)
- 13.2.2. Business-to-Business (B2B)
- 13.2.3. Business-to-Government (B2G)
- 14. Global Electric Vehicle Supply Equipment Market Analysis and Forecasts, by Voltage Range
- 14.1. Key Findings
- 14.2. Electric Vehicle Supply Equipment Market Size (Volume (Million Units) and Value (US$ Bn)), Analysis, and Forecasts, by Voltage Range, 2021-2035
- 14.2.1. <500V
- 14.2.2. 500V-1000V
- 14.2.3. >1000V
- 15. Global Electric Vehicle Supply Equipment Market Analysis and Forecasts, by End-users
- 15.1. Key Findings
- 15.2. Electric Vehicle Supply Equipment Market Size (Volume (Million Units) and Value (US$ Bn)), Analysis, and Forecasts, by End-users, 2021-2035
- 15.2.1. Residential
- 15.2.2. Commercial
- 15.2.3. Transportation & Logistics
- 15.2.4. Institutional
- 15.2.5. Highway & Public Infrastructure
- 15.2.6. Industrial & Manufacturing
- 15.2.7. Utility & Energy Sector
- 15.2.8. Others
- 16. Global Electric Vehicle Supply Equipment Market Analysis and Forecasts, by Region
- 16.1. Key Findings
- 16.2. Electric Vehicle Supply Equipment Market Size (Volume (Million Units) and Value (US$ Bn)), Analysis, and Forecasts, by Region, 2021-2035
- 16.2.1. North America
- 16.2.2. Europe
- 16.2.3. Asia Pacific
- 16.2.4. Middle East
- 16.2.5. Africa
- 16.2.6. South America
- 17. North America Electric Vehicle Supply Equipment Market Analysis
- 17.1. Key Segment Analysis
- 17.2. Regional Snapshot
- 17.3. North America Electric Vehicle Supply Equipment Market Size- Volume (Million Units) and Value (US$ Bn), Analysis, and Forecasts, 2021-2035
- 17.3.1. Charging Infrastructure
- 17.3.2. Charger Type
- 17.3.3. Power Output
- 17.3.4. Installation Type
- 17.3.5. Connectivity
- 17.3.6. Component
- 17.3.7. Vehicle Type
- 17.3.8. Business Model
- 17.3.9. Voltage Range
- 17.3.10. End-users
- 17.3.11. Country
- 17.3.11.1. USA
- 17.3.11.2. Canada
- 17.3.11.3. Mexico
- 17.4. USA Electric Vehicle Supply Equipment Market
- 17.4.1. Country Segmental Analysis
- 17.4.2. Charging Infrastructure
- 17.4.3. Charger Type
- 17.4.4. Power Output
- 17.4.5. Installation Type
- 17.4.6. Connectivity
- 17.4.7. Component
- 17.4.8. Vehicle Type
- 17.4.9. Business Model
- 17.4.10. Voltage Range
- 17.4.11. End-users
- 17.5. Canada Electric Vehicle Supply Equipment Market
- 17.5.1. Country Segmental Analysis
- 17.5.2. Charging Infrastructure
- 17.5.3. Charger Type
- 17.5.4. Power Output
- 17.5.5. Installation Type
- 17.5.6. Connectivity
- 17.5.7. Component
- 17.5.8. Vehicle Type
- 17.5.9. Business Model
- 17.5.10. Voltage Range
- 17.5.11. End-users
- 17.6. Mexico Electric Vehicle Supply Equipment Market
- 17.6.1. Country Segmental Analysis
- 17.6.2. Charging Infrastructure
- 17.6.3. Charger Type
- 17.6.4. Power Output
- 17.6.5. Installation Type
- 17.6.6. Connectivity
- 17.6.7. Component
- 17.6.8. Vehicle Type
- 17.6.9. Business Model
- 17.6.10. Voltage Range
- 17.6.11. End-users
- 18. Europe Electric Vehicle Supply Equipment Market Analysis
- 18.1. Key Segment Analysis
- 18.2. Regional Snapshot
- 18.3. Europe Electric Vehicle Supply Equipment Market Size (Volume (Million Units) and Value (US$ Bn)), Analysis, and Forecasts, 2021-2035
- 18.3.1. Charging Infrastructure
- 18.3.2. Charger Type
- 18.3.3. Power Output
- 18.3.4. Installation Type
- 18.3.5. Connectivity
- 18.3.6. Component
- 18.3.7. Vehicle Type
- 18.3.8. Business Model
- 18.3.9. Voltage Range
- 18.3.10. End-users
- 18.3.11. Country
- 18.3.11.1. Germany
- 18.3.11.2. United Kingdom
- 18.3.11.3. France
- 18.3.11.4. Italy
- 18.3.11.5. Spain
- 18.3.11.6. Netherlands
- 18.3.11.7. Nordic Countries
- 18.3.11.8. Poland
- 18.3.11.9. Russia & CIS
- 18.3.11.10. Rest of Europe
- 18.4. Germany Electric Vehicle Supply Equipment Market
- 18.4.1. Country Segmental Analysis
- 18.4.2. Charging Infrastructure
- 18.4.3. Charger Type
- 18.4.4. Power Output
- 18.4.5. Installation Type
- 18.4.6. Connectivity
- 18.4.7. Component
- 18.4.8. Vehicle Type
- 18.4.9. Business Model
- 18.4.10. Voltage Range
- 18.4.11. End-users
- 18.5. United Kingdom Electric Vehicle Supply Equipment Market
- 18.5.1. Country Segmental Analysis
- 18.5.2. Charging Infrastructure
- 18.5.3. Charger Type
- 18.5.4. Power Output
- 18.5.5. Installation Type
- 18.5.6. Connectivity
- 18.5.7. Component
- 18.5.8. Vehicle Type
- 18.5.9. Business Model
- 18.5.10. Voltage Range
- 18.5.11. End-users
- 18.6. France Electric Vehicle Supply Equipment Market
- 18.6.1. Country Segmental Analysis
- 18.6.2. Charging Infrastructure
- 18.6.3. Charger Type
- 18.6.4. Power Output
- 18.6.5. Installation Type
- 18.6.6. Connectivity
- 18.6.7. Component
- 18.6.8. Vehicle Type
- 18.6.9. Business Model
- 18.6.10. Voltage Range
- 18.6.11. End-users
- 18.7. Italy Electric Vehicle Supply Equipment Market
- 18.7.1. Country Segmental Analysis
- 18.7.2. Charging Infrastructure
- 18.7.3. Charger Type
- 18.7.4. Power Output
- 18.7.5. Installation Type
- 18.7.6. Connectivity
- 18.7.7. Component
- 18.7.8. Vehicle Type
- 18.7.9. Business Model
- 18.7.10. Voltage Range
- 18.7.11. End-users
- 18.8. Spain Electric Vehicle Supply Equipment Market
- 18.8.1. Country Segmental Analysis
- 18.8.2. Charging Infrastructure
- 18.8.3. Charger Type
- 18.8.4. Power Output
- 18.8.5. Installation Type
- 18.8.6. Connectivity
- 18.8.7. Component
- 18.8.8. Vehicle Type
- 18.8.9. Business Model
- 18.8.10. Voltage Range
- 18.8.11. End-users
- 18.9. Netherlands Electric Vehicle Supply Equipment Market
- 18.9.1. Country Segmental Analysis
- 18.9.2. Charging Infrastructure
- 18.9.3. Charger Type
- 18.9.4. Power Output
- 18.9.5. Installation Type
- 18.9.6. Connectivity
- 18.9.7. Component
- 18.9.8. Vehicle Type
- 18.9.9. Business Model
- 18.9.10. Voltage Range
- 18.9.11. End-users
- 18.10. Nordic Countries Electric Vehicle Supply Equipment Market
- 18.10.1. Country Segmental Analysis
- 18.10.2. Charging Infrastructure
- 18.10.3. Charger Type
- 18.10.4. Power Output
- 18.10.5. Installation Type
- 18.10.6. Connectivity
- 18.10.7. Component
- 18.10.8. Vehicle Type
- 18.10.9. Business Model
- 18.10.10. Voltage Range
- 18.10.11. End-users
- 18.11. Poland Electric Vehicle Supply Equipment Market
- 18.11.1. Country Segmental Analysis
- 18.11.2. Charging Infrastructure
- 18.11.3. Charger Type
- 18.11.4. Power Output
- 18.11.5. Installation Type
- 18.11.6. Connectivity
- 18.11.7. Component
- 18.11.8. Vehicle Type
- 18.11.9. Business Model
- 18.11.10. Voltage Range
- 18.11.11. End-users
- 18.12. Russia & CIS Electric Vehicle Supply Equipment Market
- 18.12.1. Country Segmental Analysis
- 18.12.2. Charging Infrastructure
- 18.12.3. Charger Type
- 18.12.4. Power Output
- 18.12.5. Installation Type
- 18.12.6. Connectivity
- 18.12.7. Component
- 18.12.8. Vehicle Type
- 18.12.9. Business Model
- 18.12.10. Voltage Range
- 18.12.11. End-users
- 18.13. Rest of Europe Electric Vehicle Supply Equipment Market
- 18.13.1. Country Segmental Analysis
- 18.13.2. Charging Infrastructure
- 18.13.3. Charger Type
- 18.13.4. Power Output
- 18.13.5. Installation Type
- 18.13.6. Connectivity
- 18.13.7. Component
- 18.13.8. Vehicle Type
- 18.13.9. Business Model
- 18.13.10. Voltage Range
- 18.13.11. End-users
- 19. Asia Pacific Electric Vehicle Supply Equipment Market Analysis
- 19.1. Key Segment Analysis
- 19.2. Regional Snapshot
- 19.3. Asia Pacific Electric Vehicle Supply Equipment Market Size (Volume (Million Units) and Value (US$ Bn)), Analysis, and Forecasts, 2021-2035
- 19.3.1. Charging Infrastructure
- 19.3.2. Charger Type
- 19.3.3. Power Output
- 19.3.4. Installation Type
- 19.3.5. Connectivity
- 19.3.6. Component
- 19.3.7. Vehicle Type
- 19.3.8. Business Model
- 19.3.9. Voltage Range
- 19.3.10. End-users
- 19.3.11. Country
- 19.3.11.1. China
- 19.3.11.2. India
- 19.3.11.3. Japan
- 19.3.11.4. South Korea
- 19.3.11.5. Australia and New Zealand
- 19.3.11.6. Indonesia
- 19.3.11.7. Malaysia
- 19.3.11.8. Thailand
- 19.3.11.9. Vietnam
- 19.3.11.10. Rest of Asia Pacific
- 19.4. China Electric Vehicle Supply Equipment Market
- 19.4.1. Country Segmental Analysis
- 19.4.2. Charging Infrastructure
- 19.4.3. Charger Type
- 19.4.4. Power Output
- 19.4.5. Installation Type
- 19.4.6. Connectivity
- 19.4.7. Component
- 19.4.8. Vehicle Type
- 19.4.9. Business Model
- 19.4.10. Voltage Range
- 19.4.11. End-users
- 19.5. India Electric Vehicle Supply Equipment Market
- 19.5.1. Country Segmental Analysis
- 19.5.2. Charging Infrastructure
- 19.5.3. Charger Type
- 19.5.4. Power Output
- 19.5.5. Installation Type
- 19.5.6. Connectivity
- 19.5.7. Component
- 19.5.8. Vehicle Type
- 19.5.9. Business Model
- 19.5.10. Voltage Range
- 19.5.11. End-users
- 19.6. Japan Electric Vehicle Supply Equipment Market
- 19.6.1. Country Segmental Analysis
- 19.6.2. Charging Infrastructure
- 19.6.3. Charger Type
- 19.6.4. Power Output
- 19.6.5. Installation Type
- 19.6.6. Connectivity
- 19.6.7. Component
- 19.6.8. Vehicle Type
- 19.6.9. Business Model
- 19.6.10. Voltage Range
- 19.6.11. End-users
- 19.7. South Korea Electric Vehicle Supply Equipment Market
- 19.7.1. Country Segmental Analysis
- 19.7.2. Charging Infrastructure
- 19.7.3. Charger Type
- 19.7.4. Power Output
- 19.7.5. Installation Type
- 19.7.6. Connectivity
- 19.7.7. Component
- 19.7.8. Vehicle Type
- 19.7.9. Business Model
- 19.7.10. Voltage Range
- 19.7.11. End-users
- 19.8. Australia and New Zealand Electric Vehicle Supply Equipment Market
- 19.8.1. Country Segmental Analysis
- 19.8.2. Charging Infrastructure
- 19.8.3. Charger Type
- 19.8.4. Power Output
- 19.8.5. Installation Type
- 19.8.6. Connectivity
- 19.8.7. Component
- 19.8.8. Vehicle Type
- 19.8.9. Business Model
- 19.8.10. Voltage Range
- 19.8.11. End-users
- 19.9. Indonesia Electric Vehicle Supply Equipment Market
- 19.9.1. Country Segmental Analysis
- 19.9.2. Charging Infrastructure
- 19.9.3. Charger Type
- 19.9.4. Power Output
- 19.9.5. Installation Type
- 19.9.6. Connectivity
- 19.9.7. Component
- 19.9.8. Vehicle Type
- 19.9.9. Business Model
- 19.9.10. Voltage Range
- 19.9.11. End-users
- 19.10. Malaysia Electric Vehicle Supply Equipment Market
- 19.10.1. Country Segmental Analysis
- 19.10.2. Charging Infrastructure
- 19.10.3. Charger Type
- 19.10.4. Power Output
- 19.10.5. Installation Type
- 19.10.6. Connectivity
- 19.10.7. Component
- 19.10.8. Vehicle Type
- 19.10.9. Business Model
- 19.10.10. Voltage Range
- 19.10.11. End-users
- 19.11. Thailand Electric Vehicle Supply Equipment Market
- 19.11.1. Country Segmental Analysis
- 19.11.2. Charging Infrastructure
- 19.11.3. Charger Type
- 19.11.4. Power Output
- 19.11.5. Installation Type
- 19.11.6. Connectivity
- 19.11.7. Component
- 19.11.8. Vehicle Type
- 19.11.9. Business Model
- 19.11.10. Voltage Range
- 19.11.11. End-users
- 19.12. Vietnam Electric Vehicle Supply Equipment Market
- 19.12.1. Country Segmental Analysis
- 19.12.2. Charging Infrastructure
- 19.12.3. Charger Type
- 19.12.4. Power Output
- 19.12.5. Installation Type
- 19.12.6. Connectivity
- 19.12.7. Component
- 19.12.8. Vehicle Type
- 19.12.9. Business Model
- 19.12.10. Voltage Range
- 19.12.11. End-users
- 19.13. Rest of Asia Pacific Electric Vehicle Supply Equipment Market
- 19.13.1. Country Segmental Analysis
- 19.13.2. Charging Infrastructure
- 19.13.3. Charger Type
- 19.13.4. Power Output
- 19.13.5. Installation Type
- 19.13.6. Connectivity
- 19.13.7. Component
- 19.13.8. Vehicle Type
- 19.13.9. Business Model
- 19.13.10. Voltage Range
- 19.13.11. End-users
- 20. Middle East Electric Vehicle Supply Equipment Market Analysis
- 20.1. Key Segment Analysis
- 20.2. Regional Snapshot
- 20.3. Middle East Electric Vehicle Supply Equipment Market Size (Volume (Million Units) and Value (US$ Bn)), Analysis, and Forecasts, 2021-2035
- 20.3.1. Charging Infrastructure
- 20.3.2. Charger Type
- 20.3.3. Power Output
- 20.3.4. Installation Type
- 20.3.5. Connectivity
- 20.3.6. Component
- 20.3.7. Vehicle Type
- 20.3.8. Business Model
- 20.3.9. Voltage Range
- 20.3.10. End-users
- 20.3.11. Country
- 20.3.11.1. Turkey
- 20.3.11.2. UAE
- 20.3.11.3. Saudi Arabia
- 20.3.11.4. Israel
- 20.3.11.5. Rest of Middle East
- 20.4. Turkey Electric Vehicle Supply Equipment Market
- 20.4.1. Country Segmental Analysis
- 20.4.2. Charging Infrastructure
- 20.4.3. Charger Type
- 20.4.4. Power Output
- 20.4.5. Installation Type
- 20.4.6. Connectivity
- 20.4.7. Component
- 20.4.8. Vehicle Type
- 20.4.9. Business Model
- 20.4.10. Voltage Range
- 20.4.11. End-users
- 20.5. UAE Electric Vehicle Supply Equipment Market
- 20.5.1. Country Segmental Analysis
- 20.5.2. Charging Infrastructure
- 20.5.3. Charger Type
- 20.5.4. Power Output
- 20.5.5. Installation Type
- 20.5.6. Connectivity
- 20.5.7. Component
- 20.5.8. Vehicle Type
- 20.5.9. Business Model
- 20.5.10. Voltage Range
- 20.5.11. End-users
- 20.6. Saudi Arabia Electric Vehicle Supply Equipment Market
- 20.6.1. Country Segmental Analysis
- 20.6.2. Charging Infrastructure
- 20.6.3. Charger Type
- 20.6.4. Power Output
- 20.6.5. Installation Type
- 20.6.6. Connectivity
- 20.6.7. Component
- 20.6.8. Vehicle Type
- 20.6.9. Business Model
- 20.6.10. Voltage Range
- 20.6.11. End-users
- 20.7. Israel Electric Vehicle Supply Equipment Market
- 20.7.1. Country Segmental Analysis
- 20.7.2. Charging Infrastructure
- 20.7.3. Charger Type
- 20.7.4. Power Output
- 20.7.5. Installation Type
- 20.7.6. Connectivity
- 20.7.7. Component
- 20.7.8. Vehicle Type
- 20.7.9. Business Model
- 20.7.10. Voltage Range
- 20.7.11. End-users
- 20.8. Rest of Middle East Electric Vehicle Supply Equipment Market
- 20.8.1. Country Segmental Analysis
- 20.8.2. Charging Infrastructure
- 20.8.3. Charger Type
- 20.8.4. Power Output
- 20.8.5. Installation Type
- 20.8.6. Connectivity
- 20.8.7. Component
- 20.8.8. Vehicle Type
- 20.8.9. Business Model
- 20.8.10. Voltage Range
- 20.8.11. End-users
- 21. Africa Electric Vehicle Supply Equipment Market Analysis
- 21.1. Key Segment Analysis
- 21.2. Regional Snapshot
- 21.3. Africa Electric Vehicle Supply Equipment Market Size (Volume (Million Units) and Value (US$ Bn)), Analysis, and Forecasts, 2021-2035
- 21.3.1. Charging Infrastructure
- 21.3.2. Charger Type
- 21.3.3. Power Output
- 21.3.4. Installation Type
- 21.3.5. Connectivity
- 21.3.6. Component
- 21.3.7. Vehicle Type
- 21.3.8. Business Model
- 21.3.9. Voltage Range
- 21.3.10. End-users
- 21.3.11. Country
- 21.3.11.1. South Africa
- 21.3.11.2. Egypt
- 21.3.11.3. Nigeria
- 21.3.11.4. Algeria
- 21.3.11.5. Rest of Africa
- 21.4. South Africa Electric Vehicle Supply Equipment Market
- 21.4.1. Country Segmental Analysis
- 21.4.2. Charging Infrastructure
- 21.4.3. Charger Type
- 21.4.4. Power Output
- 21.4.5. Installation Type
- 21.4.6. Connectivity
- 21.4.7. Component
- 21.4.8. Vehicle Type
- 21.4.9. Business Model
- 21.4.10. Voltage Range
- 21.4.11. End-users
- 21.5. Egypt Electric Vehicle Supply Equipment Market
- 21.5.1. Country Segmental Analysis
- 21.5.2. Charging Infrastructure
- 21.5.3. Charger Type
- 21.5.4. Power Output
- 21.5.5. Installation Type
- 21.5.6. Connectivity
- 21.5.7. Component
- 21.5.8. Vehicle Type
- 21.5.9. Business Model
- 21.5.10. Voltage Range
- 21.5.11. End-users
- 21.6. Nigeria Electric Vehicle Supply Equipment Market
- 21.6.1. Country Segmental Analysis
- 21.6.2. Charging Infrastructure
- 21.6.3. Charger Type
- 21.6.4. Power Output
- 21.6.5. Installation Type
- 21.6.6. Connectivity
- 21.6.7. Component
- 21.6.8. Vehicle Type
- 21.6.9. Business Model
- 21.6.10. Voltage Range
- 21.6.11. End-users
- 21.7. Algeria Electric Vehicle Supply Equipment Market
- 21.7.1. Country Segmental Analysis
- 21.7.2. Charging Infrastructure
- 21.7.3. Charger Type
- 21.7.4. Power Output
- 21.7.5. Installation Type
- 21.7.6. Connectivity
- 21.7.7. Component
- 21.7.8. Vehicle Type
- 21.7.9. Business Model
- 21.7.10. Voltage Range
- 21.7.11. End-users
- 21.8. Rest of Africa Electric Vehicle Supply Equipment Market
- 21.8.1. Country Segmental Analysis
- 21.8.2. Charging Infrastructure
- 21.8.3. Charger Type
- 21.8.4. Power Output
- 21.8.5. Installation Type
- 21.8.6. Connectivity
- 21.8.7. Component
- 21.8.8. Vehicle Type
- 21.8.9. Business Model
- 21.8.10. Voltage Range
- 21.8.11. End-users
- 22. South America Electric Vehicle Supply Equipment Market Analysis
- 22.1. Key Segment Analysis
- 22.2. Regional Snapshot
- 22.3. South America Electric Vehicle Supply Equipment Market Size (Volume (Million Units) and Value (US$ Bn)), Analysis, and Forecasts, 2021-2035
- 22.3.1. Charging Infrastructure
- 22.3.2. Charger Type
- 22.3.3. Power Output
- 22.3.4. Installation Type
- 22.3.5. Connectivity
- 22.3.6. Component
- 22.3.7. Vehicle Type
- 22.3.8. Business Model
- 22.3.9. Voltage Range
- 22.3.10. End-users
- 22.3.11. Country
- 22.3.11.1. Brazil
- 22.3.11.2. Argentina
- 22.3.11.3. Rest of South America
- 22.4. Brazil Electric Vehicle Supply Equipment Market
- 22.4.1. Country Segmental Analysis
- 22.4.2. Charging Infrastructure
- 22.4.3. Charger Type
- 22.4.4. Power Output
- 22.4.5. Installation Type
- 22.4.6. Connectivity
- 22.4.7. Component
- 22.4.8. Vehicle Type
- 22.4.9. Business Model
- 22.4.10. Voltage Range
- 22.4.11. End-users
- 22.5. Argentina Electric Vehicle Supply Equipment Market
- 22.5.1. Country Segmental Analysis
- 22.5.2. Charging Infrastructure
- 22.5.3. Charger Type
- 22.5.4. Power Output
- 22.5.5. Installation Type
- 22.5.6. Connectivity
- 22.5.7. Component
- 22.5.8. Vehicle Type
- 22.5.9. Business Model
- 22.5.10. Voltage Range
- 22.5.11. End-users
- 22.6. Rest of South America Electric Vehicle Supply Equipment Market
- 22.6.1. Country Segmental Analysis
- 22.6.2. Charging Infrastructure
- 22.6.3. Charger Type
- 22.6.4. Power Output
- 22.6.5. Installation Type
- 22.6.6. Connectivity
- 22.6.7. Component
- 22.6.8. Vehicle Type
- 22.6.9. Business Model
- 22.6.10. Voltage Range
- 22.6.11. End-users
- 23. Key Players/ Company Profile
- 23.1. ABB
- 23.1.1. Company Details/ Overview
- 23.1.2. Company Financials
- 23.1.3. Key Customers and Competitors
- 23.1.4. Business/ Industry Portfolio
- 23.1.5. Product Portfolio/ Specification Details
- 23.1.6. Pricing Data
- 23.1.7. Strategic Overview
- 23.1.8. Recent Developments
- 23.2. Alpitronic
- 23.3. Blink Charging
- 23.4. BTC Power
- 23.5. ChargePoint Holdings
- 23.6. Circontrol
- 23.7. Clipper Creek
- 23.8. Delta Electronics
- 23.9. Eaton Corporation
- 23.10. Efacec Electric Mobility
- 23.11. Engie EV Solutions
- 23.12. EVBox
- 23.13. EVSE
- 23.14. Ingeteam
- 23.15. Kempower
- 23.16. Leviton Manufacturing
- 23.17. Phihong Technology
- 23.18. Schneider Electric
- 23.19. Siemens
- 23.20. Tesla
- 23.21. Tritium
- 23.22. Wallbox
- 23.23. Webasto
- 23.24. Other Key Players
- 23.1. ABB
Note* - This is just tentative list of players. While providing the report, we will cover more number of players based on their revenue and share for each geography
Research Design
Our research design integrates both demand-side and supply-side analysis through a balanced combination of primary and secondary research methodologies. By utilizing both bottom-up and top-down approaches alongside rigorous data triangulation methods, we deliver robust market intelligence that supports strategic decision-making.
MarketGenics' comprehensive research design framework ensures the delivery of accurate, reliable, and actionable market intelligence. Through the integration of multiple research approaches, rigorous validation processes, and expert analysis, we provide our clients with the insights needed to make informed strategic decisions and capitalize on market opportunities.

MarketGenics leverages a dedicated industry panel of experts and a comprehensive suite of paid databases to effectively collect, consolidate, and analyze market intelligence.
Our approach has consistently proven to be reliable and effective in generating accurate market insights, identifying key industry trends, and uncovering emerging business opportunities.
Through both primary and secondary research, we capture and analyze critical company-level data such as manufacturing footprints, including technical centers, R&D facilities, sales offices, and headquarters.
Our expert panel further enhances our ability to estimate market size for specific brands based on validated field-level intelligence.
Our data mining techniques incorporate both parametric and non-parametric methods, allowing for structured data collection, sorting, processing, and cleaning.
Demand projections are derived from large-scale data sets analyzed through proprietary algorithms, culminating in robust and reliable market sizing.
Research Approach
The bottom-up approach builds market estimates by starting with the smallest addressable market units and systematically aggregating them to create comprehensive market size projections.
This method begins with specific, granular data points and builds upward to create the complete market landscape.
Customer Analysis → Segmental Analysis → Geographical Analysis
The top-down approach starts with the broadest possible market data and systematically narrows it down through a series of filters and assumptions to arrive at specific market segments or opportunities.
This method begins with the big picture and works downward to increasingly specific market slices.
TAM → SAM → SOM


Research Methods
Desk / Secondary Research
While analysing the market, we extensively study secondary sources, directories, and databases to identify and collect information useful for this technical, market-oriented, and commercial report. Secondary sources that we utilize are not only the public sources, but it is a combination of Open Source, Associations, Paid Databases, MG Repository & Knowledgebase, and others.
- Company websites, annual reports, financial reports, broker reports, and investor presentations
- National government documents, statistical databases and reports
- News articles, press releases and web-casts specific to the companies operating in the market, Magazines, reports, and others
- We gather information from commercial data sources for deriving company specific data such as segmental revenue, share for geography, product revenue, and others
- Internal and external proprietary databases (industry-specific), relevant patent, and regulatory databases
- Governing Bodies, Government Organizations
- Relevant Authorities, Country-specific Associations for Industries
We also employ the model mapping approach to estimate the product level market data through the players' product portfolio
Primary Research
Primary research/ interviews is vital in analyzing the market. Most of the cases involves paid primary interviews. Primary sources include primary interviews through e-mail interactions, telephonic interviews, surveys as well as face-to-face interviews with the different stakeholders across the value chain including several industry experts.
| Type of Respondents | Number of Primaries |
|---|---|
| Tier 2/3 Suppliers | ~20 |
| Tier 1 Suppliers | ~25 |
| End-users | ~25 |
| Industry Expert/ Panel/ Consultant | ~30 |
| Total | ~100 |
MG Knowledgebase
• Repository of industry blog, newsletter and case studies
• Online platform covering detailed market reports, and company profiles
Forecasting Factors and Models
Forecasting Factors
- Historical Trends – Past market patterns, cycles, and major events that shaped how markets behave over time. Understanding past trends helps predict future behavior.
- Industry Factors – Specific characteristics of the industry like structure, regulations, and innovation cycles that affect market dynamics.
- Macroeconomic Factors – Economic conditions like GDP growth, inflation, and employment rates that affect how much money people have to spend.
- Demographic Factors – Population characteristics like age, income, and location that determine who can buy your product.
- Technology Factors – How quickly people adopt new technology and how much technology infrastructure exists.
- Regulatory Factors – Government rules, laws, and policies that can help or restrict market growth.
- Competitive Factors – Analyzing competition structure such as degree of competition and bargaining power of buyers and suppliers.
Forecasting Models / Techniques
Multiple Regression Analysis
- Identify and quantify factors that drive market changes
- Statistical modeling to establish relationships between market drivers and outcomes
Time Series Analysis – Seasonal Patterns
- Understand regular cyclical patterns in market demand
- Advanced statistical techniques to separate trend, seasonal, and irregular components
Time Series Analysis – Trend Analysis
- Identify underlying market growth patterns and momentum
- Statistical analysis of historical data to project future trends
Expert Opinion – Expert Interviews
- Gather deep industry insights and contextual understanding
- In-depth interviews with key industry stakeholders
Multi-Scenario Development
- Prepare for uncertainty by modeling different possible futures
- Creating optimistic, pessimistic, and most likely scenarios
Time Series Analysis – Moving Averages
- Sophisticated forecasting for complex time series data
- Auto-regressive integrated moving average models with seasonal components
Econometric Models
- Apply economic theory to market forecasting
- Sophisticated economic models that account for market interactions
Expert Opinion – Delphi Method
- Harness collective wisdom of industry experts
- Structured, multi-round expert consultation process
Monte Carlo Simulation
- Quantify uncertainty and probability distributions
- Thousands of simulations with varying input parameters
Research Analysis
Our research framework is built upon the fundamental principle of validating market intelligence from both demand and supply perspectives. This dual-sided approach ensures comprehensive market understanding and reduces the risk of single-source bias.
Demand-Side Analysis: We understand end-user/application behavior, preferences, and market needs along with the penetration of the product for specific application.
Supply-Side Analysis: We estimate overall market revenue, analyze the segmental share along with industry capacity, competitive landscape, and market structure.
Validation & Evaluation
Data triangulation is a validation technique that uses multiple methods, sources, or perspectives to examine the same research question, thereby increasing the credibility and reliability of research findings. In market research, triangulation serves as a quality assurance mechanism that helps identify and minimize bias, validate assumptions, and ensure accuracy in market estimates.
- Data Source Triangulation – Using multiple data sources to examine the same phenomenon
- Methodological Triangulation – Using multiple research methods to study the same research question
- Investigator Triangulation – Using multiple researchers or analysts to examine the same data
- Theoretical Triangulation – Using multiple theoretical perspectives to interpret the same data

Custom Market Research Services
We will customise the research for you, in case the report listed above does not meet your requirements.
Get 10% Free Customisation