Extreme Ultraviolet (EUV) Lithography Equipment Market Size, Share & Trends Analysis Report by Technology Type (EUV Scanner Generation, Light Source Type), Wavelength, Rated Capacity (Wafers Per Hour), Node Technology, Overlay Accuracy, System Configuration, System Integration Level, Application, and Geography (North America, Europe, Asia Pacific, Middle East, Africa, and South America) – Global Industry Data, Trends, and Forecasts, 2026 – 2035
|
Market Structure & Evolution |
|
|
Segmental Data Insights |
|
|
Demand Trends |
|
|
Competitive Landscape |
|
|
Strategic Development |
|
|
Future Outlook & Opportunities |
|
Extreme-Ultraviolet-(EUV)-Lithography-Equipment-Market Size, Share, and Growth
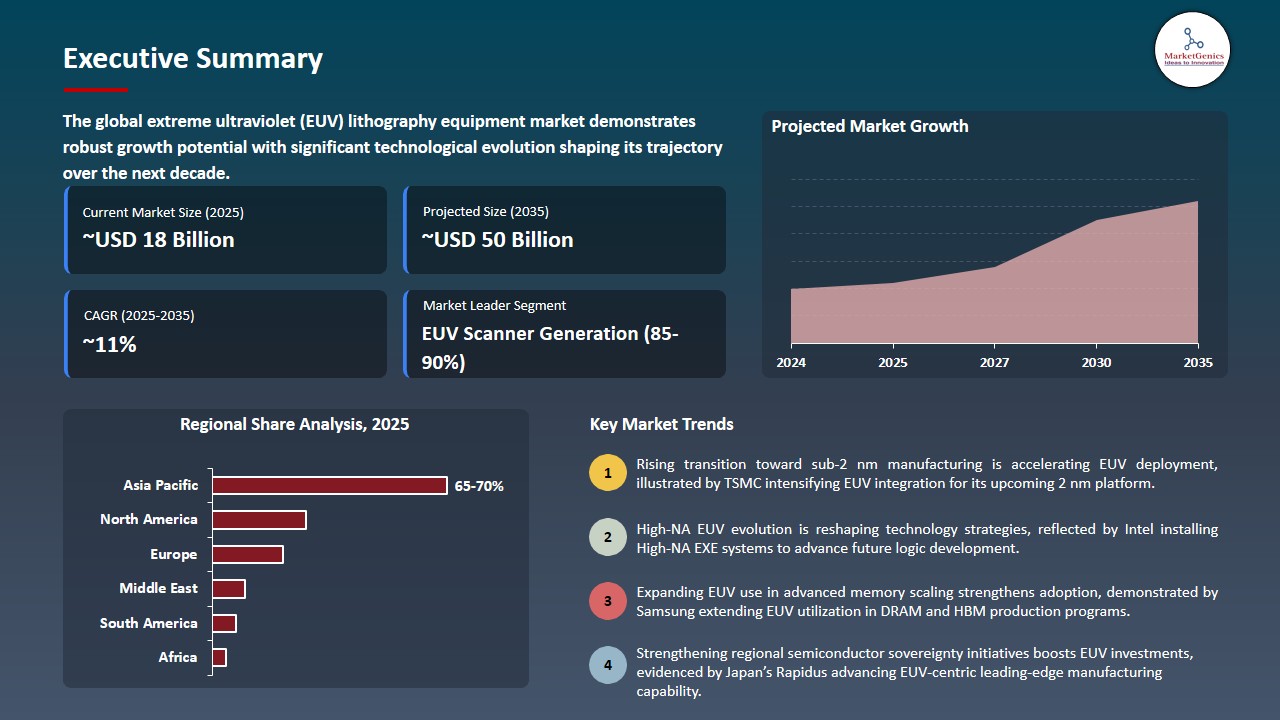
The global extreme ultraviolet (EUV) lithography equipment market is experiencing robust growth, with its estimated value of USD 17.9 billion in the year 2025 and USD 50.4 billion by the period 2035, registering a CAGR of 10.9% during the forecast period.
“High-NA is the logical next step for EUV, as it circumvents complex and expensive 0.33 NA EUV multiple patterning. High-NA EUV is a robust way for chips to scale all the way down to the sub-3 nanometre logic node in a single exposure with high productivity and reduced cost per feature. That is several generations from where we are today and underlines our commitment to propel Moore’s law,” — Martin van den Brink, President and Chief Technology Officer at ASML”
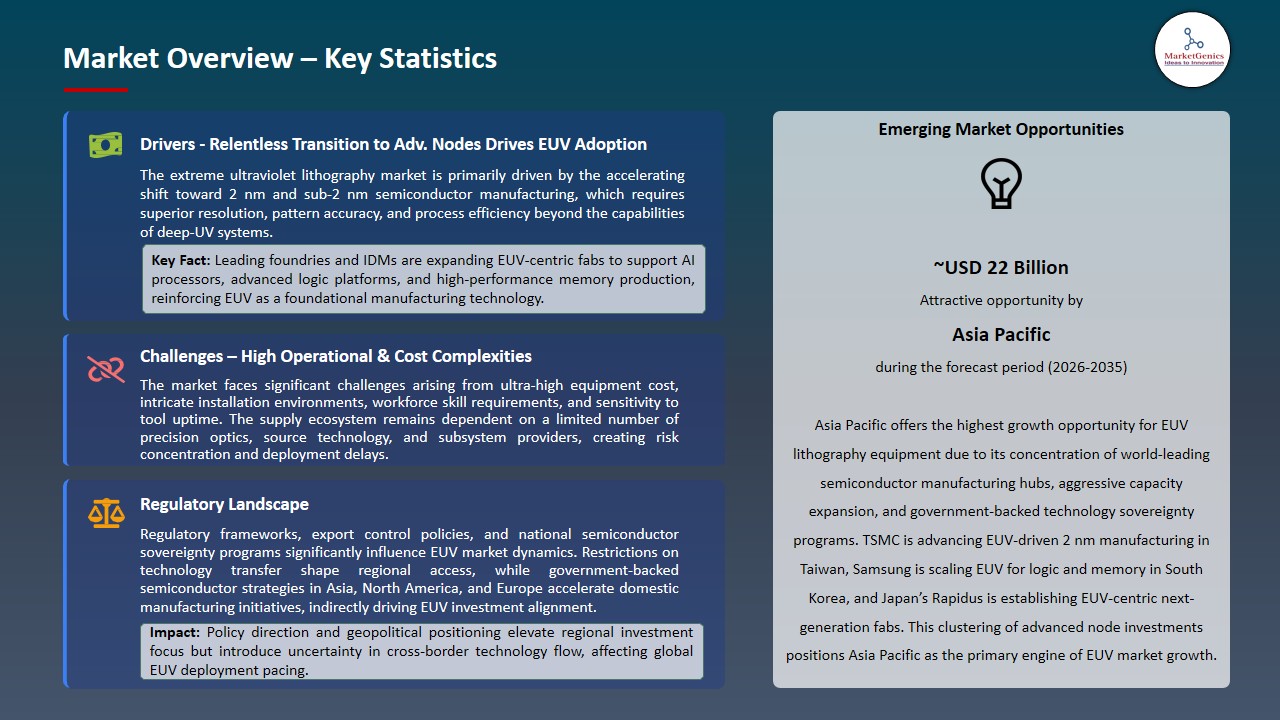
Escalating demand for advanced process nodes in logic and memory manufacturing, especially at 3 nm and below, is driving aggressive deployment of EUV lithography equipment, as foundries and IDMs seek tighter linewidth control, higher pattern fidelity, and reduced multi-patterning complexity. ASML, the sole EUV tool supplier, is expanding capacity for its Twinscan NXE and next-generation EXE high-NA platforms, with recent announcements highlighting shipment plans of EXE:5200 systems to leading chipmakers for sub-2 nm production ramps.
Major customers such as TSMC and Intel have disclosed multi-billion-dollar EUV-centric capex for new fabs in the US, Europe, and Asia focused on 2 nm and 1.8 nm nodes, while Samsung Foundry is increasing EUV tool orders to support its Gate-All-Around roadmap and advanced DRAM scaling. Overall, accelerating node migration, national semiconductor industrial policies, and concentrated investments by top foundries are set to sustain robust growth for the EUV lithography equipment market.
Opportunities adjacent to the extreme ultraviolet lithography equipment market include High-NA EUV optics and components, advanced resists and photo-materials tailored for shrinking nodes, EUV mask blanks and pellicles, EUV-integrated metrology and inspection systems, and fab infrastructure upgrades such as power, vacuum, and contamination-control solutions that enable reliable high-volume EUV production.
Extreme Ultraviolet (EUV) Lithography Equipment Market Dynamics and Trends
Driver: AI and HPC workloads accelerate EUV adoption across global foundries
- Rising demand for AI accelerators, data-center processors, and high-bandwidth memory is compelling foundries to prioritize EUV-based nodes to deliver density, bandwidth, and energy-efficiency improvements that cannot be achieved economically with deep-UV multi-patterning.
- For instance, in October 2025, Samsung’s strategic partnership with OpenAI to support the “Stargate” AI infrastructure, with projected demand of up to 900,000 DRAM wafers per month, underscores how advanced memory and logic scaling will depend increasingly on EUV-enabled process technologies to sustain bit growth and power efficiency.
- Similarly, in December 2025, Intel’s demonstrated extreme multi-chiplet packages combining advanced logic tiles with HBM5 at future 14A/18A processes further reflects that leading-edge packaging roadmaps presume continued EUV-based scaling for critical layers in both logic and memory.
- Intensifying AI and HPC compute requirements are set to structurally reinforce EUV tool demand across the leading foundry and IDM ecosystem over the medium term.
Restraint: High equipment cost and complexity constrain broader EUV tool deployments
- The extremely high capital intensity and engineering complexity of EUV platforms continue to limit their diffusion beyond a small group of tier-one chipmakers. For instance, ASML’s latest EUV scanners are reported to cost around US$300–350 million per unit, weigh roughly 200 tons, and require intricate global supply chains for optics, light sources, and vacuum subsystems, making fab integration and service support uniquely challenging.
- High-NA EUV tools are even more expensive, with TSMC publicly highlighting a near US$400 million price tag as a key reason for delaying adoption at its upcoming A14 and A16 nodes while it continues to extract value from existing low-NA EUV lines. Memory players such as Samsung and SK hynix have also reportedly pushed out High-NA adoption in DRAM due to cost and architectural shifts, slowing incremental tool demand.
- Persistently elevated system cost and complexity temper near-term EUV penetration and lengthen payback periods for new fabs.
Opportunity: Growing DRAM and NAND scaling requirements create new EUV adjacencies
- Continuous bit growth in HBM, graphics DRAM, and high-performance mobile memory is opening fresh application space for EUV beyond leading-edge logic. Samsung’s roadmap toward its 6th-generation 10 nm-class 1c DRAM for HBM4 in 2025, followed by 1d and ultimately sub-10 nm “0a” DRAM by 2027, illustrates how future DRAM shrinks will increasingly require EUV-enabled patterning to manage cell size, capacitance, and variability at acceptable cost and yield.
- In parallel, Samsung’s role as strategic memory supplier to OpenAI’s global AI infrastructure project indicates rapidly scaling demand for advanced DRAM wafers, which is likely to intensify the need for EUV-based capacity in both mainstream DRAM and HBM lines over the coming years. Opportunities also extend to 3D NAND peripheral circuitry and controller ICs fabricated on EUV nodes, strengthening the equipment pull from storage markets.
- Expanding memory and storage use cases broaden EUV’s revenue base beyond core logic foundry segments.
Key Trend: Transition toward High-NA EUV platforms reshapes lithography technology roadmaps globally
- The progressive shift from low-NA to High-NA EUV is emerging as a defining structural trend in advanced lithography strategies. ASML shipped its first High-NA EXE:5000 system modules to Intel for R&D in Oregon, marking the start of sub-2 nm process exploration. In December 2025, Intel installed the first commercial High-NA EXE:5200B tool, targeting 14A node development and positioning High-NA as a cornerstone of its effort to regain process leadership.
- Similarly, TSMC is scheduled to receive High-NA equipment and is evaluating optimal insertion nodes, balancing capability against cost and maturity, while Samsung plans to introduce its first High-NA EUV machine around 2025 for R&D ahead of 1.4 nm foundry and future memory applications. This staggered but coordinated transition is already influencing capex timing, process roadmaps, and supplier collaboration models.
- Gradual High-NA adoption is set to create a new premium segment within the EUV equipment market, enhancing long-term growth but increasing cyclicality and customer concentration risk.
Extreme-Ultraviolet-Lithography-Equipment-Market Analysis and Segmental Data
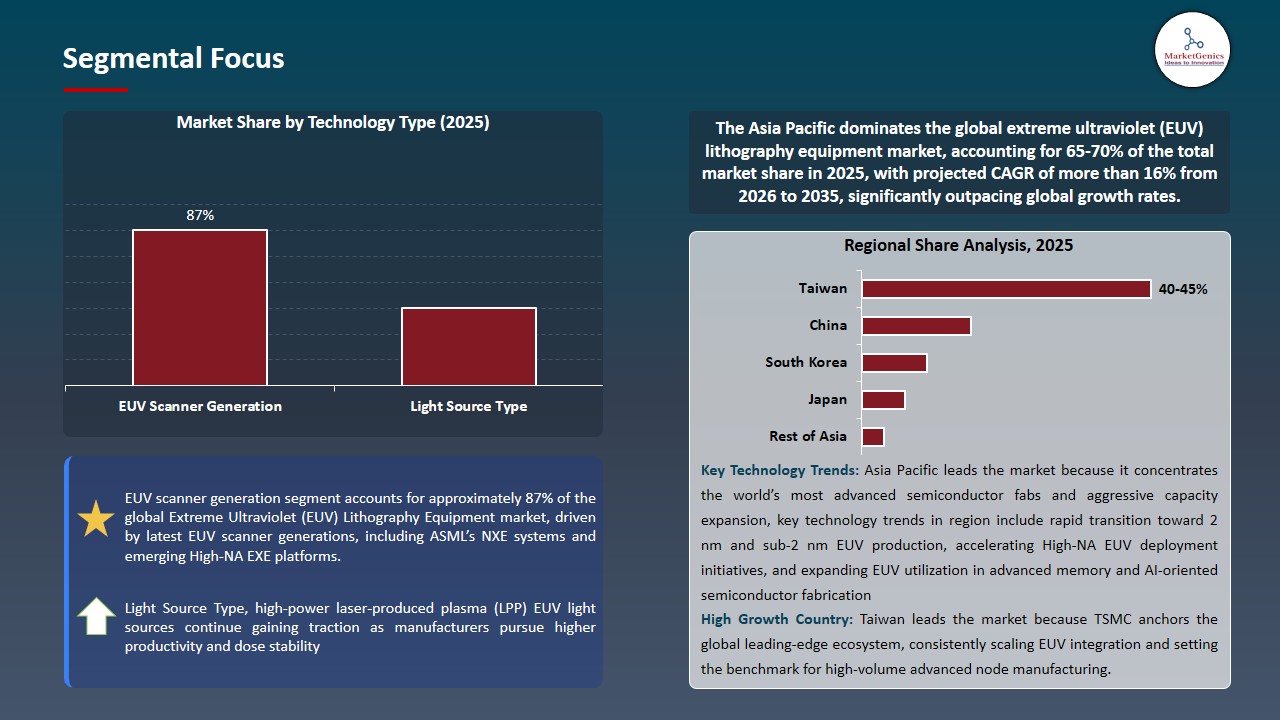
Relentless Technology Migration Makes EUV Scanners the Core Growth Engine
- Demand for EUV scanner generation is strongest within the technology type segment because leading chipmakers are rapidly migrating toward 2 nm and sub-2 nm manufacturing, where precise pattern fidelity, reduced process complexity, and higher throughput are essential. ASML’s continued ramp-up of its NXE and EXE series scanners, along with capacity expansion plans, underscores how the latest scanner generations have become indispensable for advanced node progression.
- The momentum is reinforced by major foundries’ technology roadmaps, with Intel installing High-NA EXE:5200 systems and initiating early production development, while TSMC and Samsung prepare new fabs and announce EUV-centric node rollouts for upcoming logic and memory generations. These developments validate EUV scanners as the technological backbone for next-generation semiconductor scaling.
- Intensified migration to advanced nodes ensures sustained leadership and rapid expansion of the EUV scanner generation segment in the global market.
Asia Pacific Strengthens Leadership as the Core Hub of EUV Deployment
- Asia Pacific records the highest demand for extreme ultraviolet lithography equipment as the region hosts the world’s most advanced semiconductor manufacturing hubs and capacity expansions. TSMC’s aggressive 2 nm deployment roadmap in Taiwan, coupled with construction and enhancement of advanced fabs in Japan, reflects accelerating EUV tool adoption to sustain cutting-edge chip production and secure technological leadership across logic and high-performance computing applications.
- The demand surge is further reinforced by South Korea’s leadership, where Samsung is scaling its Gate-All-Around transistor technology and investing in next-generation fabs requiring high-productivity EUV platforms for both logic and advanced memory manufacturing. Intensifying advanced semiconductor investments across Taiwan, Japan, and South Korea consolidate Asia Pacific as the dominant growth engine for the EUV lithography equipment market.
- Strong regional commitments to advanced node manufacturing ensure Asia Pacific remains the dominant growth engine for the EUV lithography equipment market.
Extreme-Ultraviolet-Lithography-Equipment-Market Ecosystem
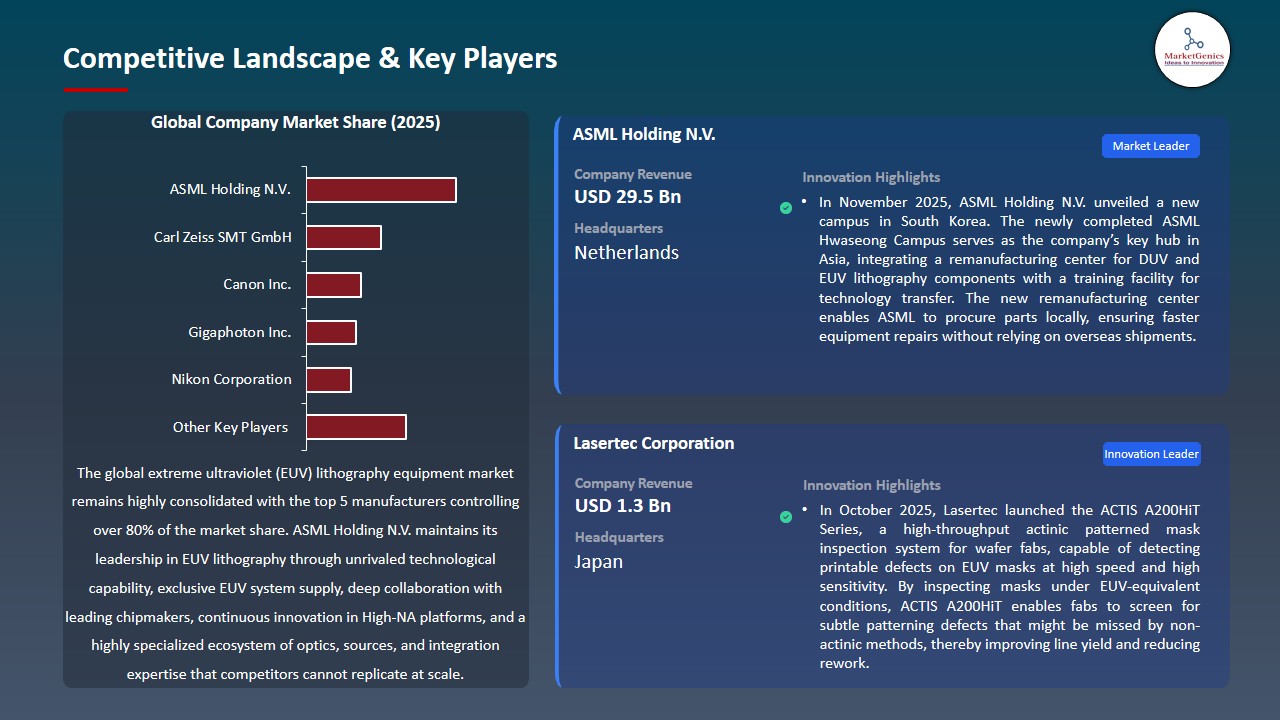
The extreme ultraviolet (EUV) lithography equipment market is highly consolidated at the core system level, led predominantly by Tier-1 players such as ASML, Carl Zeiss SMT, and key light-source vendors like Cymer and Gigaphoton, while Tier-2 and Tier-3 firms including Tokyo Electron, KLA, Canon, Nikon, Lasertec, Veeco, SUSS MicroTec, Ushio, and others support subsystems, optics, metrology, and ecosystem components. Buyer concentration is high due to limited advanced fabs, while supplier concentration is very high, strengthening vendor power.
Recent Development and Strategic Overview:
- In December 2025, Dai Nippon Printing (DNP) announced development of nanoimprint lithography (NIL) technology with circuit line width as fine as 10 nanometers, capable of replacing EUV lithography in selected patterning stages for advanced logic processes. The technology is designed for patterning 1.4nm-class logic semiconductor circuits, with mass production targeted for 2027.
- In September 2025, SK hynix Inc. has assembled the industry's first High NA EUV lithography system for mass production at the M16 fabrication plant in Icheon, South Korea. SK hynix plans to simplify the existing EUV process and accelerate the development of the next-generation memory to advance product performance and cost competitiveness.
Report Scope
|
Attribute |
Detail |
|
Market Size in 2025 |
USD 17.9 Bn |
|
Market Forecast Value in 2035 |
USD 50.4 Bn |
|
Growth Rate (CAGR) |
10.9% |
|
Forecast Period |
2026 – 2035 |
|
Historical Data Available for |
2021 – 2024 |
|
Market Size Units |
US$ Billion for Value Units for Volume |
|
Report Format |
Electronic (PDF) + Excel |
|
Regions and Countries Covered |
|||||
|
North America |
Europe |
Asia Pacific |
Middle East |
Africa |
South America |
|
|
|
|
|
|
|
Companies Covered |
|||||
|
|
|
|
|
|
Extreme-Ultraviolet-Lithography-Equipment-Market Segmentation and Highlights
|
Segment |
Sub-segment |
|
Extreme Ultraviolet (EUV) Lithography Equipment Market, By Technology Type |
|
|
Extreme Ultraviolet (EUV) Lithography Equipment Market, By Wavelength |
|
|
Extreme Ultraviolet (EUV) Lithography Equipment Market, By Rated Capacity (Wafers Per Hour) |
|
|
Extreme Ultraviolet (EUV) Lithography Equipment Market, By Node Technology |
|
|
Extreme Ultraviolet (EUV) Lithography Equipment Market, By Overlay Accuracy |
|
|
Extreme Ultraviolet (EUV) Lithography Equipment Market, By System Configuration |
|
|
Extreme Ultraviolet (EUV) Lithography Equipment Market, By System Integration Level |
|
|
Extreme Ultraviolet (EUV) Lithography Equipment Market, By Application |
|
Frequently Asked Questions
Table of Contents
- 1. Research Methodology and Assumptions
- 1.1. Definitions
- 1.2. Research Design and Approach
- 1.3. Data Collection Methods
- 1.4. Base Estimates and Calculations
- 1.5. Forecasting Models
- 1.5.1. Key Forecast Factors & Impact Analysis
- 1.6. Secondary Research
- 1.6.1. Open Sources
- 1.6.2. Paid Databases
- 1.6.3. Associations
- 1.7. Primary Research
- 1.7.1. Primary Sources
- 1.7.2. Primary Interviews with Stakeholders across Ecosystem
- 2. Executive Summary
- 2.1. Global Extreme Ultraviolet (EUV) Lithography Equipment Market Outlook
- 2.1.1. Extreme Ultraviolet (EUV) Lithography Equipment Market Size (Volume - Units and Value - US$ Bn), and Forecasts, 2021-2035
- 2.1.2. Compounded Annual Growth Rate Analysis
- 2.1.3. Growth Opportunity Analysis
- 2.1.4. Segmental Share Analysis
- 2.1.5. Geographical Share Analysis
- 2.2. Market Analysis and Facts
- 2.3. Supply-Demand Analysis
- 2.4. Competitive Benchmarking
- 2.5. Go-to- Market Strategy
- 2.5.1. Customer/ End-use Industry Assessment
- 2.5.2. Growth Opportunity Data, 2026-2035
- 2.5.2.1. Regional Data
- 2.5.2.2. Country Data
- 2.5.2.3. Segmental Data
- 2.5.3. Identification of Potential Market Spaces
- 2.5.4. GAP Analysis
- 2.5.5. Potential Attractive Price Points
- 2.5.6. Prevailing Market Risks & Challenges
- 2.5.7. Preferred Sales & Marketing Strategies
- 2.5.8. Key Recommendations and Analysis
- 2.5.9. A Way Forward
- 2.1. Global Extreme Ultraviolet (EUV) Lithography Equipment Market Outlook
- 3. Industry Data and Premium Insights
- 3.1. Global Extreme Ultraviolet (EUV) Lithography Equipment Industry Overview, 2025
- 3.1.1. Semiconductors & Electronics Industry Ecosystem Analysis
- 3.1.2. Key Trends for Semiconductors & Electronics Industry
- 3.1.3. Regional Distribution for Semiconductors & Electronics Industry
- 3.2. Supplier Customer Data
- 3.3. Technology Roadmap and Developments
- 3.4. Trade Analysis
- 3.4.1. Import & Export Analysis, 2025
- 3.4.2. Top Importing Countries
- 3.4.3. Top Exporting Countries
- 3.5. Trump Tariff Impact Analysis
- 3.5.1. Manufacturer
- 3.5.1.1. Based on the component & Raw material
- 3.5.2. Supply Chain
- 3.5.3. End Consumer
- 3.5.1. Manufacturer
- 3.6. Raw Material Analysis
- 3.1. Global Extreme Ultraviolet (EUV) Lithography Equipment Industry Overview, 2025
- 4. Market Overview
- 4.1. Market Dynamics
- 4.1.1. Drivers
- 4.1.1.1. Rapid transition to 2 nm and sub-2 nm semiconductor nodes requiring precise pattern accuracy and scaling efficiency
- 4.1.1.2. Rising demand for AI, data center, and advanced computing chips boosting leading-edge manufacturing investments
- 4.1.1.3. Increasing integration of EUV in advanced memory production including HBM and next-generation DRAM
- 4.1.2. Restraints
- 4.1.2.1. Extremely high equipment cost, installation complexity, and operational maintenance requirements
- 4.1.2.2. Limited global supply capability for critical EUV components and high dependency on specialized vendors
- 4.1.1. Drivers
- 4.2. Key Trend Analysis
- 4.3. Regulatory Framework
- 4.3.1. Key Regulations, Norms, and Subsidies, by Key Countries
- 4.3.2. Tariffs and Standards
- 4.3.3. Impact Analysis of Regulations on the Market
- 4.4. Value Chain Analysis
- 4.4.1. Component Suppliers
- 4.4.2. EUV Lithography Equipment Manufacturers
- 4.4.3. System Integrators
- 4.4.4. Dealers/ Distributors
- 4.4.5. End-users/ Customers
- 4.4.6. Maintenance/ Spare Parts/ Services Providers
- 4.5. Cost Structure Analysis
- 4.5.1. Parameter’s Share for Cost Associated
- 4.5.2. COGP vs COGS
- 4.5.3. Profit Margin Analysis
- 4.6. Pricing Analysis
- 4.6.1. Regional Pricing Analysis
- 4.6.2. Segmental Pricing Trends
- 4.6.3. Factors Influencing Pricing
- 4.7. Porter’s Five Forces Analysis
- 4.8. PESTEL Analysis
- 4.9. Global Extreme Ultraviolet (EUV) Lithography Equipment Market Demand
- 4.9.1. Historical Market Size – in Volume (Units) and Value (US$ Bn), 2020-2024
- 4.9.2. Current and Future Market Size – in Volume (Units) and Value (US$ Bn), 2026–2035
- 4.9.2.1. Y-o-Y Growth Trends
- 4.9.2.2. Absolute $ Opportunity Assessment
- 4.1. Market Dynamics
- 5. Competition Landscape
- 5.1. Competition structure
- 5.1.1. Fragmented v/s consolidated
- 5.2. Company Share Analysis, 2025
- 5.2.1. Global Company Market Share
- 5.2.2. By Region
- 5.2.2.1. North America
- 5.2.2.2. Europe
- 5.2.2.3. Asia Pacific
- 5.2.2.4. Middle East
- 5.2.2.5. Africa
- 5.2.2.6. South America
- 5.3. Product Comparison Matrix
- 5.3.1. Specifications
- 5.3.2. Market Positioning
- 5.3.3. Pricing
- 5.1. Competition structure
- 6. Global Extreme Ultraviolet (EUV) Lithography Equipment Market Analysis, by Technology Type
- 6.1. Key Segment Analysis
- 6.2. Extreme Ultraviolet (EUV) Lithography Equipment Market Size (Volume - Units and Value - US$ Bn), Analysis, and Forecasts, by Technology Type, 2021-2035
- 6.2.1. EUV Scanner Generation
- 6.2.1.1. NXE:3800E Series
- 6.2.1.2. NXE:3400C Series
- 6.2.1.3. NXE:3600D Series
- 6.2.1.4. Next-Generation EUV Systems
- 6.2.1.4.1. EXE:5000
- 6.2.1.4.2. EXE:5200B
- 6.2.2. Light Source Type
- 6.2.2.1. Laser-Produced Plasma (LPP)
- 6.2.2.1.1. CO2 Laser-based LPP
- 6.2.2.1.2. Nd:YAG Laser-based LPP
- 6.2.2.1.3. Others
- 6.2.2.2. Discharge-Produced Plasma (DPP)
- 6.2.2.3. Free Electron Laser (FEL)
- 6.2.2.4. Others
- 6.2.2.1. Laser-Produced Plasma (LPP)
- 6.2.1. EUV Scanner Generation
- 7. Global Extreme Ultraviolet (EUV) Lithography Equipment Market Analysis, by Wavelength
- 7.1. Key Segment Analysis
- 7.2. Extreme Ultraviolet (EUV) Lithography Equipment Market Size (Volume - Units and Value - US$ Bn), Analysis, and Forecasts, by Wavelength, 2021-2035
- 7.2.1. 5 nm EUV
- 7.2.2. 7 nm Beyond EUV (BEUV)
- 8. Global Extreme Ultraviolet (EUV) Lithography Equipment Market Analysis, by Rated Capacity (Wafers Per Hour)
- 8.1. Key Segment Analysis
- 8.2. Extreme Ultraviolet (EUV) Lithography Equipment Market Size (Volume - Units and Value - US$ Bn), Analysis, and Forecasts, by Rated Capacity (Wafers Per Hour), 2021-2035
- 8.2.1. Below 100 WPH
- 8.2.2. 100-125 WPH
- 8.2.3. 125-150 WPH
- 8.2.4. 150-175 WPH
- 8.2.5. Above 175 WPH
- 9. Global Extreme Ultraviolet (EUV) Lithography Equipment Market Analysis, by Node Technology
- 9.1. Key Segment Analysis
- 9.2. Extreme Ultraviolet (EUV) Lithography Equipment Market Size (Volume - Units and Value - US$ Bn), Analysis, and Forecasts, by Node Technology, 2021-2035
- 9.2.1. 7nm Node
- 9.2.2. 5nm Node
- 9.2.3. 3nm Node
- 9.2.4. 2nm Node
- 9.2.5. 1nm and Below
- 10. Global Extreme Ultraviolet (EUV) Lithography Equipment Market Analysis, by Overlay Accuracy
- 10.1. Key Segment Analysis
- 10.2. Extreme Ultraviolet (EUV) Lithography Equipment Market Size (Volume - Units and Value - US$ Bn), Analysis, and Forecasts, by Overlay Accuracy, 2021-2035
- 10.2.1. Below 1.5 nm
- 10.2.2. 5 nm - 2.0 nm
- 10.2.3. 0 nm - 2.5 nm
- 10.2.4. Above 2.5 nm
- 11. Global Extreme Ultraviolet (EUV) Lithography Equipment Market Analysis, by System Configuration
- 11.1. Key Segment Analysis
- 11.2. Extreme Ultraviolet (EUV) Lithography Equipment Market Size (Volume - Units and Value - US$ Bn), Analysis, and Forecasts, by System Configuration, 2021-2035
- 11.2.1. Single Exposure Systems
- 11.2.2. Multi-Patterning Systems
- 11.2.3. High-NA EUV Systems (0.55 NA)
- 11.2.4. Standard-NA EUV Systems (0.33 NA)
- 12. Global Extreme Ultraviolet (EUV) Lithography Equipment Market Analysis, by System Integration Level
- 12.1. Key Segment Analysis
- 12.2. Extreme Ultraviolet (EUV) Lithography Equipment Market Size (Volume - Units and Value - US$ Bn), Analysis, and Forecasts, by System Integration Level, 2021-2035
- 12.2.1. Standalone EUV Systems
- 12.2.2. Integrated Manufacturing Systems
- 12.2.2.1. Inline Systems
- 12.2.2.2. Cluster Tool Integration
- 12.2.3. Pilot Line Systems
- 12.2.4. High-Volume Manufacturing (HVM) Systems
- 13. Global Extreme Ultraviolet (EUV) Lithography Equipment Market Analysis, by Application
- 13.1. Key Segment Analysis
- 13.2. Extreme Ultraviolet (EUV) Lithography Equipment Market Size (Volume - Units and Value - US$ Bn), Analysis, and Forecasts, by Application, 2021-2035
- 13.2.1. Logic Chips Production
- 13.2.2. Memory Chips Production
- 13.2.3. System-on-Chip (SoC) Manufacturing
- 13.2.4. Graphics Processing Units (GPUs)
- 13.2.5. Application-Specific Integrated Circuits (ASICs)
- 13.2.6. Foundry Services
- 13.2.7. Others
- 14. Global Extreme Ultraviolet (EUV) Lithography Equipment Market Analysis, by Region
- 14.1. Key Findings
- 14.2. Extreme Ultraviolet (EUV) Lithography Equipment Market Size (Value - US$ Mn), Analysis, and Forecasts, by Region, 2021-2035
- 14.2.1. North America
- 14.2.2. Europe
- 14.2.3. Asia Pacific
- 14.2.4. Middle East
- 14.2.5. Africa
- 14.2.6. South America
- 15. North America Extreme Ultraviolet (EUV) Lithography Equipment Market Analysis
- 15.1. Key Segment Analysis
- 15.2. Regional Snapshot
- 15.3. North America Extreme Ultraviolet (EUV) Lithography Equipment Market Size Volume - Units and Value - US$ Bn), Analysis, and Forecasts, 2021-2035
- 15.3.1. Technology Type
- 15.3.2. Wavelength
- 15.3.3. Rated Capacity (Wafers Per Hour)
- 15.3.4. Node Technology
- 15.3.5. Overlay Accuracy
- 15.3.6. System Configuration
- 15.3.7. System Integration Level
- 15.3.8. Application
- 15.3.9. Country
- 15.3.9.1. USA
- 15.3.9.2. Canada
- 15.3.9.3. Mexico
- 15.4. USA Extreme Ultraviolet (EUV) Lithography Equipment Market
- 15.4.1. Country Segmental Analysis
- 15.4.2. Technology Type
- 15.4.3. Wavelength
- 15.4.4. Rated Capacity (Wafers Per Hour)
- 15.4.5. Node Technology
- 15.4.6. Overlay Accuracy
- 15.4.7. System Configuration
- 15.4.8. System Integration Level
- 15.4.9. Application
- 15.5. Canada Extreme Ultraviolet (EUV) Lithography Equipment Market
- 15.5.1. Country Segmental Analysis
- 15.5.2. Technology Type
- 15.5.3. Wavelength
- 15.5.4. Rated Capacity (Wafers Per Hour)
- 15.5.5. Node Technology
- 15.5.6. Overlay Accuracy
- 15.5.7. System Configuration
- 15.5.8. System Integration Level
- 15.5.9. Application
- 15.6. Mexico Extreme Ultraviolet (EUV) Lithography Equipment Market
- 15.6.1. Country Segmental Analysis
- 15.6.2. Technology Type
- 15.6.3. Wavelength
- 15.6.4. Rated Capacity (Wafers Per Hour)
- 15.6.5. Node Technology
- 15.6.6. Overlay Accuracy
- 15.6.7. System Configuration
- 15.6.8. System Integration Level
- 15.6.9. Application
- 16. Europe Extreme Ultraviolet (EUV) Lithography Equipment Market Analysis
- 16.1. Key Segment Analysis
- 16.2. Regional Snapshot
- 16.3. Europe Extreme Ultraviolet (EUV) Lithography Equipment Market Size (Volume - Units and Value - US$ Bn), Analysis, and Forecasts, 2021-2035
- 16.3.1. Technology Type
- 16.3.2. Wavelength
- 16.3.3. Rated Capacity (Wafers Per Hour)
- 16.3.4. Node Technology
- 16.3.5. Overlay Accuracy
- 16.3.6. System Configuration
- 16.3.7. System Integration Level
- 16.3.8. Application
- 16.3.9. Country
- 16.3.9.1. Germany
- 16.3.9.2. United Kingdom
- 16.3.9.3. France
- 16.3.9.4. Italy
- 16.3.9.5. Spain
- 16.3.9.6. Netherlands
- 16.3.9.7. Nordic Countries
- 16.3.9.8. Poland
- 16.3.9.9. Russia & CIS
- 16.3.9.10. Rest of Europe
- 16.4. Germany Extreme Ultraviolet (EUV) Lithography Equipment Market
- 16.4.1. Country Segmental Analysis
- 16.4.2. Technology Type
- 16.4.3. Wavelength
- 16.4.4. Rated Capacity (Wafers Per Hour)
- 16.4.5. Node Technology
- 16.4.6. Overlay Accuracy
- 16.4.7. System Configuration
- 16.4.8. System Integration Level
- 16.4.9. Application
- 16.5. United Kingdom Extreme Ultraviolet (EUV) Lithography Equipment Market
- 16.5.1. Country Segmental Analysis
- 16.5.2. Technology Type
- 16.5.3. Wavelength
- 16.5.4. Rated Capacity (Wafers Per Hour)
- 16.5.5. Node Technology
- 16.5.6. Overlay Accuracy
- 16.5.7. System Configuration
- 16.5.8. System Integration Level
- 16.5.9. Application
- 16.6. France Extreme Ultraviolet (EUV) Lithography Equipment Market
- 16.6.1. Country Segmental Analysis
- 16.6.2. Technology Type
- 16.6.3. Wavelength
- 16.6.4. Rated Capacity (Wafers Per Hour)
- 16.6.5. Node Technology
- 16.6.6. Overlay Accuracy
- 16.6.7. System Configuration
- 16.6.8. System Integration Level
- 16.6.9. Application
- 16.7. Italy Extreme Ultraviolet (EUV) Lithography Equipment Market
- 16.7.1. Country Segmental Analysis
- 16.7.2. Technology Type
- 16.7.3. Wavelength
- 16.7.4. Rated Capacity (Wafers Per Hour)
- 16.7.5. Node Technology
- 16.7.6. Overlay Accuracy
- 16.7.7. System Configuration
- 16.7.8. System Integration Level
- 16.7.9. Application
- 16.8. Spain Extreme Ultraviolet (EUV) Lithography Equipment Market
- 16.8.1. Country Segmental Analysis
- 16.8.2. Technology Type
- 16.8.3. Wavelength
- 16.8.4. Rated Capacity (Wafers Per Hour)
- 16.8.5. Node Technology
- 16.8.6. Overlay Accuracy
- 16.8.7. System Configuration
- 16.8.8. System Integration Level
- 16.8.9. Application
- 16.9. Netherlands Extreme Ultraviolet (EUV) Lithography Equipment Market
- 16.9.1. Country Segmental Analysis
- 16.9.2. Technology Type
- 16.9.3. Wavelength
- 16.9.4. Rated Capacity (Wafers Per Hour)
- 16.9.5. Node Technology
- 16.9.6. Overlay Accuracy
- 16.9.7. System Configuration
- 16.9.8. System Integration Level
- 16.9.9. Application
- 16.10. Nordic Countries Extreme Ultraviolet (EUV) Lithography Equipment Market
- 16.10.1. Country Segmental Analysis
- 16.10.2. Technology Type
- 16.10.3. Wavelength
- 16.10.4. Rated Capacity (Wafers Per Hour)
- 16.10.5. Node Technology
- 16.10.6. Overlay Accuracy
- 16.10.7. System Configuration
- 16.10.8. System Integration Level
- 16.10.9. Application
- 16.11. Poland Extreme Ultraviolet (EUV) Lithography Equipment Market
- 16.11.1. Country Segmental Analysis
- 16.11.2. Technology Type
- 16.11.3. Wavelength
- 16.11.4. Rated Capacity (Wafers Per Hour)
- 16.11.5. Node Technology
- 16.11.6. Overlay Accuracy
- 16.11.7. System Configuration
- 16.11.8. System Integration Level
- 16.11.9. Application
- 16.12. Russia & CIS Extreme Ultraviolet (EUV) Lithography Equipment Market
- 16.12.1. Country Segmental Analysis
- 16.12.2. Technology Type
- 16.12.3. Wavelength
- 16.12.4. Rated Capacity (Wafers Per Hour)
- 16.12.5. Node Technology
- 16.12.6. Overlay Accuracy
- 16.12.7. System Configuration
- 16.12.8. System Integration Level
- 16.12.9. Application
- 16.13. Rest of Europe Extreme Ultraviolet (EUV) Lithography Equipment Market
- 16.13.1. Country Segmental Analysis
- 16.13.2. Technology Type
- 16.13.3. Wavelength
- 16.13.4. Rated Capacity (Wafers Per Hour)
- 16.13.5. Node Technology
- 16.13.6. Overlay Accuracy
- 16.13.7. System Configuration
- 16.13.8. System Integration Level
- 16.13.9. Application
- 17. Asia Pacific Extreme Ultraviolet (EUV) Lithography Equipment Market Analysis
- 17.1. Key Segment Analysis
- 17.2. Regional Snapshot
- 17.3. Asia Pacific Extreme Ultraviolet (EUV) Lithography Equipment Market Size (Volume - Units and Value - US$ Bn), Analysis, and Forecasts, 2021-2035
- 17.3.1. Technology Type
- 17.3.2. Wavelength
- 17.3.3. Rated Capacity (Wafers Per Hour)
- 17.3.4. Node Technology
- 17.3.5. Overlay Accuracy
- 17.3.6. System Configuration
- 17.3.7. System Integration Level
- 17.3.8. Application
- 17.3.9. Country
- 17.3.9.1. China
- 17.3.9.2. India
- 17.3.9.3. Japan
- 17.3.9.4. South Korea
- 17.3.9.5. Australia and New Zealand
- 17.3.9.6. Indonesia
- 17.3.9.7. Malaysia
- 17.3.9.8. Thailand
- 17.3.9.9. Vietnam
- 17.3.9.10. Rest of Asia Pacific
- 17.4. China Extreme Ultraviolet (EUV) Lithography Equipment Market
- 17.4.1. Country Segmental Analysis
- 17.4.2. Technology Type
- 17.4.3. Wavelength
- 17.4.4. Rated Capacity (Wafers Per Hour)
- 17.4.5. Node Technology
- 17.4.6. Overlay Accuracy
- 17.4.7. System Configuration
- 17.4.8. System Integration Level
- 17.4.9. Application
- 17.5. India Extreme Ultraviolet (EUV) Lithography Equipment Market
- 17.5.1. Country Segmental Analysis
- 17.5.2. Technology Type
- 17.5.3. Wavelength
- 17.5.4. Rated Capacity (Wafers Per Hour)
- 17.5.5. Node Technology
- 17.5.6. Overlay Accuracy
- 17.5.7. System Configuration
- 17.5.8. System Integration Level
- 17.5.9. Application
- 17.6. Japan Extreme Ultraviolet (EUV) Lithography Equipment Market
- 17.6.1. Country Segmental Analysis
- 17.6.2. Technology Type
- 17.6.3. Wavelength
- 17.6.4. Rated Capacity (Wafers Per Hour)
- 17.6.5. Node Technology
- 17.6.6. Overlay Accuracy
- 17.6.7. System Configuration
- 17.6.8. System Integration Level
- 17.6.9. Application
- 17.7. South Korea Extreme Ultraviolet (EUV) Lithography Equipment Market
- 17.7.1. Country Segmental Analysis
- 17.7.2. Technology Type
- 17.7.3. Wavelength
- 17.7.4. Rated Capacity (Wafers Per Hour)
- 17.7.5. Node Technology
- 17.7.6. Overlay Accuracy
- 17.7.7. System Configuration
- 17.7.8. System Integration Level
- 17.7.9. Application
- 17.8. Australia and New Zealand Extreme Ultraviolet (EUV) Lithography Equipment Market
- 17.8.1. Country Segmental Analysis
- 17.8.2. Technology Type
- 17.8.3. Wavelength
- 17.8.4. Rated Capacity (Wafers Per Hour)
- 17.8.5. Node Technology
- 17.8.6. Overlay Accuracy
- 17.8.7. System Configuration
- 17.8.8. System Integration Level
- 17.8.9. Application
- 17.9. Indonesia Extreme Ultraviolet (EUV) Lithography Equipment Market
- 17.9.1. Country Segmental Analysis
- 17.9.2. Technology Type
- 17.9.3. Wavelength
- 17.9.4. Rated Capacity (Wafers Per Hour)
- 17.9.5. Node Technology
- 17.9.6. Overlay Accuracy
- 17.9.7. System Configuration
- 17.9.8. System Integration Level
- 17.9.9. Application
- 17.10. Malaysia Extreme Ultraviolet (EUV) Lithography Equipment Market
- 17.10.1. Country Segmental Analysis
- 17.10.2. Technology Type
- 17.10.3. Wavelength
- 17.10.4. Rated Capacity (Wafers Per Hour)
- 17.10.5. Node Technology
- 17.10.6. Overlay Accuracy
- 17.10.7. System Configuration
- 17.10.8. System Integration Level
- 17.10.9. Application
- 17.11. Thailand Extreme Ultraviolet (EUV) Lithography Equipment Market
- 17.11.1. Country Segmental Analysis
- 17.11.2. Technology Type
- 17.11.3. Wavelength
- 17.11.4. Rated Capacity (Wafers Per Hour)
- 17.11.5. Node Technology
- 17.11.6. Overlay Accuracy
- 17.11.7. System Configuration
- 17.11.8. System Integration Level
- 17.11.9. Application
- 17.12. Vietnam Extreme Ultraviolet (EUV) Lithography Equipment Market
- 17.12.1. Country Segmental Analysis
- 17.12.2. Technology Type
- 17.12.3. Wavelength
- 17.12.4. Rated Capacity (Wafers Per Hour)
- 17.12.5. Node Technology
- 17.12.6. Overlay Accuracy
- 17.12.7. System Configuration
- 17.12.8. System Integration Level
- 17.12.9. Application
- 17.13. Rest of Asia Pacific Extreme Ultraviolet (EUV) Lithography Equipment Market
- 17.13.1. Country Segmental Analysis
- 17.13.2. Technology Type
- 17.13.3. Wavelength
- 17.13.4. Rated Capacity (Wafers Per Hour)
- 17.13.5. Node Technology
- 17.13.6. Overlay Accuracy
- 17.13.7. System Configuration
- 17.13.8. System Integration Level
- 17.13.9. Application
- 18. Middle East Extreme Ultraviolet (EUV) Lithography Equipment Market Analysis
- 18.1. Key Segment Analysis
- 18.2. Regional Snapshot
- 18.3. Middle East Extreme Ultraviolet (EUV) Lithography Equipment Market Size (Volume - Units and Value - US$ Bn), Analysis, and Forecasts, 2021-2035
- 18.3.1. Technology Type
- 18.3.2. Wavelength
- 18.3.3. Rated Capacity (Wafers Per Hour)
- 18.3.4. Node Technology
- 18.3.5. Overlay Accuracy
- 18.3.6. System Configuration
- 18.3.7. System Integration Level
- 18.3.8. Application
- 18.3.9. Country
- 18.3.9.1. Turkey
- 18.3.9.2. UAE
- 18.3.9.3. Saudi Arabia
- 18.3.9.4. Israel
- 18.3.9.5. Rest of Middle East
- 18.4. Turkey Extreme Ultraviolet (EUV) Lithography Equipment Market
- 18.4.1. Country Segmental Analysis
- 18.4.2. Technology Type
- 18.4.3. Wavelength
- 18.4.4. Rated Capacity (Wafers Per Hour)
- 18.4.5. Node Technology
- 18.4.6. Overlay Accuracy
- 18.4.7. System Configuration
- 18.4.8. System Integration Level
- 18.4.9. Application
- 18.5. UAE Extreme Ultraviolet (EUV) Lithography Equipment Market
- 18.5.1. Country Segmental Analysis
- 18.5.2. Technology Type
- 18.5.3. Wavelength
- 18.5.4. Rated Capacity (Wafers Per Hour)
- 18.5.5. Node Technology
- 18.5.6. Overlay Accuracy
- 18.5.7. System Configuration
- 18.5.8. System Integration Level
- 18.5.9. Application
- 18.6. Saudi Arabia Extreme Ultraviolet (EUV) Lithography Equipment Market
- 18.6.1. Country Segmental Analysis
- 18.6.2. Technology Type
- 18.6.3. Wavelength
- 18.6.4. Rated Capacity (Wafers Per Hour)
- 18.6.5. Node Technology
- 18.6.6. Overlay Accuracy
- 18.6.7. System Configuration
- 18.6.8. System Integration Level
- 18.6.9. Application
- 18.7. Israel Extreme Ultraviolet (EUV) Lithography Equipment Market
- 18.7.1. Country Segmental Analysis
- 18.7.2. Technology Type
- 18.7.3. Wavelength
- 18.7.4. Rated Capacity (Wafers Per Hour)
- 18.7.5. Node Technology
- 18.7.6. Overlay Accuracy
- 18.7.7. System Configuration
- 18.7.8. System Integration Level
- 18.7.9. Application
- 18.8. Rest of Middle East Extreme Ultraviolet (EUV) Lithography Equipment Market
- 18.8.1. Country Segmental Analysis
- 18.8.2. Technology Type
- 18.8.3. Wavelength
- 18.8.4. Rated Capacity (Wafers Per Hour)
- 18.8.5. Node Technology
- 18.8.6. Overlay Accuracy
- 18.8.7. System Configuration
- 18.8.8. System Integration Level
- 18.8.9. Application
- 19. Africa Extreme Ultraviolet (EUV) Lithography Equipment Market Analysis
- 19.1. Key Segment Analysis
- 19.2. Regional Snapshot
- 19.3. Africa Extreme Ultraviolet (EUV) Lithography Equipment Market Size (Volume - Units and Value - US$ Bn), Analysis, and Forecasts, 2021-2035
- 19.3.1. Technology Type
- 19.3.2. Wavelength
- 19.3.3. Rated Capacity (Wafers Per Hour)
- 19.3.4. Node Technology
- 19.3.5. Overlay Accuracy
- 19.3.6. System Configuration
- 19.3.7. System Integration Level
- 19.3.8. Application
- 19.3.9. Country
- 19.3.9.1. South Africa
- 19.3.9.2. Egypt
- 19.3.9.3. Nigeria
- 19.3.9.4. Algeria
- 19.3.9.5. Rest of Africa
- 19.4. South Africa Extreme Ultraviolet (EUV) Lithography Equipment Market
- 19.4.1. Country Segmental Analysis
- 19.4.2. Technology Type
- 19.4.3. Wavelength
- 19.4.4. Rated Capacity (Wafers Per Hour)
- 19.4.5. Node Technology
- 19.4.6. Overlay Accuracy
- 19.4.7. System Configuration
- 19.4.8. System Integration Level
- 19.4.9. Application
- 19.5. Egypt Extreme Ultraviolet (EUV) Lithography Equipment Market
- 19.5.1. Country Segmental Analysis
- 19.5.2. Technology Type
- 19.5.3. Wavelength
- 19.5.4. Rated Capacity (Wafers Per Hour)
- 19.5.5. Node Technology
- 19.5.6. Overlay Accuracy
- 19.5.7. System Configuration
- 19.5.8. System Integration Level
- 19.5.9. Application
- 19.6. Nigeria Extreme Ultraviolet (EUV) Lithography Equipment Market
- 19.6.1. Country Segmental Analysis
- 19.6.2. Technology Type
- 19.6.3. Wavelength
- 19.6.4. Rated Capacity (Wafers Per Hour)
- 19.6.5. Node Technology
- 19.6.6. Overlay Accuracy
- 19.6.7. System Configuration
- 19.6.8. System Integration Level
- 19.6.9. Application
- 19.7. Algeria Extreme Ultraviolet (EUV) Lithography Equipment Market
- 19.7.1. Country Segmental Analysis
- 19.7.2. Technology Type
- 19.7.3. Wavelength
- 19.7.4. Rated Capacity (Wafers Per Hour)
- 19.7.5. Node Technology
- 19.7.6. Overlay Accuracy
- 19.7.7. System Configuration
- 19.7.8. System Integration Level
- 19.7.9. Application
- 19.8. Rest of Africa Extreme Ultraviolet (EUV) Lithography Equipment Market
- 19.8.1. Country Segmental Analysis
- 19.8.2. Technology Type
- 19.8.3. Wavelength
- 19.8.4. Rated Capacity (Wafers Per Hour)
- 19.8.5. Node Technology
- 19.8.6. Overlay Accuracy
- 19.8.7. System Configuration
- 19.8.8. System Integration Level
- 19.8.9. Application
- 20. South America Extreme Ultraviolet (EUV) Lithography Equipment Market Analysis
- 20.1. Key Segment Analysis
- 20.2. Regional Snapshot
- 20.3. South America Extreme Ultraviolet (EUV) Lithography Equipment Market Size (Volume - Units and Value - US$ Bn), Analysis, and Forecasts, 2021-2035
- 20.3.1. Technology Type
- 20.3.2. Wavelength
- 20.3.3. Rated Capacity (Wafers Per Hour)
- 20.3.4. Node Technology
- 20.3.5. Overlay Accuracy
- 20.3.6. System Configuration
- 20.3.7. System Integration Level
- 20.3.8. Application
- 20.3.9. Country
- 20.3.9.1. Brazil
- 20.3.9.2. Argentina
- 20.3.9.3. Rest of South America
- 20.4. Brazil Extreme Ultraviolet (EUV) Lithography Equipment Market
- 20.4.1. Country Segmental Analysis
- 20.4.2. Technology Type
- 20.4.3. Wavelength
- 20.4.4. Rated Capacity (Wafers Per Hour)
- 20.4.5. Node Technology
- 20.4.6. Overlay Accuracy
- 20.4.7. System Configuration
- 20.4.8. System Integration Level
- 20.4.9. Application
- 20.5. Argentina Extreme Ultraviolet (EUV) Lithography Equipment Market
- 20.5.1. Country Segmental Analysis
- 20.5.2. Technology Type
- 20.5.3. Wavelength
- 20.5.4. Rated Capacity (Wafers Per Hour)
- 20.5.5. Node Technology
- 20.5.6. Overlay Accuracy
- 20.5.7. System Configuration
- 20.5.8. System Integration Level
- 20.5.9. Application
- 20.6. Rest of South America Extreme Ultraviolet (EUV) Lithography Equipment Market
- 20.6.1. Country Segmental Analysis
- 20.6.2. Technology Type
- 20.6.3. Wavelength
- 20.6.4. Rated Capacity (Wafers Per Hour)
- 20.6.5. Node Technology
- 20.6.6. Overlay Accuracy
- 20.6.7. System Configuration
- 20.6.8. System Integration Level
- 20.6.9. Application
- 21. Key Players/ Company Profile
- 21.1. Applied Materials Inc.
- 21.1.1. Company Details/ Overview
- 21.1.2. Company Financials
- 21.1.3. Key Customers and Competitors
- 21.1.4. Business/ Industry Portfolio
- 21.1.5. Product Portfolio/ Specification Details
- 21.1.6. Pricing Data
- 21.1.7. Strategic Overview
- 21.1.8. Recent Developments
- 21.2. ASML Holding N.V.
- 21.3. Canon Inc.
- 21.4. Carl Zeiss SMT GmbH
- 21.5. Cymer LLC
- 21.6. Edmund Optics Inc.
- 21.7. Gigaphoton Inc.
- 21.8. Huawei Corporation
- 21.9. KLA Corporation
- 21.10. Lasertec Corporation
- 21.11. Nikon Corporation
- 21.12. NuFlare Technology Inc.
- 21.13. Onto Innovation Inc.
- 21.14. SUSS MicroTec
- 21.15. Tekscend Photomask Corp.
- 21.16. Tokyo Electron Limited
- 21.17. Trumpf SE + Co. KG
- 21.18. Ushio Inc.
- 21.19. Veeco Instruments Inc.
- 21.20. Other Key Players
- 21.1. Applied Materials Inc.
Note* - This is just tentative list of players. While providing the report, we will cover more number of players based on their revenue and share for each geography
Research Design
Our research design integrates both demand-side and supply-side analysis through a balanced combination of primary and secondary research methodologies. By utilizing both bottom-up and top-down approaches alongside rigorous data triangulation methods, we deliver robust market intelligence that supports strategic decision-making.
MarketGenics' comprehensive research design framework ensures the delivery of accurate, reliable, and actionable market intelligence. Through the integration of multiple research approaches, rigorous validation processes, and expert analysis, we provide our clients with the insights needed to make informed strategic decisions and capitalize on market opportunities.

MarketGenics leverages a dedicated industry panel of experts and a comprehensive suite of paid databases to effectively collect, consolidate, and analyze market intelligence.
Our approach has consistently proven to be reliable and effective in generating accurate market insights, identifying key industry trends, and uncovering emerging business opportunities.
Through both primary and secondary research, we capture and analyze critical company-level data such as manufacturing footprints, including technical centers, R&D facilities, sales offices, and headquarters.
Our expert panel further enhances our ability to estimate market size for specific brands based on validated field-level intelligence.
Our data mining techniques incorporate both parametric and non-parametric methods, allowing for structured data collection, sorting, processing, and cleaning.
Demand projections are derived from large-scale data sets analyzed through proprietary algorithms, culminating in robust and reliable market sizing.
Research Approach
The bottom-up approach builds market estimates by starting with the smallest addressable market units and systematically aggregating them to create comprehensive market size projections.
This method begins with specific, granular data points and builds upward to create the complete market landscape.
Customer Analysis → Segmental Analysis → Geographical Analysis
The top-down approach starts with the broadest possible market data and systematically narrows it down through a series of filters and assumptions to arrive at specific market segments or opportunities.
This method begins with the big picture and works downward to increasingly specific market slices.
TAM → SAM → SOM


Research Methods
Desk / Secondary Research
While analysing the market, we extensively study secondary sources, directories, and databases to identify and collect information useful for this technical, market-oriented, and commercial report. Secondary sources that we utilize are not only the public sources, but it is a combination of Open Source, Associations, Paid Databases, MG Repository & Knowledgebase, and others.
- Company websites, annual reports, financial reports, broker reports, and investor presentations
- National government documents, statistical databases and reports
- News articles, press releases and web-casts specific to the companies operating in the market, Magazines, reports, and others
- We gather information from commercial data sources for deriving company specific data such as segmental revenue, share for geography, product revenue, and others
- Internal and external proprietary databases (industry-specific), relevant patent, and regulatory databases
- Governing Bodies, Government Organizations
- Relevant Authorities, Country-specific Associations for Industries
We also employ the model mapping approach to estimate the product level market data through the players' product portfolio
Primary Research
Primary research/ interviews is vital in analyzing the market. Most of the cases involves paid primary interviews. Primary sources include primary interviews through e-mail interactions, telephonic interviews, surveys as well as face-to-face interviews with the different stakeholders across the value chain including several industry experts.
| Type of Respondents | Number of Primaries |
|---|---|
| Tier 2/3 Suppliers | ~20 |
| Tier 1 Suppliers | ~25 |
| End-users | ~25 |
| Industry Expert/ Panel/ Consultant | ~30 |
| Total | ~100 |
MG Knowledgebase
• Repository of industry blog, newsletter and case studies
• Online platform covering detailed market reports, and company profiles
Forecasting Factors and Models
Forecasting Factors
- Historical Trends – Past market patterns, cycles, and major events that shaped how markets behave over time. Understanding past trends helps predict future behavior.
- Industry Factors – Specific characteristics of the industry like structure, regulations, and innovation cycles that affect market dynamics.
- Macroeconomic Factors – Economic conditions like GDP growth, inflation, and employment rates that affect how much money people have to spend.
- Demographic Factors – Population characteristics like age, income, and location that determine who can buy your product.
- Technology Factors – How quickly people adopt new technology and how much technology infrastructure exists.
- Regulatory Factors – Government rules, laws, and policies that can help or restrict market growth.
- Competitive Factors – Analyzing competition structure such as degree of competition and bargaining power of buyers and suppliers.
Forecasting Models / Techniques
Multiple Regression Analysis
- Identify and quantify factors that drive market changes
- Statistical modeling to establish relationships between market drivers and outcomes
Time Series Analysis – Seasonal Patterns
- Understand regular cyclical patterns in market demand
- Advanced statistical techniques to separate trend, seasonal, and irregular components
Time Series Analysis – Trend Analysis
- Identify underlying market growth patterns and momentum
- Statistical analysis of historical data to project future trends
Expert Opinion – Expert Interviews
- Gather deep industry insights and contextual understanding
- In-depth interviews with key industry stakeholders
Multi-Scenario Development
- Prepare for uncertainty by modeling different possible futures
- Creating optimistic, pessimistic, and most likely scenarios
Time Series Analysis – Moving Averages
- Sophisticated forecasting for complex time series data
- Auto-regressive integrated moving average models with seasonal components
Econometric Models
- Apply economic theory to market forecasting
- Sophisticated economic models that account for market interactions
Expert Opinion – Delphi Method
- Harness collective wisdom of industry experts
- Structured, multi-round expert consultation process
Monte Carlo Simulation
- Quantify uncertainty and probability distributions
- Thousands of simulations with varying input parameters
Research Analysis
Our research framework is built upon the fundamental principle of validating market intelligence from both demand and supply perspectives. This dual-sided approach ensures comprehensive market understanding and reduces the risk of single-source bias.
Demand-Side Analysis: We understand end-user/application behavior, preferences, and market needs along with the penetration of the product for specific application.
Supply-Side Analysis: We estimate overall market revenue, analyze the segmental share along with industry capacity, competitive landscape, and market structure.
Validation & Evaluation
Data triangulation is a validation technique that uses multiple methods, sources, or perspectives to examine the same research question, thereby increasing the credibility and reliability of research findings. In market research, triangulation serves as a quality assurance mechanism that helps identify and minimize bias, validate assumptions, and ensure accuracy in market estimates.
- Data Source Triangulation – Using multiple data sources to examine the same phenomenon
- Methodological Triangulation – Using multiple research methods to study the same research question
- Investigator Triangulation – Using multiple researchers or analysts to examine the same data
- Theoretical Triangulation – Using multiple theoretical perspectives to interpret the same data

Custom Market Research Services
We will customise the research for you, in case the report listed above does not meet your requirements.
Get 10% Free Customisation