Golf Cart Market Size, Share & Trends Analysis Report by Component (Motors & Drivetrain, Battery (Lead‑Acid Battery, Lithium‑Ion Battery, Other Battery Types), Steering & Suspension, Body & Chassis, Accessories & Add‑ons, Others), Propulsion Type, Seating Capacity, Drive Type, Customization Level, Terrain Capability, Application, End‑User, Distribution Channel and Geography (North America, Europe, Asia Pacific, Middle East, Africa, and South America) – Global Industry Data, Trends, and Forecasts, 2026–2035
Market Overview:
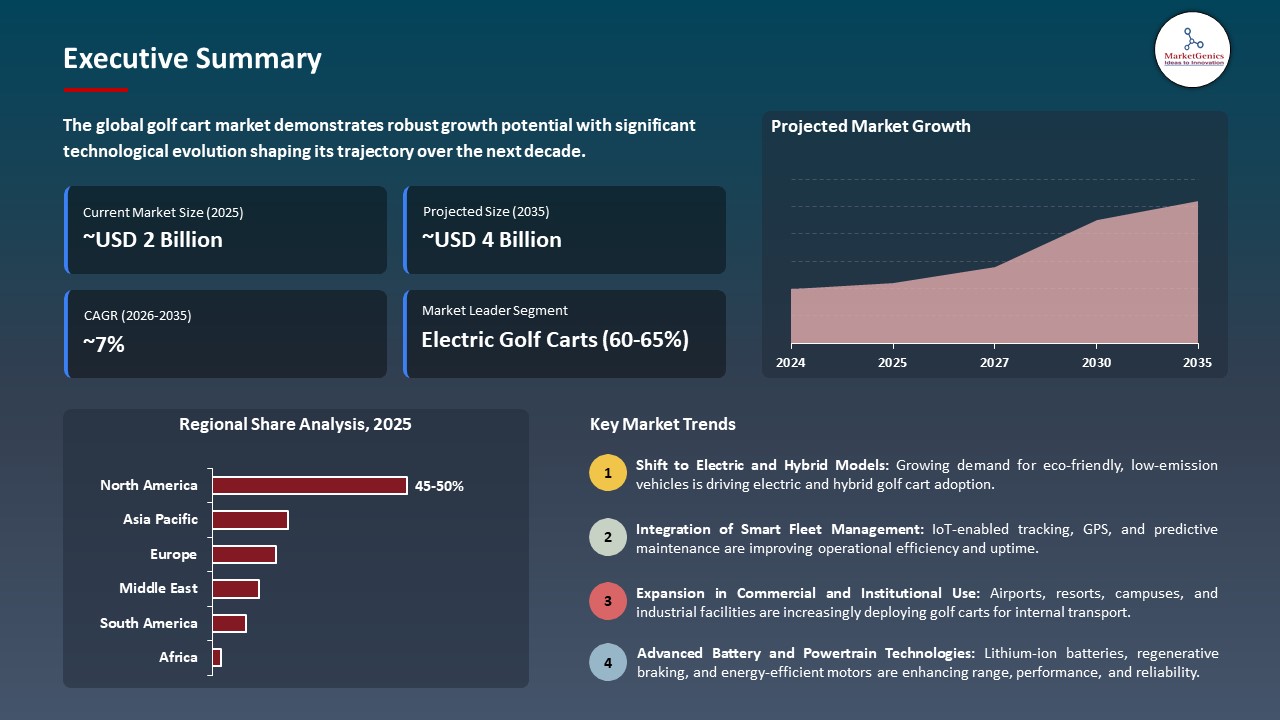
According to MarketGenics analysis, the global golf cart market is witnessing steady growth, with the market estimated at USD 2.1 billion in 2025 and projected to reach USD 3.9 billion by 2035, registering a CAGR of 6.5% during the forecast period.
|
Market Structure & Evolution |
|
|
Segmental Data Insights |
|
|
Demand Trends |
|
|
Competitive Landscape |
|
|
Strategic Development |
|
|
Future Outlook & Opportunities |
|
Golf Cart Market Size, Share, and Growth
During CES 2026, Navy Golf introduced their new electric golf push carts featuring AI technology, UWB Positioning, Gesture Control, Voice Control, Obstacle-Avoidance Cameras and a GIS Navigation system; thus, moving the industry forward in creating a more automated Golf Cart. Additionally, they previewed an ULTRALIGHT model that is expected to be available by May 2026 which can complete 36+ holes without needing to recharge, thereby highlighting the increasing use and development among golf carts.
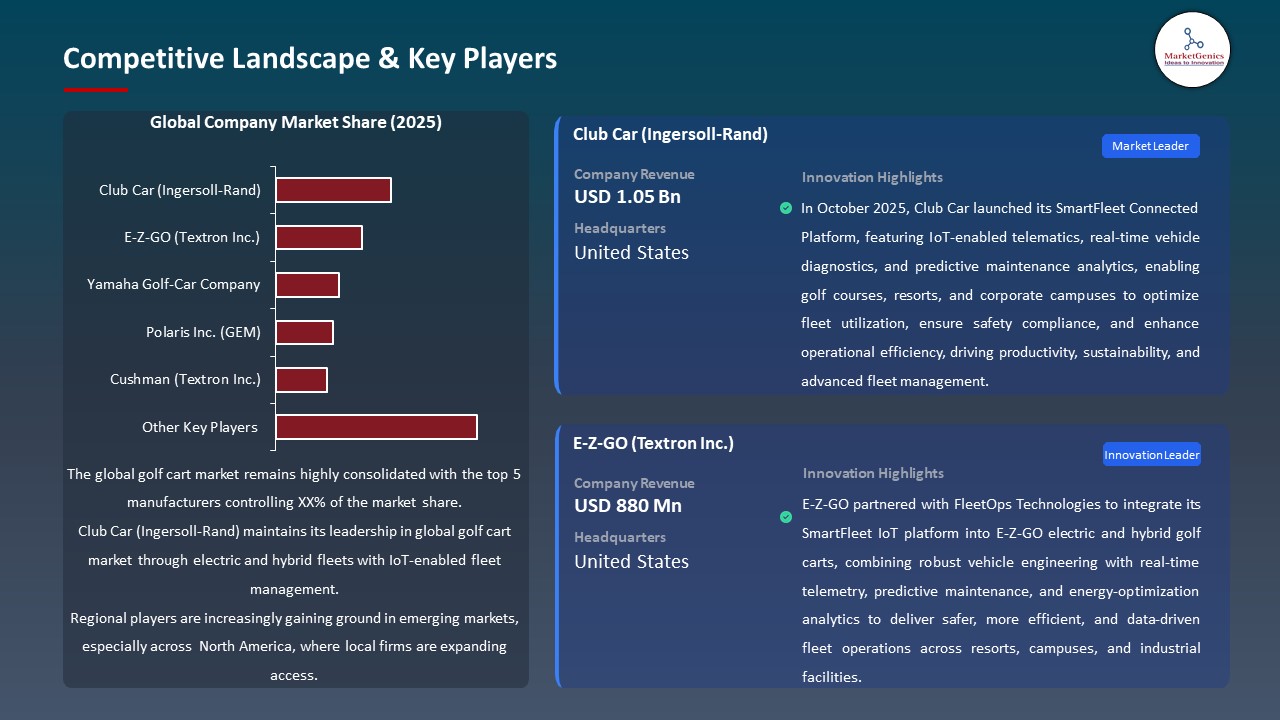
The golf-cart-market worldwide has experienced a large amount of growth in recent years due to several different reasons, including advancements in technology for electric and hybrid golf carts that allow higher efficiency, longer distances and increased safety. In August 2025, E-Z-GO launched its RXV 2026 model that utilizes Samsung SDI lithium-ion batteries and Smart Diagnostics which maximize energy usage and help monitor battery life in real-time producing improved reliability and performance.
With increasing use of golf carts in resorts, universities, gated communities, and commercial buildings there is greater need for high-performance/durable golf carts than ever before. An example is Textron's E-Z-GO deployment of more than 500 electric golf carts in luxury resort chains throughout Florida in March 2025 as part of a campaign to modernize fleet operations and enhance user experience.
The increasing number of Sustainability initiatives, emission reduction policies and workplace mobility regulations are furthering the investment made by operators into Electric and Hybrid solutions to comply with these regulations. The combination of technology advancement, regulatory support and increased application areas is expected to continue to drive growth within the golf cart market while increasing energy efficiency and operational productivity.
Adjacent growth opportunities include utility carts and transport carts for industrial and hospitality applications, fleet management software solutions, battery swapping solutions and autonomous navigation systems allowing manufacturers the opportunity to diversify their products and create new revenue streams.
Golf Cart Market Dynamics and Trends
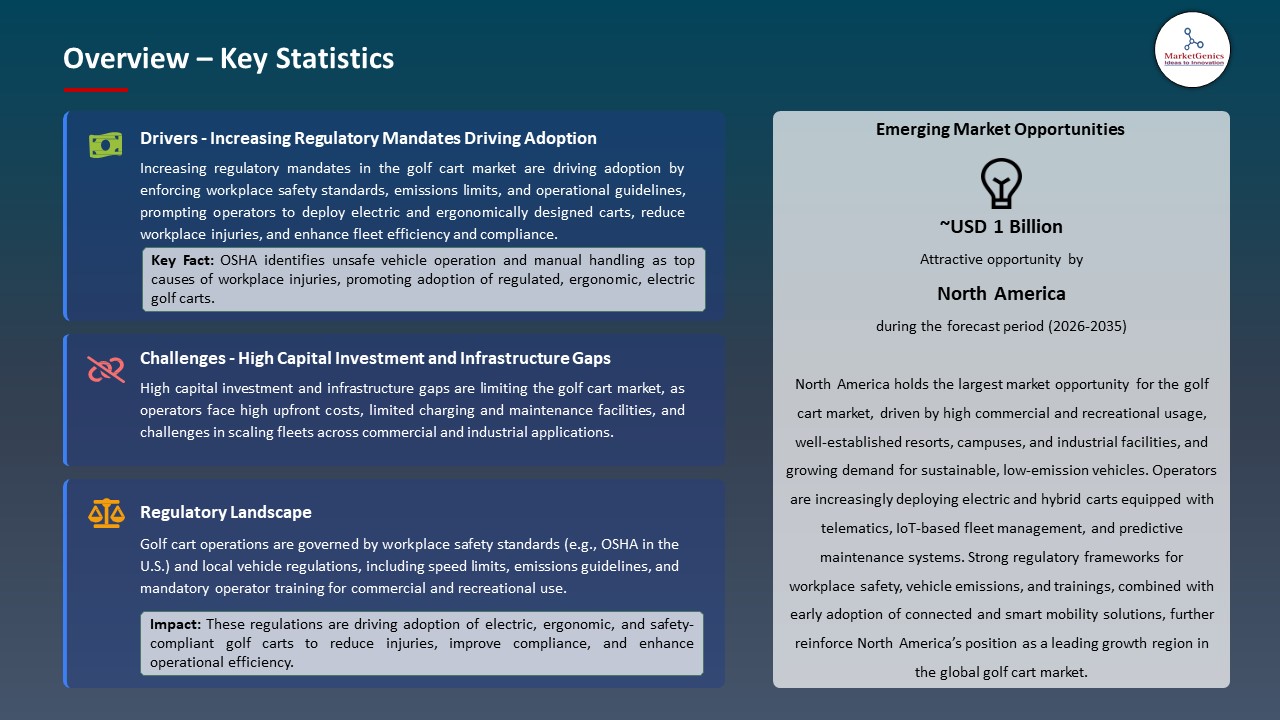
Driver: Increasing Regulatory Mandates Driving Adoption of Advanced Electric Golf Carts
-
The electric golf cart market is growing rapidly because of governmental regulations and initiatives aimed at achieving environmentally sustainable practices. Governmental and local authorities are offering incentives for people to switch to "zero-emission" mobility options such as electric golf carts in resorts, colleges, and urban areas.
- For instance, in January 2025, Polaris Golf released electric utility and golf carts that meet the criteria of California's Low-Emission Vehicle Program and therefore support "safer and more eco-friendly" fleet operations.
- Since, the need to reduce carbon footprint through decreased energy usage and enhanced safety of "workplace" vehicles increases, so does the push for adoption of electric golf carts in both recreation and commercial markets. All these factors are likely to boost the growth of the golf cart market.
Restraint: High Capital Investment and Infrastructure Gaps
-
The initial expense of electric golf carts and their related infrastructure (i.e. charging stations, battery swapping stations) is seen as a significant hindrance to the widespread use of golf carts. Operators generally encounter difficulties in establishing large fleets because they do not have adequate on-site charging, maintenance, and storage facilities, especially for operators located on resorts, campuses, and industrial campuses.
- The challenge of balancing future cost savings with upfront capital requirements is expected to remain a strong impediment to operators in developing countries and to operators who are unable to access financial support to upgrade their fleet. Variations in local regulatory requirements and permitting procedures is expected to also contribute to the delayed deployment of fleets and add unnecessary costs and administrative difficulties for operators.
- Additionally, there are significant operational costs related to maintenance and operation of electric golf carts due to limited battery life and the need to periodically replace batteries, which may deter smaller businesses from transitioning to a fully electric fleet. All these elements are expected to restrict the expansion of the golf cart market.
Opportunity: Expansion into Institutional and Commercial Fleets
-
The usage of electric golf carts has grown rapidly across many market sectors besides the traditional golf course, including airports, industrial parks, hospitals, and gated neighborhoods. In February 2025, Garia Automotive is expected to deliver 200 premium electric golf carts for passenger transportation to a Middle Eastern airport, showcasing the rapidly increasing trend of commercial and institutional use of electric golf carts.
- The trend continues to grow rapidly, there are also potential opportunities for fleet management software, modular electric batteries, and hybrid utility/electric golf carts. These opportunities are expected to allow manufacturers and service providers an additional way to diversify the types of products they offer, as well as the revenue they generate. And thus, is expected to create more opportunities in future for golf cart market.
Key Trend: IoT-Enabled Fleet Management and Advanced Battery Systems
-
Fleet operators are benefiting from the use of GPS tracking to monitor real-time vehicle performance, improve routes, and minimize unplanned downtime through the combination of IoT/diagnostics and predictive maintenance with fleet operators through improved routes. The goal of using advanced batteries, energy-efficient motor systems, and regenerative braking on electric powered utility carts has increased range, reliability and overall cost effectiveness while decreasing environmental impact.
- Notably, in July 2025, firm named Taylor-Dunn introduced an electric utility cart that helped to increase fleet uptime by 15%, reduced maintenance costs and allowed for the operator to better schedule the use of their electric utility carts. Additionally, manufacturers are also testing the use of connected platforms that include a fleet management mobile app with remote control capabilities, predictive alerts and usage reporting for park-like resorts and large commercial, mixed fleet operators.
- This trend indicates a movement towards the use of data-driven smart mobility products in the electric golf cart market. All these elements are expected to influence significant trends in the golf cart market.
 Golf Cart Market Analysis and Segmental Data
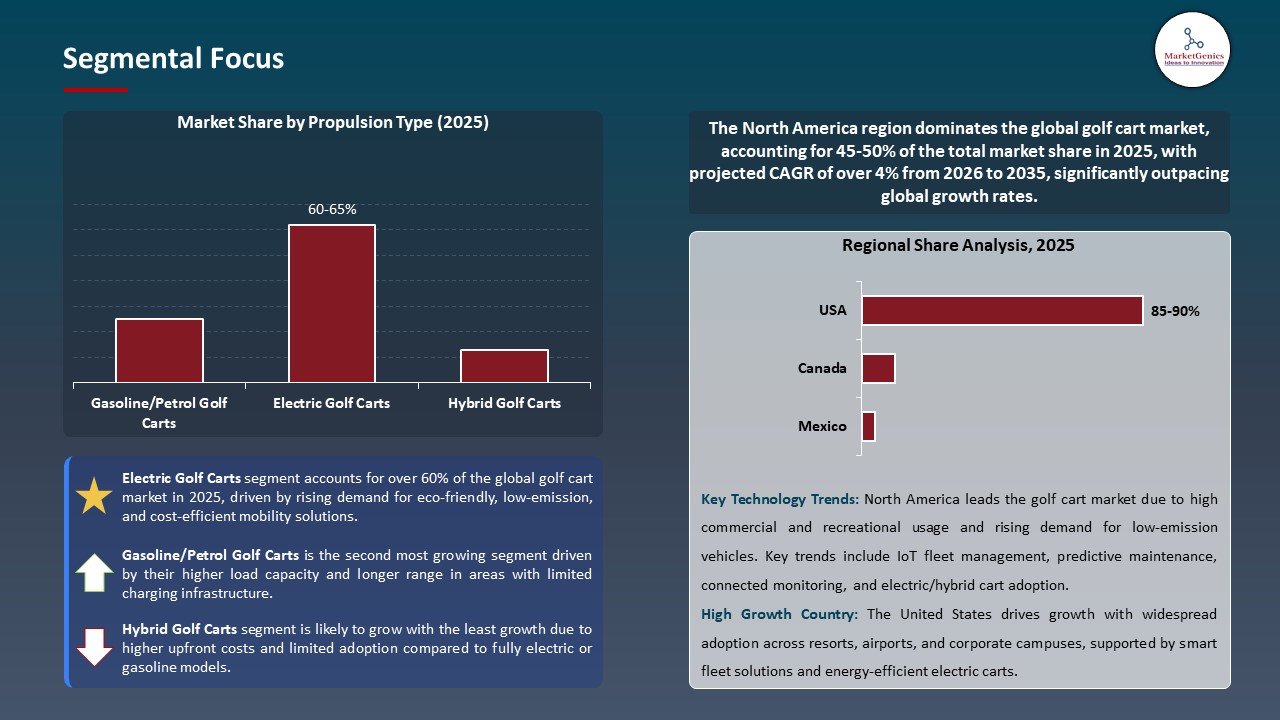
Electric Golf Carts Dominates Global Golf Cart Market amid Rising Eco-Friendly Mobility and Commercial Fleet Adoption
-
Electric golf cart segment leads the global market because of its environmentally-beneficial operation, its relatively low maintenance costs compared to nickel-cadmium recharges of gasoline-propelled carts, and its energy-efficient sources of power. The rise in sustainability mandates/initiatives and regulatory incentives for reducing emissions is leading resorts, campuses, and other commercial properties to implement an electric fleet.
- In addition, the explosion of application of electric carts for commercial fleet services, such as airports, hospitals, and industrial complexes, and now even gated communities, further indicates the fast growth and expansion of electric golf carts in commercial applications to support improved passenger mobility. In May 2025, Garia Automotive App. launched 200 premium electric carts enabled with GPS tracking and advanced battery-monitoring capabilities, in a major international airport located in the Arabian Peninsula.
- Latest innovations in battery technologies, such as lithium-ion and many other types of batteries, regenerative braking systems, and IoT-enabled management systems for fleet operations, have allowed for improvements in performance, efficiency, logistical safety, predictive maintenance, and optimization of routing schedules for operating a fleet.
North America Dominates Golf Cart Market amid High Commercial Adoption and Advanced Mobility Infrastructure
-
The golf cart market globally has North America leading with numerous commercial applications for electric vehicles, government support for regulatory environments to make electric systems widely accepted and developed infrastructure to utilize in both leisure and institutional usage. Along with many golf courses, resorts, corporate campuses, and gated communities which are predominantly utilizing electric and utility cart applications. This is because of cost efficiency, reliability, and sustainability of electric vehicles.
- Further, advancements in technology such as fleet management systems, GPS tracking, IoT monitoring, and lithium-ion batteries have contributed significantly to the continued growth of this market. For instance, in June 2025, Taylor-Dunn provided a fleet of 120 electric utility carts to a large logistics and warehouse operator in California that were outfitted with telematics and predictive maintenance features to improve operational efficiency and decrease downtime.
- The growing interest in low-emission transport solutions and the increasing demand for low-cost and scalable fleet solutions in resorts, campuses, and industrial complexes is driving North America’s continued success in this space. The combination of technological innovation, widespread commercial application, and a solid infrastructure base continue to cement North America’s position as the leader in the global golf cart market.
Golf Cart Market Ecosystem
The major vehicle rental companies include Enterprise Rent‐A‐Car, Hertz Corporation, Avis Budget Group, Sixt SE, National Car Rental, and Europcar Mobility Group. The industry has become increasingly consolidated since these companies are using advanced technologies (digital platforms, connected vehicle telematics, and customer engagement systems) to streamline operations and offer superior service.
Key players are targeting niche, specialized solutions that drive innovation in vehicle rental through the following: Subscription vehicle rentals, Peer‐to‐peer vehicle rental companies such as Turo, Integration of smart cities with vehicle rental offerings via real‐time booking, contactless pick‐up, and predictive maintenance tools. In addition to enhancing the customer offering, this approach enhances responsiveness to changes in consumer demand for vehicle rental services.
The Federal Government provides funding for research and development and supports innovation in the vehicle rental space through partnerships with mobility technology companies. For example, in May 2024, the U.S. Department of Transportation launched a connected vehicle pilot program with several mobility technology companies to improve route efficiency and reduce idle time for shared mobility services by utilizing real‐time traffic and rental fleet telematics data.
Companies are focusing on product diversification and integrated solutions to raise sustainability and efficiency. They are also including electric and hybrid vehicle fleets as well as digital platform upgrades in their strategies. Sixt SE for instance, they launched an AI based dynamic pricing engine in October 2025 which resulted in a 15% increase in booking conversion rates they also optimized yield management over the peak travel periods.
 Recent Development and Strategic Overview:
-
In August 2025, E-Z-GO rolled out its latest enhanced RXV Golf Car during the 2026 model year that incorporates Samsung SDI lithium-ion battery technology with an 8-year warranty, giving them additional range and durability for recreation and commercial use. This upgrade shows how the industry's utilization of extremely sophisticated battery systems has progressed, which ultimately enhances performance, reliability and sustainability for electric golf carts.
- In March 2025, Textron Inc.'s E-Z-GO entered into an agreement with a significant network of resort operators to provide electric golf carts for the operators' fleets as part of their expansion of premium fleet deployments and demonstrates the increased acceptance of electric mobility solutions within hospitality/leisure industries on an institutional basis. The deployment also highlights the trend in the market towards custom electric carts designed specifically for larger-scale operations.
Report Scope
|
Attribute |
Detail |
|
Market Size in 2025 |
USD 2.1 Bn |
|
Market Forecast Value in 2035 |
USD 3.9 Bn |
|
Growth Rate (CAGR) |
6.5% |
|
Forecast Period |
2026 – 2035 |
|
Historical Data Available for |
2021 – 2024 |
|
Market Size Units |
USD Bn for Value Thousand Units for Volume |
|
Report Format |
Electronic (PDF) + Excel |
|
Regions and Countries Covered |
|||||
|
North America |
Europe |
Asia Pacific |
Middle East |
Africa |
South America |
|
|
|
|
|
|
|
Companies Covered |
|||||
|
|
|
|
|
|
Golf Cart Market Segmentation and Highlights
|
Segment |
Sub-segment |
|
Golf Cart Market, By Component |
|
|
Golf Cart Market, By Propulsion Type |
|
|
Golf Cart Market, By Seating Capacity |
|
|
Golf Cart Market, By Drive Type |
|
|
Golf Cart Market, By Customization Level |
|
|
Golf Cart Market, By Terrain Capability |
|
|
Golf Cart Market, By Application |
|
|
Golf Cart Market, By End‑User |
|
|
Golf Cart Market, By Distribution Channel |
|
Frequently Asked Questions
Table of Contents
- 1. Research Methodology and Assumptions
- 1.1. Definitions
- 1.2. Research Design and Approach
- 1.3. Data Collection Methods
- 1.4. Base Estimates and Calculations
- 1.5. Forecasting Models
- 1.5.1. Key Forecast Factors & Impact Analysis
- 1.6. Secondary Research
- 1.6.1. Open Sources
- 1.6.2. Paid Databases
- 1.6.3. Associations
- 1.7. Primary Research
- 1.7.1. Primary Sources
- 1.7.2. Primary Interviews with Stakeholders across Ecosystem
- 2. Executive Summary
- 2.1. Global Golf Cart Market Outlook
- 2.1.1. Golf Cart Market Size (Value - US$ Bn and Volume - Thousand Units), and Forecasts, 2021-2035
- 2.1.2. Compounded Annual Growth Rate Analysis
- 2.1.3. Growth Opportunity Analysis
- 2.1.4. Segmental Share Analysis
- 2.1.5. Geographical Share Analysis
- 2.2. Market Analysis and Facts
- 2.3. Supply-Demand Analysis
- 2.4. Competitive Benchmarking
- 2.5. Go-to- Market Strategy
- 2.5.1. Customer/ End-use Industry Assessment
- 2.5.2. Growth Opportunity Data, 2026-2035
- 2.5.2.1. Regional Data
- 2.5.2.2. Country Data
- 2.5.2.3. Segmental Data
- 2.5.3. Identification of Potential Market Spaces
- 2.5.4. GAP Analysis
- 2.5.5. Potential Attractive Price Points
- 2.5.6. Prevailing Market Risks & Challenges
- 2.5.7. Preferred Sales & Marketing Strategies
- 2.5.8. Key Recommendations and Analysis
- 2.5.9. A Way Forward
- 2.1. Global Golf Cart Market Outlook
- 3. Industry Data and Premium Insights
- 3.1. Global Automotive & Transportation Ecosystem Overview, 2025
- 3.1.1. Automotive & Transportation Industry Analysis
- 3.1.2. Key Trends for Automotive & Transportation Industry
- 3.1.3. Regional Distribution for Automotive & Transportation Industry
- 3.2. Supplier Customer Data
- 3.3. Technology Roadmap and Developments
- 3.4. Trade Analysis
- 3.4.1. Import & Export Analysis, 2025
- 3.4.2. Top Importing Countries
- 3.4.3. Top Exporting Countries
- 3.5. Trump Tariff Impact Analysis
- 3.5.1. Manufacturer
- 3.5.1.1. Based on the component & Raw material
- 3.5.2. Supply Chain
- 3.5.3. End Consumer
- 3.5.1. Manufacturer
- 3.6. Raw Material Analysis
- 3.1. Global Automotive & Transportation Ecosystem Overview, 2025
- 4. Market Overview
- 4.1. Market Dynamics
- 4.1.1. Drivers
- 4.1.1.1. Growing use of golf carts across resorts, golf courses, campuses, and gated communities.
- 4.1.1.2. Rising demand for electric and low-emission vehicles for short-distance and on-site mobility.
- 4.1.1.3. Increasing adoption of golf carts in commercial and industrial applications such as warehouses and airports.
- 4.1.2. Restraints
- 4.1.2.1. High initial cost of advanced electric golf carts and battery maintenance.
- 4.1.2.2. Limited driving range and dependence on charging infrastructure.
- 4.1.1. Drivers
- 4.2. Key Trend Analysis
- 4.3. Regulatory Framework
- 4.3.1. Key Regulations, Norms, and Subsidies, by Key Countries
- 4.3.2. Tariffs and Standards
- 4.3.3. Impact Analysis of Regulations on the Market
- 4.4. Value Chain Analysis
- 4.4.1. Component Suppliers
- 4.4.2. Golf Cart Manufacturers
- 4.4.3. Dealers and Showroom Owners
- 4.4.4. End Users/ Customers
- 4.5. Cost Structure Analysis
- 4.5.1. Parameter’s Share for Cost Associated
- 4.5.2. COGP vs COGS
- 4.5.3. Profit Margin Analysis
- 4.6. Pricing Analysis
- 4.6.1. Regional Pricing Analysis
- 4.6.2. Segmental Pricing Trends
- 4.6.3. Factors Influencing Pricing
- 4.7. Porter’s Five Forces Analysis
- 4.8. PESTEL Analysis
- 4.9. Global Golf Cart Market Demand
- 4.9.1. Historical Market Size –Value (US$ Bn) and Volume (Thousand Units), 2020-2024
- 4.9.2. Current and Future Market Size –Value (US$ Bn) and Volume (Thousand Units), 2026–2035
- 4.9.2.1. Y-o-Y Growth Trends
- 4.9.2.2. Absolute $ Opportunity Assessment
- 4.1. Market Dynamics
- 5. Competition Landscape
- 5.1. Competition structure
- 5.1.1. Fragmented v/s consolidated
- 5.2. Company Share Analysis, 2025
- 5.2.1. Global Company Market Share
- 5.2.2. By Region
- 5.2.2.1. North America
- 5.2.2.2. Europe
- 5.2.2.3. Asia Pacific
- 5.2.2.4. Middle East
- 5.2.2.5. Africa
- 5.2.2.6. South America
- 5.3. Product Comparison Matrix
- 5.3.1. Specifications
- 5.3.2. Market Positioning
- 5.3.3. Pricing
- 5.1. Competition structure
- 6. Global Golf Cart Market Analysis, by Component
- 6.1. Key Segment Analysis
- 6.2. Golf Cart Market Size (Value - US$ Bn and Volume - Thousand Units), Analysis, and Forecasts, by Component, 2021-2035
- 6.2.1. Motors & Drivetrain
- 6.2.2. Battery
- 6.2.2.1. Lead‑Acid Battery
- 6.2.2.2. Lithium‑Ion Battery
- 6.2.2.3. Other Battery Types
- 6.2.3. Steering & Suspension
- 6.2.4. Body & Chassis
- 6.2.5. Accessories & Add‑ons
- 6.2.6. Others
- 7. Global Golf Cart Market Analysis, by Propulsion Type
- 7.1. Key Segment Analysis
- 7.2. Golf Cart Market Size (Value - US$ Bn and Volume - Thousand Units), Analysis, and Forecasts, by Propulsion Type, 2021-2035
- 7.2.1. Electric Golf Carts
- 7.2.2. Gasoline/Petrol Golf Carts
- 7.2.3. Hybrid Golf Carts
- 8. Global Golf Cart Market Analysis, by Seating Capacity
- 8.1. Key Segment Analysis
- 8.2. Golf Cart Market Size (Value - US$ Bn and Volume - Thousand Units), Analysis, and Forecasts, by Seating Capacity, 2021-2035
- 8.2.1. 2‑Seater Golf Carts
- 8.2.2. 4‑Seater Golf Carts
- 8.2.3. 6‑Seater and Above
- 9. Global Golf Cart Market Analysis, by Drive Type
- 9.1. Key Segment Analysis
- 9.2. Golf Cart Market Size (Value - US$ Bn and Volume - Thousand Units), Analysis, and Forecasts, by Drive Type, 2021-2035
- 9.2.1. 2WD (Two‑Wheel Drive)
- 9.2.2. 4WD (Four‑Wheel Drive)
- 10. Global Golf Cart Market Analysis, by Customization Level
- 10.1. Key Segment Analysis
- 10.2. Golf Cart Market Size (Value - US$ Bn and Volume - Thousand Units), Analysis, and Forecasts, by Customization Level, 2021-2035
- 10.2.1. Standard Models
- 10.2.2. Customized/Modified Carts
- 11. Global Golf Cart Market Analysis, by Terrain Capability
- 11.1. Key Segment Analysis
- 11.2. Golf Cart Market Size (Value - US$ Bn and Volume - Thousand Units), Analysis, and Forecasts, by Terrain Capability, 2021-2035
- 11.2.1. On‑Road
- 11.2.2. Off‑Road/All‑Terrain
- 12. Global Golf Cart Market Analysis, by Application
- 12.1. Key Segment Analysis
- 12.2. Golf Cart Market Size (Value - US$ Bn and Volume - Thousand Units), Analysis, and Forecasts, by Application, 2021-2035
- 12.2.1. Golf Courses
- 12.2.2. Personal/Recreational Use
- 12.2.3. Commercial Use (Hotels, Resorts, Parks)
- 12.2.4. Industrial/Factory Use
- 12.2.5. Campus/Community Transportation
- 12.2.6. Rental Services
- 12.2.7. Others
- 13. Global Golf Cart Market Analysis, by End‑User
- 13.1. Key Segment Analysis
- 13.2. Golf Cart Market Size (Value - US$ Bn and Volume - Thousand Units), Analysis, and Forecasts, by End‑User, 2021-2035
- 13.2.1. Individual Consumers
- 13.2.2. Commercial Buyers (Resorts, Parks, Enterprises)
- 13.2.3. Fleet Operators
- 13.2.4. Others
- 14. Global Golf Cart Market Analysis, by Distribution Channel
- 14.1. Key Segment Analysis
- 14.2. Golf Cart Market Size (Value - US$ Bn and Volume - Thousand Units), Analysis, and Forecasts, by Distribution Channel, 2021-2035
- 14.2.1. OEM/ Direct Sales
- 14.2.2. Dealership/Distributor Sales
- 14.2.3. Online Sales
- 15. Global Golf Cart Market Analysis and Forecasts, by Region
- 15.1. Key Findings
- 15.2. Golf Cart Market Size (Value - US$ Bn and Volume - Thousand Units), Analysis, and Forecasts, by Region, 2021-2035
- 15.2.1. North America
- 15.2.2. Europe
- 15.2.3. Asia Pacific
- 15.2.4. Middle East
- 15.2.5. Africa
- 15.2.6. South America
- 16. North America Golf Cart Market Analysis
- 16.1. Key Segment Analysis
- 16.2. Regional Snapshot
- 16.3. North America Golf Cart Market Size Value - US$ Bn and Volume - Thousand Units), Analysis, and Forecasts, 2021-2035
- 16.3.1. Component
- 16.3.2. Propulsion Type
- 16.3.3. Seating Capacity
- 16.3.4. Drive Type
- 16.3.5. Customization Level
- 16.3.6. Terrain Capability
- 16.3.7. Application
- 16.3.8. End-User
- 16.3.9. Distribution Channel
- 16.3.10. Country
- 16.3.10.1. USA
- 16.3.10.2. Canada
- 16.3.10.3. Mexico
- 16.4. USA Golf Cart Market
- 16.4.1. Country Segmental Analysis
- 16.4.2. Component
- 16.4.3. Propulsion Type
- 16.4.4. Seating Capacity
- 16.4.5. Drive Type
- 16.4.6. Customization Level
- 16.4.7. Terrain Capability
- 16.4.8. Application
- 16.4.9. End-User
- 16.4.10. Distribution Channel
- 16.5. Canada Golf Cart Market
- 16.5.1. Country Segmental Analysis
- 16.5.2. Component
- 16.5.3. Propulsion Type
- 16.5.4. Seating Capacity
- 16.5.5. Drive Type
- 16.5.6. Customization Level
- 16.5.7. Terrain Capability
- 16.5.8. Application
- 16.5.9. End-User
- 16.5.10. Distribution Channel
- 16.6. Mexico Golf Cart Market
- 16.6.1. Country Segmental Analysis
- 16.6.2. Component
- 16.6.3. Propulsion Type
- 16.6.4. Seating Capacity
- 16.6.5. Drive Type
- 16.6.6. Customization Level
- 16.6.7. Terrain Capability
- 16.6.8. Application
- 16.6.9. End-User
- 16.6.10. Distribution Channel
- 17. Europe Golf Cart Market Analysis
- 17.1. Key Segment Analysis
- 17.2. Regional Snapshot
- 17.3. Europe Golf Cart Market Size (Value - US$ Bn and Volume - Thousand Units), Analysis, and Forecasts, 2021-2035
- 17.3.1. Component
- 17.3.2. Propulsion Type
- 17.3.3. Seating Capacity
- 17.3.4. Drive Type
- 17.3.5. Customization Level
- 17.3.6. Terrain Capability
- 17.3.7. Application
- 17.3.8. End-User
- 17.3.9. Distribution Channel
- 17.3.10. Country
- 17.3.10.1. Germany
- 17.3.10.2. United Kingdom
- 17.3.10.3. France
- 17.3.10.4. Italy
- 17.3.10.5. Spain
- 17.3.10.6. Netherlands
- 17.3.10.7. Nordic Countries
- 17.3.10.8. Poland
- 17.3.10.9. Russia & CIS
- 17.3.10.10. Rest of Europe
- 17.4. Germany Golf Cart Market
- 17.4.1. Country Segmental Analysis
- 17.4.2. Component
- 17.4.3. Propulsion Type
- 17.4.4. Seating Capacity
- 17.4.5. Drive Type
- 17.4.6. Customization Level
- 17.4.7. Terrain Capability
- 17.4.8. Application
- 17.4.9. End-User
- 17.4.10. Distribution Channel
- 17.5. United Kingdom Golf Cart Market
- 17.5.1. Country Segmental Analysis
- 17.5.2. Component
- 17.5.3. Propulsion Type
- 17.5.4. Seating Capacity
- 17.5.5. Drive Type
- 17.5.6. Customization Level
- 17.5.7. Terrain Capability
- 17.5.8. Application
- 17.5.9. End-User
- 17.5.10. Distribution Channel
- 17.6. France Golf Cart Market
- 17.6.1. Country Segmental Analysis
- 17.6.2. Component
- 17.6.3. Propulsion Type
- 17.6.4. Seating Capacity
- 17.6.5. Drive Type
- 17.6.6. Customization Level
- 17.6.7. Terrain Capability
- 17.6.8. Application
- 17.6.9. End-User
- 17.6.10. Distribution Channel
- 17.7. Italy Golf Cart Market
- 17.7.1. Country Segmental Analysis
- 17.7.2. Component
- 17.7.3. Propulsion Type
- 17.7.4. Seating Capacity
- 17.7.5. Drive Type
- 17.7.6. Customization Level
- 17.7.7. Terrain Capability
- 17.7.8. Application
- 17.7.9. End-User
- 17.7.10. Distribution Channel
- 17.8. Spain Golf Cart Market
- 17.8.1. Country Segmental Analysis
- 17.8.2. Component
- 17.8.3. Propulsion Type
- 17.8.4. Seating Capacity
- 17.8.5. Drive Type
- 17.8.6. Customization Level
- 17.8.7. Terrain Capability
- 17.8.8. Application
- 17.8.9. End-User
- 17.8.10. Distribution Channel
- 17.9. Netherlands Golf Cart Market
- 17.9.1. Country Segmental Analysis
- 17.9.2. Component
- 17.9.3. Propulsion Type
- 17.9.4. Seating Capacity
- 17.9.5. Drive Type
- 17.9.6. Customization Level
- 17.9.7. Terrain Capability
- 17.9.8. Application
- 17.9.9. End-User
- 17.9.10. Distribution Channel
- 17.10. Nordic Countries Golf Cart Market
- 17.10.1. Country Segmental Analysis
- 17.10.2. Component
- 17.10.3. Propulsion Type
- 17.10.4. Seating Capacity
- 17.10.5. Drive Type
- 17.10.6. Customization Level
- 17.10.7. Terrain Capability
- 17.10.8. Application
- 17.10.9. End-User
- 17.10.10. Distribution Channel
- 17.11. Poland Golf Cart Market
- 17.11.1. Country Segmental Analysis
- 17.11.2. Component
- 17.11.3. Propulsion Type
- 17.11.4. Seating Capacity
- 17.11.5. Drive Type
- 17.11.6. Customization Level
- 17.11.7. Terrain Capability
- 17.11.8. Application
- 17.11.9. End-User
- 17.11.10. Distribution Channel
- 17.12. Russia & CIS Golf Cart Market
- 17.12.1. Country Segmental Analysis
- 17.12.2. Component
- 17.12.3. Propulsion Type
- 17.12.4. Seating Capacity
- 17.12.5. Drive Type
- 17.12.6. Customization Level
- 17.12.7. Terrain Capability
- 17.12.8. Application
- 17.12.9. End-User
- 17.12.10. Distribution Channel
- 17.13. Rest of Europe Golf Cart Market
- 17.13.1. Country Segmental Analysis
- 17.13.2. Component
- 17.13.3. Propulsion Type
- 17.13.4. Seating Capacity
- 17.13.5. Drive Type
- 17.13.6. Customization Level
- 17.13.7. Terrain Capability
- 17.13.8. Application
- 17.13.9. End-User
- 17.13.10. Distribution Channel
- 18. Asia Pacific Golf Cart Market Analysis
- 18.1. Key Segment Analysis
- 18.2. Regional Snapshot
- 18.3. Asia Pacific Golf Cart Market Size (Value - US$ Bn and Volume - Thousand Units), Analysis, and Forecasts, 2021-2035
- 18.3.1. Component
- 18.3.2. Propulsion Type
- 18.3.3. Seating Capacity
- 18.3.4. Drive Type
- 18.3.5. Customization Level
- 18.3.6. Terrain Capability
- 18.3.7. Application
- 18.3.8. End-User
- 18.3.9. Distribution Channel
- 18.3.10. Country
- 18.3.10.1. China
- 18.3.10.2. India
- 18.3.10.3. Japan
- 18.3.10.4. South Korea
- 18.3.10.5. Australia and New Zealand
- 18.3.10.6. Indonesia
- 18.3.10.7. Malaysia
- 18.3.10.8. Thailand
- 18.3.10.9. Vietnam
- 18.3.10.10. Rest of Asia Pacific
- 18.4. China Golf Cart Market
- 18.4.1. Country Segmental Analysis
- 18.4.2. Component
- 18.4.3. Propulsion Type
- 18.4.4. Seating Capacity
- 18.4.5. Drive Type
- 18.4.6. Customization Level
- 18.4.7. Terrain Capability
- 18.4.8. Application
- 18.4.9. End-User
- 18.4.10. Distribution Channel
- 18.5. India Golf Cart Market
- 18.5.1. Country Segmental Analysis
- 18.5.2. Component
- 18.5.3. Propulsion Type
- 18.5.4. Seating Capacity
- 18.5.5. Drive Type
- 18.5.6. Customization Level
- 18.5.7. Terrain Capability
- 18.5.8. Application
- 18.5.9. End-User
- 18.5.10. Distribution Channel
- 18.6. Japan Golf Cart Market
- 18.6.1. Country Segmental Analysis
- 18.6.2. Component
- 18.6.3. Propulsion Type
- 18.6.4. Seating Capacity
- 18.6.5. Drive Type
- 18.6.6. Customization Level
- 18.6.7. Terrain Capability
- 18.6.8. Application
- 18.6.9. End-User
- 18.6.10. Distribution Channel
- 18.7. South Korea Golf Cart Market
- 18.7.1. Country Segmental Analysis
- 18.7.2. Component
- 18.7.3. Propulsion Type
- 18.7.4. Seating Capacity
- 18.7.5. Drive Type
- 18.7.6. Customization Level
- 18.7.7. Terrain Capability
- 18.7.8. Application
- 18.7.9. End-User
- 18.7.10. Distribution Channel
- 18.8. Australia and New Zealand Golf Cart Market
- 18.8.1. Country Segmental Analysis
- 18.8.2. Component
- 18.8.3. Propulsion Type
- 18.8.4. Seating Capacity
- 18.8.5. Drive Type
- 18.8.6. Customization Level
- 18.8.7. Terrain Capability
- 18.8.8. Application
- 18.8.9. End-User
- 18.8.10. Distribution Channel
- 18.9. Indonesia Golf Cart Market
- 18.9.1. Country Segmental Analysis
- 18.9.2. Component
- 18.9.3. Propulsion Type
- 18.9.4. Seating Capacity
- 18.9.5. Drive Type
- 18.9.6. Customization Level
- 18.9.7. Terrain Capability
- 18.9.8. Application
- 18.9.9. End-User
- 18.9.10. Distribution Channel
- 18.10. Malaysia Golf Cart Market
- 18.10.1. Country Segmental Analysis
- 18.10.2. Component
- 18.10.3. Propulsion Type
- 18.10.4. Seating Capacity
- 18.10.5. Drive Type
- 18.10.6. Customization Level
- 18.10.7. Terrain Capability
- 18.10.8. Application
- 18.10.9. End-User
- 18.10.10. Distribution Channel
- 18.11. Thailand Golf Cart Market
- 18.11.1. Country Segmental Analysis
- 18.11.2. Component
- 18.11.3. Propulsion Type
- 18.11.4. Seating Capacity
- 18.11.5. Drive Type
- 18.11.6. Customization Level
- 18.11.7. Terrain Capability
- 18.11.8. Application
- 18.11.9. End-User
- 18.11.10. Distribution Channel
- 18.12. Vietnam Golf Cart Market
- 18.12.1. Country Segmental Analysis
- 18.12.2. Component
- 18.12.3. Propulsion Type
- 18.12.4. Seating Capacity
- 18.12.5. Drive Type
- 18.12.6. Customization Level
- 18.12.7. Terrain Capability
- 18.12.8. Application
- 18.12.9. End-User
- 18.12.10. Distribution Channel
- 18.13. Rest of Asia Pacific Golf Cart Market
- 18.13.1. Country Segmental Analysis
- 18.13.2. Component
- 18.13.3. Propulsion Type
- 18.13.4. Seating Capacity
- 18.13.5. Drive Type
- 18.13.6. Customization Level
- 18.13.7. Terrain Capability
- 18.13.8. Application
- 18.13.9. End-User
- 18.13.10. Distribution Channel
- 19. Middle East Golf Cart Market Analysis
- 19.1. Key Segment Analysis
- 19.2. Regional Snapshot
- 19.3. Middle East Golf Cart Market Size (Value - US$ Bn and Volume - Thousand Units), Analysis, and Forecasts, 2021-2035
- 19.3.1. Component
- 19.3.2. Propulsion Type
- 19.3.3. Seating Capacity
- 19.3.4. Drive Type
- 19.3.5. Customization Level
- 19.3.6. Terrain Capability
- 19.3.7. Application
- 19.3.8. End-User
- 19.3.9. Distribution Channel
- 19.3.10. Country
- 19.3.10.1. Turkey
- 19.3.10.2. UAE
- 19.3.10.3. Saudi Arabia
- 19.3.10.4. Israel
- 19.3.10.5. Rest of Middle East
- 19.4. Turkey Golf Cart Market
- 19.4.1. Country Segmental Analysis
- 19.4.2. Component
- 19.4.3. Propulsion Type
- 19.4.4. Seating Capacity
- 19.4.5. Drive Type
- 19.4.6. Customization Level
- 19.4.7. Terrain Capability
- 19.4.8. Application
- 19.4.9. End-User
- 19.4.10. Distribution Channel
- 19.5. UAE Golf Cart Market
- 19.5.1. Country Segmental Analysis
- 19.5.2. Component
- 19.5.3. Propulsion Type
- 19.5.4. Seating Capacity
- 19.5.5. Drive Type
- 19.5.6. Customization Level
- 19.5.7. Terrain Capability
- 19.5.8. Application
- 19.5.9. End-User
- 19.5.10. Distribution Channel
- 19.6. Saudi Arabia Golf Cart Market
- 19.6.1. Country Segmental Analysis
- 19.6.2. Component
- 19.6.3. Propulsion Type
- 19.6.4. Seating Capacity
- 19.6.5. Drive Type
- 19.6.6. Customization Level
- 19.6.7. Terrain Capability
- 19.6.8. Application
- 19.6.9. End-User
- 19.6.10. Distribution Channel
- 19.7. Israel Golf Cart Market
- 19.7.1. Country Segmental Analysis
- 19.7.2. Component
- 19.7.3. Propulsion Type
- 19.7.4. Seating Capacity
- 19.7.5. Drive Type
- 19.7.6. Customization Level
- 19.7.7. Terrain Capability
- 19.7.8. Application
- 19.7.9. End-User
- 19.7.10. Distribution Channel
- 19.8. Rest of Middle East Golf Cart Market
- 19.8.1. Country Segmental Analysis
- 19.8.2. Component
- 19.8.3. Propulsion Type
- 19.8.4. Seating Capacity
- 19.8.5. Drive Type
- 19.8.6. Customization Level
- 19.8.7. Terrain Capability
- 19.8.8. Application
- 19.8.9. End-User
- 19.8.10. Distribution Channel
- 20. Africa Golf Cart Market Analysis
- 20.1. Key Segment Analysis
- 20.2. Regional Snapshot
- 20.3. Africa Golf Cart Market Size (Value - US$ Bn and Volume - Thousand Units), Analysis, and Forecasts, 2021-2035
- 20.3.1. Component
- 20.3.2. Propulsion Type
- 20.3.3. Seating Capacity
- 20.3.4. Drive Type
- 20.3.5. Customization Level
- 20.3.6. Terrain Capability
- 20.3.7. Application
- 20.3.8. End-User
- 20.3.9. Distribution Channel
- 20.3.10. Country
- 20.3.10.1. South Africa
- 20.3.10.2. Egypt
- 20.3.10.3. Nigeria
- 20.3.10.4. Algeria
- 20.3.10.5. Rest of Africa
- 20.4. South Africa Golf Cart Market
- 20.4.1. Country Segmental Analysis
- 20.4.2. Component
- 20.4.3. Propulsion Type
- 20.4.4. Seating Capacity
- 20.4.5. Drive Type
- 20.4.6. Customization Level
- 20.4.7. Terrain Capability
- 20.4.8. Application
- 20.4.9. End-User
- 20.4.10. Distribution Channel
- 20.5. Egypt Golf Cart Market
- 20.5.1. Country Segmental Analysis
- 20.5.2. Component
- 20.5.3. Propulsion Type
- 20.5.4. Seating Capacity
- 20.5.5. Drive Type
- 20.5.6. Customization Level
- 20.5.7. Terrain Capability
- 20.5.8. Application
- 20.5.9. End-User
- 20.5.10. Distribution Channel
- 20.6. Nigeria Golf Cart Market
- 20.6.1. Country Segmental Analysis
- 20.6.2. Component
- 20.6.3. Propulsion Type
- 20.6.4. Seating Capacity
- 20.6.5. Drive Type
- 20.6.6. Customization Level
- 20.6.7. Terrain Capability
- 20.6.8. Application
- 20.6.9. End-User
- 20.6.10. Distribution Channel
- 20.7. Algeria Golf Cart Market
- 20.7.1. Country Segmental Analysis
- 20.7.2. Component
- 20.7.3. Propulsion Type
- 20.7.4. Seating Capacity
- 20.7.5. Drive Type
- 20.7.6. Customization Level
- 20.7.7. Terrain Capability
- 20.7.8. Application
- 20.7.9. End-User
- 20.7.10. Distribution Channel
- 20.8. Rest of Africa Golf Cart Market
- 20.8.1. Country Segmental Analysis
- 20.8.2. Component
- 20.8.3. Propulsion Type
- 20.8.4. Seating Capacity
- 20.8.5. Drive Type
- 20.8.6. Customization Level
- 20.8.7. Terrain Capability
- 20.8.8. Application
- 20.8.9. End-User
- 20.8.10. Distribution Channel
- 21. South America Golf Cart Market Analysis
- 21.1. Key Segment Analysis
- 21.2. Regional Snapshot
- 21.3. South America Golf Cart Market Size (Value - US$ Bn and Volume - Thousand Units), Analysis, and Forecasts, 2021-2035
- 21.3.1. Component
- 21.3.2. Propulsion Type
- 21.3.3. Seating Capacity
- 21.3.4. Drive Type
- 21.3.5. Customization Level
- 21.3.6. Terrain Capability
- 21.3.7. Application
- 21.3.8. End-User
- 21.3.9. Distribution Channel
- 21.3.10. Country
- 21.3.10.1. Brazil
- 21.3.10.2. Argentina
- 21.3.10.3. Rest of South America
- 21.4. Brazil Golf Cart Market
- 21.4.1. Country Segmental Analysis
- 21.4.2. Component
- 21.4.3. Propulsion Type
- 21.4.4. Seating Capacity
- 21.4.5. Drive Type
- 21.4.6. Customization Level
- 21.4.7. Terrain Capability
- 21.4.8. Application
- 21.4.9. End-User
- 21.4.10. Distribution Channel
- 21.5. Argentina Golf Cart Market
- 21.5.1. Country Segmental Analysis
- 21.5.2. Component
- 21.5.3. Propulsion Type
- 21.5.4. Seating Capacity
- 21.5.5. Drive Type
- 21.5.6. Customization Level
- 21.5.7. Terrain Capability
- 21.5.8. Application
- 21.5.9. End-User
- 21.5.10. Distribution Channel
- 21.6. Rest of South America Golf Cart Market
- 21.6.1. Country Segmental Analysis
- 21.6.2. Component
- 21.6.3. Propulsion Type
- 21.6.4. Seating Capacity
- 21.6.5. Drive Type
- 21.6.6. Customization Level
- 21.6.7. Terrain Capability
- 21.6.8. Application
- 21.6.9. End-User
- 21.6.10. Distribution Channel
- 22. Key Players/ Company Profile
- 22.1. Advanced EV (AEV)
- 22.1.1. Company Details/ Overview
- 22.1.2. Company Financials
- 22.1.3. Key Customers and Competitors
- 22.1.4. Business/ Industry Portfolio
- 22.1.5. Product Portfolio/ Specification Details
- 22.1.6. Pricing Data
- 22.1.7. Strategic Overview
- 22.1.8. Recent Developments
- 22.2. Beaster
- 22.3. Bintelli Electric Vehicles
- 22.4. Chevo Electric Vehicles
- 22.5. Club Car (Ingersoll‑Rand)
- 22.6. Columbia Vehicle Group
- 22.7. Cushman (Textron Inc.)
- 22.8. Evolution EV
- 22.9. E‑Z‑GO (Textron Inc.)
- 22.10. Garia A/S
- 22.11. Grin Technologies
- 22.12. ICON Electric Vehicles
- 22.13. Melex Golf Carts
- 22.14. Polaris Inc. (GEM)
- 22.15. Star EV
- 22.16. Taylor‑Dunn
- 22.17. Trojan Battery
- 22.18. UltraGolf Carts
- 22.19. Yamaha Golf‑Car Company
- 22.20. Other Key Playerss
- 22.1. Advanced EV (AEV)
Note* - This is just tentative list of players. While providing the report, we will cover more number of players based on their revenue and share for each geography
Research Design
Our research design integrates both demand-side and supply-side analysis through a balanced combination of primary and secondary research methodologies. By utilizing both bottom-up and top-down approaches alongside rigorous data triangulation methods, we deliver robust market intelligence that supports strategic decision-making.
MarketGenics' comprehensive research design framework ensures the delivery of accurate, reliable, and actionable market intelligence. Through the integration of multiple research approaches, rigorous validation processes, and expert analysis, we provide our clients with the insights needed to make informed strategic decisions and capitalize on market opportunities.

MarketGenics leverages a dedicated industry panel of experts and a comprehensive suite of paid databases to effectively collect, consolidate, and analyze market intelligence.
Our approach has consistently proven to be reliable and effective in generating accurate market insights, identifying key industry trends, and uncovering emerging business opportunities.
Through both primary and secondary research, we capture and analyze critical company-level data such as manufacturing footprints, including technical centers, R&D facilities, sales offices, and headquarters.
Our expert panel further enhances our ability to estimate market size for specific brands based on validated field-level intelligence.
Our data mining techniques incorporate both parametric and non-parametric methods, allowing for structured data collection, sorting, processing, and cleaning.
Demand projections are derived from large-scale data sets analyzed through proprietary algorithms, culminating in robust and reliable market sizing.
Research Approach
The bottom-up approach builds market estimates by starting with the smallest addressable market units and systematically aggregating them to create comprehensive market size projections.
This method begins with specific, granular data points and builds upward to create the complete market landscape.
Customer Analysis → Segmental Analysis → Geographical Analysis
The top-down approach starts with the broadest possible market data and systematically narrows it down through a series of filters and assumptions to arrive at specific market segments or opportunities.
This method begins with the big picture and works downward to increasingly specific market slices.
TAM → SAM → SOM


Research Methods
Desk / Secondary Research
While analysing the market, we extensively study secondary sources, directories, and databases to identify and collect information useful for this technical, market-oriented, and commercial report. Secondary sources that we utilize are not only the public sources, but it is a combination of Open Source, Associations, Paid Databases, MG Repository & Knowledgebase, and others.
- Company websites, annual reports, financial reports, broker reports, and investor presentations
- National government documents, statistical databases and reports
- News articles, press releases and web-casts specific to the companies operating in the market, Magazines, reports, and others
- We gather information from commercial data sources for deriving company specific data such as segmental revenue, share for geography, product revenue, and others
- Internal and external proprietary databases (industry-specific), relevant patent, and regulatory databases
- Governing Bodies, Government Organizations
- Relevant Authorities, Country-specific Associations for Industries
We also employ the model mapping approach to estimate the product level market data through the players' product portfolio
Primary Research
Primary research/ interviews is vital in analyzing the market. Most of the cases involves paid primary interviews. Primary sources include primary interviews through e-mail interactions, telephonic interviews, surveys as well as face-to-face interviews with the different stakeholders across the value chain including several industry experts.
| Type of Respondents | Number of Primaries |
|---|---|
| Tier 2/3 Suppliers | ~20 |
| Tier 1 Suppliers | ~25 |
| End-users | ~25 |
| Industry Expert/ Panel/ Consultant | ~30 |
| Total | ~100 |
MG Knowledgebase
• Repository of industry blog, newsletter and case studies
• Online platform covering detailed market reports, and company profiles
Forecasting Factors and Models
Forecasting Factors
- Historical Trends – Past market patterns, cycles, and major events that shaped how markets behave over time. Understanding past trends helps predict future behavior.
- Industry Factors – Specific characteristics of the industry like structure, regulations, and innovation cycles that affect market dynamics.
- Macroeconomic Factors – Economic conditions like GDP growth, inflation, and employment rates that affect how much money people have to spend.
- Demographic Factors – Population characteristics like age, income, and location that determine who can buy your product.
- Technology Factors – How quickly people adopt new technology and how much technology infrastructure exists.
- Regulatory Factors – Government rules, laws, and policies that can help or restrict market growth.
- Competitive Factors – Analyzing competition structure such as degree of competition and bargaining power of buyers and suppliers.
Forecasting Models / Techniques
Multiple Regression Analysis
- Identify and quantify factors that drive market changes
- Statistical modeling to establish relationships between market drivers and outcomes
Time Series Analysis – Seasonal Patterns
- Understand regular cyclical patterns in market demand
- Advanced statistical techniques to separate trend, seasonal, and irregular components
Time Series Analysis – Trend Analysis
- Identify underlying market growth patterns and momentum
- Statistical analysis of historical data to project future trends
Expert Opinion – Expert Interviews
- Gather deep industry insights and contextual understanding
- In-depth interviews with key industry stakeholders
Multi-Scenario Development
- Prepare for uncertainty by modeling different possible futures
- Creating optimistic, pessimistic, and most likely scenarios
Time Series Analysis – Moving Averages
- Sophisticated forecasting for complex time series data
- Auto-regressive integrated moving average models with seasonal components
Econometric Models
- Apply economic theory to market forecasting
- Sophisticated economic models that account for market interactions
Expert Opinion – Delphi Method
- Harness collective wisdom of industry experts
- Structured, multi-round expert consultation process
Monte Carlo Simulation
- Quantify uncertainty and probability distributions
- Thousands of simulations with varying input parameters
Research Analysis
Our research framework is built upon the fundamental principle of validating market intelligence from both demand and supply perspectives. This dual-sided approach ensures comprehensive market understanding and reduces the risk of single-source bias.
Demand-Side Analysis: We understand end-user/application behavior, preferences, and market needs along with the penetration of the product for specific application.
Supply-Side Analysis: We estimate overall market revenue, analyze the segmental share along with industry capacity, competitive landscape, and market structure.
Validation & Evaluation
Data triangulation is a validation technique that uses multiple methods, sources, or perspectives to examine the same research question, thereby increasing the credibility and reliability of research findings. In market research, triangulation serves as a quality assurance mechanism that helps identify and minimize bias, validate assumptions, and ensure accuracy in market estimates.
- Data Source Triangulation – Using multiple data sources to examine the same phenomenon
- Methodological Triangulation – Using multiple research methods to study the same research question
- Investigator Triangulation – Using multiple researchers or analysts to examine the same data
- Theoretical Triangulation – Using multiple theoretical perspectives to interpret the same data

Custom Market Research Services
We will customise the research for you, in case the report listed above does not meet your requirements.
Get 10% Free Customisation