Metaverse Market Size, Share & Trends Analysis Report by Component (Hardware, Software, Services), Platform, Technology, Application, End-Use Industry, Offering Type, Deployment Mode, and Geography (North America, Europe, Asia Pacific, Middle East, Africa, and South America) – Global Industry Data, Trends, and Forecasts, 2026–2035
|
|
|
Segmental Data Insights |
|
|
Demand Trends |
|
|
Competitive Landscape |
|
|
Strategic Development |
|
|
Future Outlook & Opportunities |
|
Metaverse Market Size, Share, and Growth
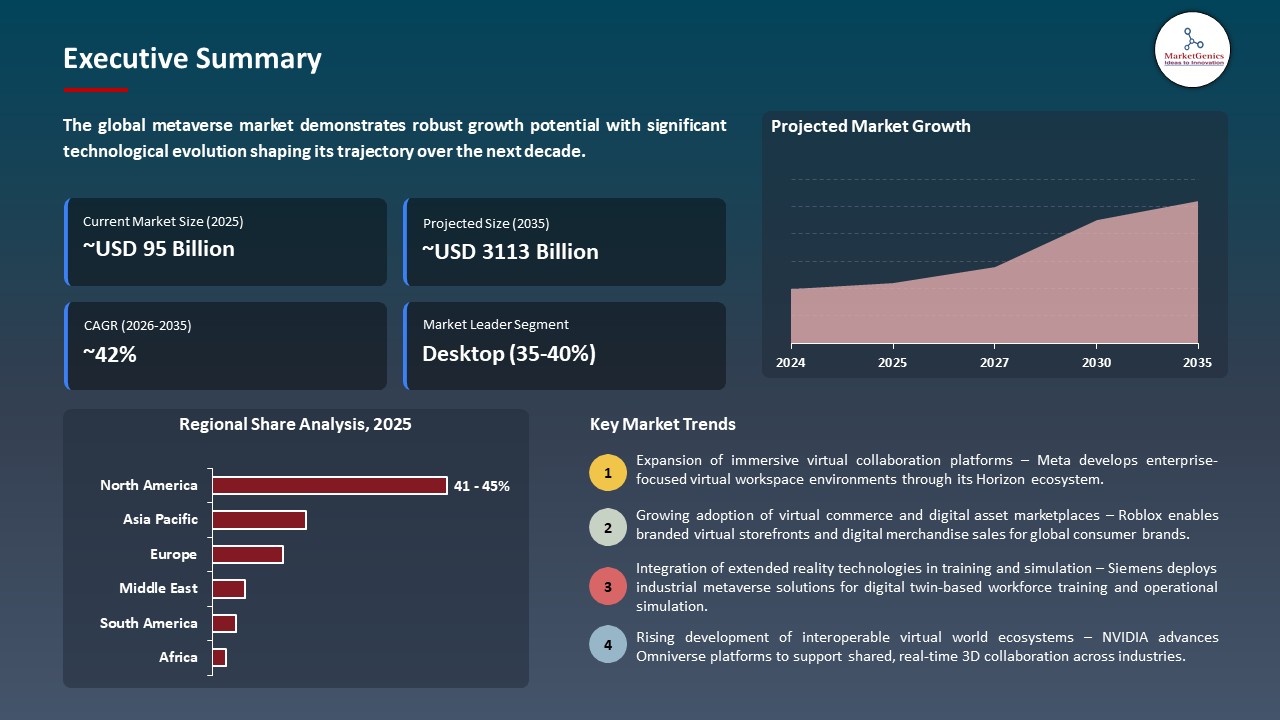
The global metaverse market is witnessing strong growth, valued at USD 94.7 billion in 2025 and projected to reach USD 3112.5 billion by 2035, expanding at a CAGR of 41.8% during the forecast period. The high-tech VR/AR devices, artificial intelligence-driven avatars, and cloud-based rendering technologies contribute to the development of the global metaverse market where enterprises and consumers can engage in real-time interaction in immersive, persistent, and fully customizable virtual environments.
Jensen Huang, founder and CEO at NVIDIA, said: Physical AI will revolutionize the $50 trillion manufacturing and logistics industries. Everything that moves from cars and trucks to factories and warehouses will be robotic and embodied by AI. NVIDIA’s Omniverse digital twin operating system and Cosmos physical AI serve as the foundational libraries for digitalizing the world’s physical industries.
The global metaverse market is growing quickly with more and more enterprises and consumers demanding immersive digital experiences with social, gaming and enterprise application. Realistic interactive VR/AR hardware, haptic devices, AI-driven avatars, and cloud-based rendering engines are making possible realistic virtual worlds, which are engaging, creative, and collaborative.
The use of AI to generate content, digital twins, and multi-user persistent worlds are enabling companies to model real-world operations, train, and create virtual commerce experiences, at a lower cost and with accelerated decision making. The large-scale, immersive metaverse experiences are becoming more available and scalable to industries using cloud infrastructure, edge computing, and low-latency networks.
The adjacent opportunities within the market are generating new sources of revenue, such as virtual real estate, NFT-based digital assets, enterprise collaboration platforms, and immersive e-commerce. Through innovative designs that are highly engaging, scalable, and persistent, the metaverse is changing the way people interact online and how business is conducted by organizations and bringing innovation, operational efficiency, and new types of value creation to industries across the globe.
 Metaverse Market Dynamics and Trends
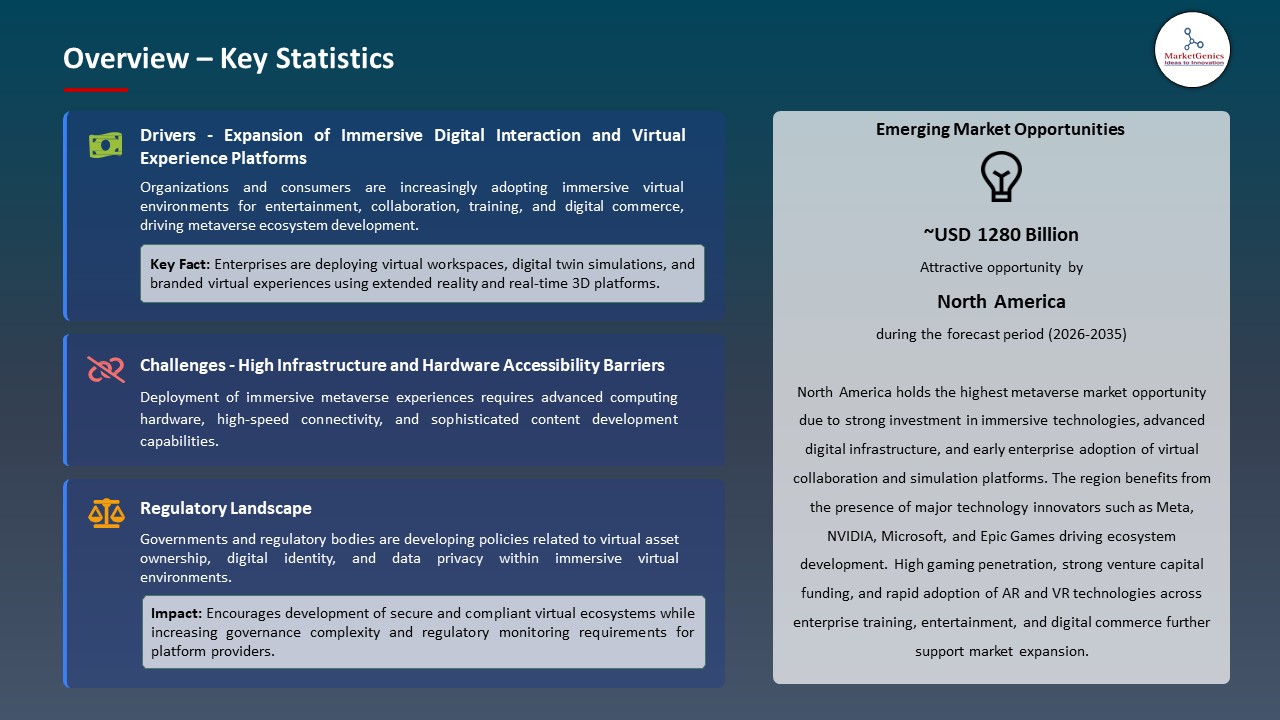
Driver: Increasing Adoption of Virtual and Augmented Reality Technologies
-
The growth in the need of immersion in the digital environment is causing the introduction of visual reality and augmented reality technologies into businesses and consumer segments to allow interactive training, remote working, and future-oriented gaming.
- VR/AR headsets, haptic systems, motion-tracking and more are offering realistic, intuitive, and personalized virtual worlds. For instance, in October 2025, Samsung introduced the Galaxy XR headset, which was based on Android XR, allowing immersive gaming, AR/VR applications, and WebXR content to be used, to increase metaverse interaction in enterprises and consumers.
- VR/AR + AI-based analytics and cloud solutions can be used to improve user interaction, operational efficiency, and decision-making in the field of education, retail, and industry use.
Restraint: High Infrastructure Costs and Technical Complexity
-
The high cost of VR/AR devices and haptics, motion-tracking platforms, cloud-rendering systems, and edge computing systems limit the use of metaverse solutions, especially in small and mid-sized businesses.
- Ongoing maintenance fees, such as software subscriptions, 3D content updates, and specialized technical support are barriers to operations and slow to scale to large enterprises, reducing ROI in smaller business models.
- Poor broadband and device interoperability and availability of skilled developers are barriers to large-scale adoption of the metaverse and interoperability.
Opportunity: Expansion into Enterprise and Virtual Commerce Applications
-
The combination of AI-based avatars, blockchain, and VR/AR-enabled solutions is establishing new prospects in the metaverse market through the development of immersive enterprise collaboration, virtual training, and digital business experience.
- Real-time analytics and smart virtual assistants are used to assist businesses in streamlining operations. In January 2025, NVIDIA introduced Omniverse with generative physical AI and allowed the company partners such as Accenture, Microsoft and Siemens to design digital twin and virtual commerce environments.
- Virtual marketplaces and Metaverse enterprise-centric solutions have the potential to drive revenue and offer scalable and immersive business solutions.
Key Trend: Rise of Social and Gaming Metaverses
-
The metaverse market is growing and has become more global on the increasing popularity of immersive social platforms and multiplayer gaming worlds, with users more willing to explore a more interactive, persistent, and gamified virtual world as entertainment, networking, and content creation.
- AI-powered avatars, motion controls, VR/AR-powered user interfaces are offering extremely interactive and customized experiences. For instance, in March 2024, Roblox launched the AI Avatars feature, whereby players can build intelligent, self-learning avatars that can communicate and improve in-game social interactions.
- The ability to cross-platform connect and sustain a persistent game world, together with constant user interaction, gives the developer the opportunity to monetize by using virtual property, in-game events, and social experiences at scale.
Metaverse Market Analysis and Segmental Data
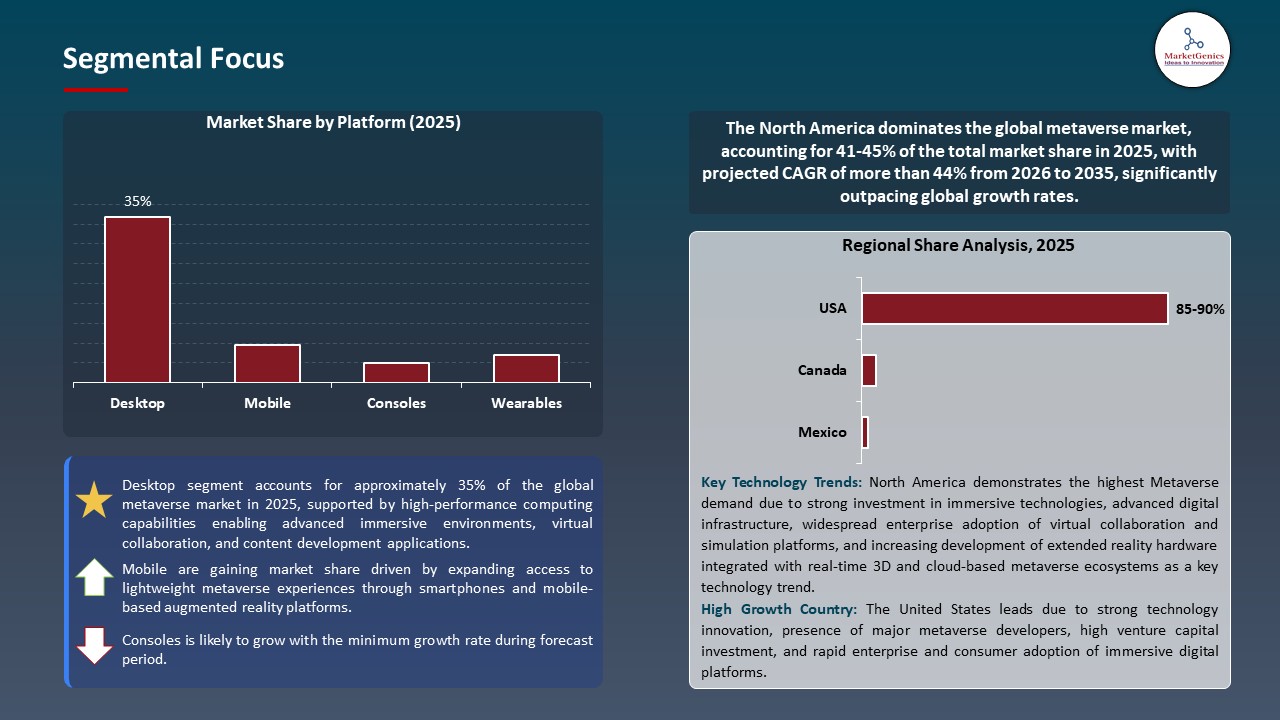
Desktop Dominate Global Metaverse Market
-
The desktop leads the global metaverse market because it has the best computing performance, enhanced graphics ability, and supports the complex virtual environment in the field of gaming, enterprise collaboration, content creation, and online shopping.
- The adoption is being enhanced by continuous innovation of desktop-based Metaverse engines and creator ecosystems. For instance, in November 2025, Unity and Epic Games declared a strategic partnership to allow Unity developers to launch content in Fortnite, and combine Unity improved commerce features with Unreal Engine to increase interoperable, desktop-centric Metaverse construction and monetization.
- Scalability, cross-platform and compatibility of tools remain conducive to desktop domination of the world metaverse market.
North America Leads Global Metaverse Market Demand
-
North America is a market leader because it was one of the first enterprises to adopt immersive XR platforms, consumers are highly engaged with virtual spaces, and most of the top metaverse developers are concentrated in the U.S. and Canada.
- The use of AI-enabled, cross-compatible Metaverse platforms is going to move faster as brands and developers continue to build immersive offerings and in-world commerce. For instance, in October 2025, Amaze Holdings with Dubit to introduced 3D virtual storefronts across gaming ecosystems to further cement creator-led monetization.
- Meanwhile, the leadership of North America in the deployment and monetization of scalable metaverse and the growth of collaborations with creator economies remains solidified by strong cloud infrastructure, developed developer ecosystems, and growing partnerships with creator economies.
Metaverse Market Ecosystem
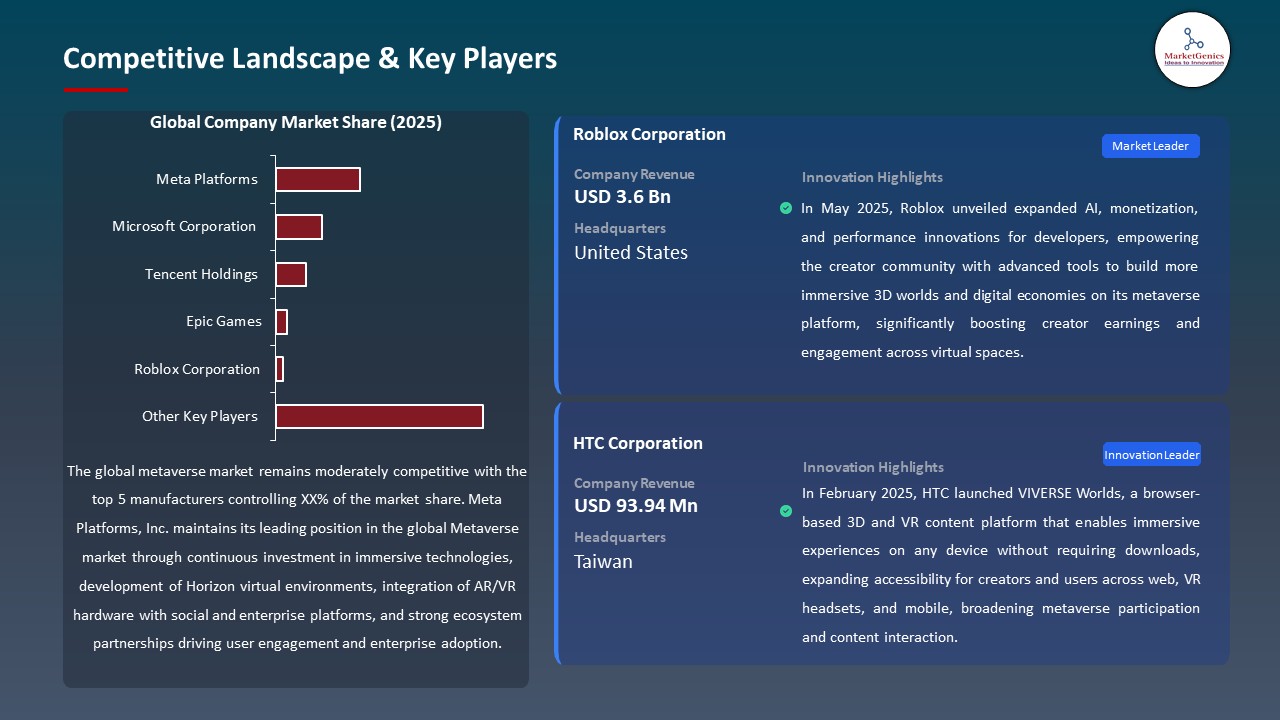
The metaverse market is consolidated, and competition is targeted at immersive virtual worlds, real-time 3D worlds, extended reality (XR) technology, digital content creation technologies, and infrastructure of the virtual economy. This is why the market share is large because of the presence of Meta Platforms, Microsoft Corporation, Tencent Holdings, Epic Games and Roblox Corporation that provide integrated Metaverse ecosystems that include advanced XR hardware, real-time rendering engines, cloud-based infrastructure, social interaction platforms, digital marketplaces and AI-based content and identity systems.
To make real-time interaction and digital commerce possible, Microsoft Corporation is investing in the creation of immersive virtual worlds and digital economies based on gaming engines, social platforms, and cloud services; Epic Games is investing in the creation of real-time 3D experience through Unreal Engine and Fortnite-based Metaverse experiences; and Roblox Corporation is investing in the creation of user-generated virtual worlds using creator tools, virtual currencies, and social interaction frameworks.
The evolution of immersive realism, interoperability of platforms, and real-time user engagement is gaining momentum because of the rising investments in XR infrastructure, rising demand of virtual collaboration and entertainment, and collaboration with content creators, cloud providers, and technology developers. These interactions in ecosystems can enhance competitive differentiation, allow the implementation of large-scale sustained virtual environments, and speed up the integration of social, enterprise, and entertainment-based Metaverse applications, and the global Metaverse market has to work towards hyper digital engagement, virtual economies, and next generation interactive experiences.
 Recent Development and Strategic Overview
-
In May 2025, Futureverse collaborated with GameTree to release GameTree.Pass, a smooth Web3 wallet integration providing 1.5 million gamers with a seamless experience of interoperable and digital asset ownership and cross-platform experiences without requiring complicated onboarding.
- In January 2026, Qatar Airways introduced QVerse Island in Fortnite an online Doha experience that allows players to explore the replicated landmarks of the city, guide them with a digital avatar, and earn travel rewards, which combines both immersive gaming and real-world experience.
Report Scope
|
Detail |
|
|
Market Size in 2025 |
USD 94.7 Bn |
|
Market Forecast Value in 2035 |
USD 3112.5 Bn |
|
Growth Rate (CAGR) |
41.8% |
|
Forecast Period |
2026 – 2035 |
|
Historical Data Available for |
2021 – 2024 |
|
Market Size Units |
US$ Billion for Value |
|
Report Format |
Electronic (PDF) + Excel |
|
North America |
Europe |
Asia Pacific |
Middle East |
Africa |
South America |
|
|
|
|
|
|
|
Companies Covered |
|||||
|
|
|
|
|
|
|
Metaverse Market Segmentation and Highlights
|
Segment |
Sub-segment |
|
Metaverse Market, By Component |
|
|
Metaverse Market, By Platform |
|
|
Metaverse Market, By Technology |
|
|
Metaverse Market, By Application |
|
|
Metaverse Market, By End-Use Industry |
|
|
Metaverse Market, By Offering Type |
|
|
Metaverse Market, By Deployment Mode |
|
Frequently Asked Questions
Table of Contents
- 1. Research Methodology and Assumptions
- 1.1. Definitions
- 1.2. Research Design and Approach
- 1.3. Data Collection Methods
- 1.4. Base Estimates and Calculations
- 1.5. Forecasting Models
- 1.5.1. Key Forecast Factors & Impact Analysis
- 1.6. Secondary Research
- 1.6.1. Open Sources
- 1.6.2. Paid Databases
- 1.6.3. Associations
- 1.7. Primary Research
- 1.7.1. Primary Sources
- 1.7.2. Primary Interviews with Stakeholders across Ecosystem
- 2. Executive Summary
- 2.1. Global Metaverse Market Outlook
- 2.1.1. Metaverse Market Size (Value - US$ Bn), and Forecasts, 2021-2035
- 2.1.2. Compounded Annual Growth Rate Analysis
- 2.1.3. Growth Opportunity Analysis
- 2.1.4. Segmental Share Analysis
- 2.1.5. Geographical Share Analysis
- 2.2. Market Analysis and Facts
- 2.3. Supply-Demand Analysis
- 2.4. Competitive Benchmarking
- 2.5. Go-to- Market Strategy
- 2.5.1. Customer/ End-use Industry Assessment
- 2.5.2. Growth Opportunity Data, 2026-2035
- 2.5.2.1. Regional Data
- 2.5.2.2. Country Data
- 2.5.2.3. Segmental Data
- 2.5.3. Identification of Potential Market Spaces
- 2.5.4. GAP Analysis
- 2.5.5. Potential Attractive Price Points
- 2.5.6. Prevailing Market Risks & Challenges
- 2.5.7. Preferred Sales & Marketing Strategies
- 2.5.8. Key Recommendations and Analysis
- 2.5.9. A Way Forward
- 2.1. Global Metaverse Market Outlook
- 3. Industry Data and Premium Insights
- 3.1. Global Industry Overview, 2025
- 3.1.1. Information Technology & Media Industry Ecosystem Analysis
- 3.1.2. Key Trends for Information Technology & Media Industry
- 3.1.3. Regional Distribution for Information Technology & Media Industry
- 3.2. Supplier Customer Data
- 3.3. Technology Roadmap and Developments
- 3.4. Trade Analysis
- 3.4.1. Import & Export Analysis, 2025
- 3.4.2. Top Importing Countries
- 3.4.3. Top Exporting Countries
- 3.5. Trump Tariff Impact Analysis
- 3.5.1. Manufacturer
- 3.5.1.1. Based on the component & Raw material
- 3.5.2. Supply Chain
- 3.5.3. End Consumer
- 3.5.1. Manufacturer
- 3.6. Raw Material Analysis
- 3.1. Global Industry Overview, 2025
- 4. Market Overview
- 4.1. Market Dynamics
- 4.1.1. Drivers
- 4.1.1.1. Growing adoption of immersive digital experiences across gaming, entertainment, enterprise collaboration, and virtual commerce
- 4.1.1.2. Advancements in extended reality technologies, real-time 3D engines, and spatial computing platforms
- 4.1.1.3. Increasing enterprise interest in virtual environments for training, simulation, and remote engagement.
- 4.1.2. Restraints
- 4.1.2.1. High infrastructure and hardware costs associated with immersive technology deployment
- 4.1.2.2. Interoperability, privacy, and data security challenges across virtual platforms.
- 4.1.1. Drivers
- 4.2. Key Trend Analysis
- 4.3. Regulatory Framework
- 4.3.1. Key Regulations, Norms, and Subsidies, by Key Countries
- 4.3.2. Tariffs and Standards
- 4.3.3. Impact Analysis of Regulations on the Market
- 4.4. Value Chain Analysis
- 4.5. Porter’s Five Forces Analysis
- 4.6. PESTEL Analysis
- 4.7. Global Metaverse Market Demand
- 4.7.1. Historical Market Size – Value (US$ Bn), 2020-2024
- 4.7.2. Current and Future Market Size – Value (US$ Bn), 2026–2035
- 4.7.2.1. Y-o-Y Growth Trends
- 4.7.2.2. Absolute $ Opportunity Assessment
- 4.1. Market Dynamics
- 5. Competition Landscape
- 5.1. Competition structure
- 5.1.1. Fragmented v/s consolidated
- 5.2. Company Share Analysis, 2025
- 5.2.1. Global Company Market Share
- 5.2.2. By Region
- 5.2.2.1. North America
- 5.2.2.2. Europe
- 5.2.2.3. Asia Pacific
- 5.2.2.4. Middle East
- 5.2.2.5. Africa
- 5.2.2.6. South America
- 5.3. Product Comparison Matrix
- 5.3.1. Specifications
- 5.3.2. Market Positioning
- 5.3.3. Pricing
- 5.1. Competition structure
- 6. Global Metaverse Market Analysis, by Component
- 6.1. Key Segment Analysis
- 6.2. Metaverse Market Size (Value - US$ Bn), Analysis, and Forecasts, by Component, 2021-2035
- 6.2.1. Hardware
- 6.2.1.1. AR Devices
- 6.2.1.2. VR Headsets
- 6.2.1.3. MR Devices
- 6.2.1.4. Haptic Devices
- 6.2.1.5. Sensors
- 6.2.1.6. Cameras
- 6.2.1.7. Projectors & Display Units
- 6.2.1.8. Others
- 6.2.2. Software
- 6.2.2.1. Gaming Engines
- 6.2.2.2. 3D Modeling & Reconstruction
- 6.2.2.3. Financial Platforms
- 6.2.2.4. Metaverse Platforms
- 6.2.2.5. Extended Reality Software
- 6.2.2.6. Others
- 6.2.3. Services
- 6.2.3.1. Professional Services
- 6.2.3.2. Managed Services
- 6.2.3.3. Others
- 6.2.1. Hardware
- 7. Global Metaverse Market Analysis, by Platform
- 7.1. Key Segment Analysis
- 7.2. Metaverse Market Size (Value - US$ Bn), Analysis, and Forecasts, by Platform, 2021-2035
- 7.2.1. Desktop
- 7.2.2. Mobile
- 7.2.3. Wearables
- 7.2.4. Consoles
- 8. Global Metaverse Market Analysis, by Technology
- 8.1. Key Segment Analysis
- 8.2. Metaverse Market Size (Value - US$ Bn), Analysis, and Forecasts, by Technology, 2021-2035
- 8.2.1. Blockchain
- 8.2.2. Virtual Reality (VR)
- 8.2.3. Augmented Reality (AR)
- 8.2.4. Mixed Reality (MR)
- 8.2.5. Artificial Intelligence (AI)
- 8.2.6. 3D Reconstruction
- 8.2.7. Internet of Things (IoT)
- 8.2.8. Spatial & Edge Computing
- 8.2.9. Others
- 9. Global Metaverse Market Analysis, by Application
- 9.1. Key Segment Analysis
- 9.2. Metaverse Market Size (Value - US$ Bn), Analysis, and Forecasts, by Application, 2021-2035
- 9.2.1. Gaming
- 9.2.2. Online Shopping
- 9.2.3. Social Media & Communication
- 9.2.4. Content Creation & Marketing
- 9.2.5. Events & Conferences
- 9.2.6. Digital Marketing
- 9.2.7. Testing & Inspection
- 9.2.8. Learning & Training
- 9.2.9. Real Estate
- 9.2.10. Others
- 10. Global Metaverse Market Analysis, by End-Use Industry
- 10.1. Key Segment Analysis
- 10.2. Metaverse Market Size (Value - US$ Bn), Analysis, and Forecasts, by End-Use Industry, 2021-2035
- 10.2.1. Gaming & Entertainment
- 10.2.2. Retail & E-commerce
- 10.2.3. Education & Training
- 10.2.4. Healthcare
- 10.2.5. Real Estate & Architecture
- 10.2.6. Media & Advertising
- 10.2.7. BFSI (Banking, Financial Services & Insurance)
- 10.2.8. Manufacturing & Industrial
- 10.2.9. Automotive
- 10.2.10. Travel & Tourism
- 10.2.11. Others
- 11. Global Metaverse Market Analysis, by Offering Type
- 11.1. Key Segment Analysis
- 11.2. Metaverse Market Size (Value - US$ Bn), Analysis, and Forecasts, by Offering Type, 2021-2035
- 11.2.1. Virtual Platforms
- 11.2.2. Avatar Systems
- 11.2.3. NFT Marketplaces
- 11.2.4. Virtual Real Estate
- 11.2.5. Digital Assets
- 11.2.6. Others
- 12. Global Metaverse Market Analysis, by Deployment Mode
- 12.1. Key Segment Analysis
- 12.2. Metaverse Market Size (Value - US$ Bn), Analysis, and Forecasts, by Deployment Mode, 2021-2035
- 12.2.1. Cloud-based
- 12.2.2. On-premises
- 12.2.3. Hybrid
- 13. Global Metaverse Market Analysis and Forecasts, by Region
- 13.1. Key Findings
- 13.2. Metaverse Market Size (Value - US$ Bn), Analysis, and Forecasts, by Region, 2021-2035
- 13.2.1. North America
- 13.2.2. Europe
- 13.2.3. Asia Pacific
- 13.2.4. Middle East
- 13.2.5. Africa
- 13.2.6. South America
- 14. North America Metaverse Market Analysis
- 14.1. Key Segment Analysis
- 14.2. Regional Snapshot
- 14.3. North America Metaverse Market Size (Value - US$ Bn), Analysis, and Forecasts, 2021-2035
- 14.3.1. Component
- 14.3.2. Platform
- 14.3.3. Technology
- 14.3.4. Application
- 14.3.5. End-Use Industry
- 14.3.6. Offering Type
- 14.3.7. Deployment Mode
- 14.3.8. Country
- 14.3.8.1. USA
- 14.3.8.2. Canada
- 14.3.8.3. Mexico
- 14.4. USA Metaverse Market
- 14.4.1. Country Segmental Analysis
- 14.4.2. Component
- 14.4.3. Platform
- 14.4.4. Technology
- 14.4.5. Application
- 14.4.6. End-Use Industry
- 14.4.7. Offering Type
- 14.4.8. Deployment Mode
- 14.5. Canada Metaverse Market
- 14.5.1. Country Segmental Analysis
- 14.5.2. Component
- 14.5.3. Platform
- 14.5.4. Technology
- 14.5.5. Application
- 14.5.6. End-Use Industry
- 14.5.7. Offering Type
- 14.5.8. Deployment Mode
- 14.6. Mexico Metaverse Market
- 14.6.1. Country Segmental Analysis
- 14.6.2. Component
- 14.6.3. Platform
- 14.6.4. Technology
- 14.6.5. Application
- 14.6.6. End-Use Industry
- 14.6.7. Offering Type
- 14.6.8. Deployment Mode
- 15. Europe Metaverse Market Analysis
- 15.1. Key Segment Analysis
- 15.2. Regional Snapshot
- 15.3. Europe Metaverse Market Size (Value - US$ Bn), Analysis, and Forecasts, 2021-2035
- 15.3.1. Component
- 15.3.2. Platform
- 15.3.3. Technology
- 15.3.4. Application
- 15.3.5. End-Use Industry
- 15.3.6. Offering Type
- 15.3.7. Deployment Mode
- 15.3.8. Country
- 15.3.8.1. Germany
- 15.3.8.2. United Kingdom
- 15.3.8.3. France
- 15.3.8.4. Italy
- 15.3.8.5. Spain
- 15.3.8.6. Netherlands
- 15.3.8.7. Nordic Countries
- 15.3.8.8. Poland
- 15.3.8.9. Russia & CIS
- 15.3.8.10. Rest of Europe
- 15.4. Germany Metaverse Market
- 15.4.1. Country Segmental Analysis
- 15.4.2. Component
- 15.4.3. Platform
- 15.4.4. Technology
- 15.4.5. Application
- 15.4.6. End-Use Industry
- 15.4.7. Offering Type
- 15.4.8. Deployment Mode
- 15.5. United Kingdom Metaverse Market
- 15.5.1. Country Segmental Analysis
- 15.5.2. Component
- 15.5.3. Platform
- 15.5.4. Technology
- 15.5.5. Application
- 15.5.6. End-Use Industry
- 15.5.7. Offering Type
- 15.5.8. Deployment Mode
- 15.6. France Metaverse Market
- 15.6.1. Country Segmental Analysis
- 15.6.2. Component
- 15.6.3. Platform
- 15.6.4. Technology
- 15.6.5. Application
- 15.6.6. End-Use Industry
- 15.6.7. Offering Type
- 15.6.8. Deployment Mode
- 15.7. Italy Metaverse Market
- 15.7.1. Country Segmental Analysis
- 15.7.2. Component
- 15.7.3. Platform
- 15.7.4. Technology
- 15.7.5. Application
- 15.7.6. End-Use Industry
- 15.7.7. Offering Type
- 15.7.8. Deployment Mode
- 15.8. Spain Metaverse Market
- 15.8.1. Country Segmental Analysis
- 15.8.2. Component
- 15.8.3. Platform
- 15.8.4. Technology
- 15.8.5. Application
- 15.8.6. End-Use Industry
- 15.8.7. Offering Type
- 15.8.8. Deployment Mode
- 15.9. Netherlands Metaverse Market
- 15.9.1. Country Segmental Analysis
- 15.9.2. Component
- 15.9.3. Platform
- 15.9.4. Technology
- 15.9.5. Application
- 15.9.6. End-Use Industry
- 15.9.7. Offering Type
- 15.9.8. Deployment Mode
- 15.10. Nordic Countries Metaverse Market
- 15.10.1. Country Segmental Analysis
- 15.10.2. Component
- 15.10.3. Platform
- 15.10.4. Technology
- 15.10.5. Application
- 15.10.6. End-Use Industry
- 15.10.7. Offering Type
- 15.10.8. Deployment Mode
- 15.11. Poland Metaverse Market
- 15.11.1. Country Segmental Analysis
- 15.11.2. Component
- 15.11.3. Platform
- 15.11.4. Technology
- 15.11.5. Application
- 15.11.6. End-Use Industry
- 15.11.7. Offering Type
- 15.11.8. Deployment Mode
- 15.12. Russia & CIS Metaverse Market
- 15.12.1. Country Segmental Analysis
- 15.12.2. Component
- 15.12.3. Platform
- 15.12.4. Technology
- 15.12.5. Application
- 15.12.6. End-Use Industry
- 15.12.7. Offering Type
- 15.12.8. Deployment Mode
- 15.13. Rest of Europe Metaverse Market
- 15.13.1. Country Segmental Analysis
- 15.13.2. Component
- 15.13.3. Platform
- 15.13.4. Technology
- 15.13.5. Application
- 15.13.6. End-Use Industry
- 15.13.7. Offering Type
- 15.13.8. Deployment Mode
- 16. Asia Pacific Metaverse Market Analysis
- 16.1. Key Segment Analysis
- 16.2. Regional Snapshot
- 16.3. Asia Pacific Metaverse Market Size (Value - US$ Bn), Analysis, and Forecasts, 2021-2035
- 16.3.1. Component
- 16.3.2. Platform
- 16.3.3. Technology
- 16.3.4. Application
- 16.3.5. End-Use Industry
- 16.3.6. Offering Type
- 16.3.7. Deployment Mode
- 16.3.8. Country
- 16.3.8.1. China
- 16.3.8.2. India
- 16.3.8.3. Japan
- 16.3.8.4. South Korea
- 16.3.8.5. Australia and New Zealand
- 16.3.8.6. Indonesia
- 16.3.8.7. Malaysia
- 16.3.8.8. Thailand
- 16.3.8.9. Vietnam
- 16.3.8.10. Rest of Asia Pacific
- 16.4. China Metaverse Market
- 16.4.1. Country Segmental Analysis
- 16.4.2. Component
- 16.4.3. Platform
- 16.4.4. Technology
- 16.4.5. Application
- 16.4.6. End-Use Industry
- 16.4.7. Offering Type
- 16.4.8. Deployment Mode
- 16.5. India Metaverse Market
- 16.5.1. Country Segmental Analysis
- 16.5.2. Component
- 16.5.3. Platform
- 16.5.4. Technology
- 16.5.5. Application
- 16.5.6. End-Use Industry
- 16.5.7. Offering Type
- 16.5.8. Deployment Mode
- 16.6. Japan Metaverse Market
- 16.6.1. Country Segmental Analysis
- 16.6.2. Component
- 16.6.3. Platform
- 16.6.4. Technology
- 16.6.5. Application
- 16.6.6. End-Use Industry
- 16.6.7. Offering Type
- 16.6.8. Deployment Mode
- 16.7. South Korea Metaverse Market
- 16.7.1. Country Segmental Analysis
- 16.7.2. Component
- 16.7.3. Platform
- 16.7.4. Technology
- 16.7.5. Application
- 16.7.6. End-Use Industry
- 16.7.7. Offering Type
- 16.7.8. Deployment Mode
- 16.8. Australia and New Zealand Metaverse Market
- 16.8.1. Country Segmental Analysis
- 16.8.2. Component
- 16.8.3. Platform
- 16.8.4. Technology
- 16.8.5. Application
- 16.8.6. End-Use Industry
- 16.8.7. Offering Type
- 16.8.8. Deployment Mode
- 16.9. Indonesia Metaverse Market
- 16.9.1. Country Segmental Analysis
- 16.9.2. Component
- 16.9.3. Platform
- 16.9.4. Technology
- 16.9.5. Application
- 16.9.6. End-Use Industry
- 16.9.7. Offering Type
- 16.9.8. Deployment Mode
- 16.10. Malaysia Metaverse Market
- 16.10.1. Country Segmental Analysis
- 16.10.2. Component
- 16.10.3. Platform
- 16.10.4. Technology
- 16.10.5. Application
- 16.10.6. End-Use Industry
- 16.10.7. Offering Type
- 16.10.8. Deployment Mode
- 16.11. Thailand Metaverse Market
- 16.11.1. Country Segmental Analysis
- 16.11.2. Component
- 16.11.3. Platform
- 16.11.4. Technology
- 16.11.5. Application
- 16.11.6. End-Use Industry
- 16.11.7. Offering Type
- 16.11.8. Deployment Mode
- 16.12. Vietnam Metaverse Market
- 16.12.1. Country Segmental Analysis
- 16.12.2. Component
- 16.12.3. Platform
- 16.12.4. Technology
- 16.12.5. Application
- 16.12.6. End-Use Industry
- 16.12.7. Offering Type
- 16.12.8. Deployment Mode
- 16.13. Rest of Asia Pacific Metaverse Market
- 16.13.1. Country Segmental Analysis
- 16.13.2. Component
- 16.13.3. Platform
- 16.13.4. Technology
- 16.13.5. Application
- 16.13.6. End-Use Industry
- 16.13.7. Offering Type
- 16.13.8. Deployment Mode
- 17. Middle East Metaverse Market Analysis
- 17.1. Key Segment Analysis
- 17.2. Regional Snapshot
- 17.3. Middle East Metaverse Market Size (Value - US$ Bn), Analysis, and Forecasts, 2021-2035
- 17.3.1. Component
- 17.3.2. Platform
- 17.3.3. Technology
- 17.3.4. Application
- 17.3.5. End-Use Industry
- 17.3.6. Offering Type
- 17.3.7. Deployment Mode
- 17.3.8. Country
- 17.3.8.1. Turkey
- 17.3.8.2. UAE
- 17.3.8.3. Saudi Arabia
- 17.3.8.4. Israel
- 17.3.8.5. Rest of Middle East
- 17.4. Turkey Metaverse Market
- 17.4.1. Country Segmental Analysis
- 17.4.2. Component
- 17.4.3. Platform
- 17.4.4. Technology
- 17.4.5. Application
- 17.4.6. End-Use Industry
- 17.4.7. Offering Type
- 17.4.8. Deployment Mode
- 17.5. UAE Metaverse Market
- 17.5.1. Country Segmental Analysis
- 17.5.2. Component
- 17.5.3. Platform
- 17.5.4. Technology
- 17.5.5. Application
- 17.5.6. End-Use Industry
- 17.5.7. Offering Type
- 17.5.8. Deployment Mode
- 17.6. Saudi Arabia Metaverse Market
- 17.6.1. Country Segmental Analysis
- 17.6.2. Component
- 17.6.3. Platform
- 17.6.4. Technology
- 17.6.5. Application
- 17.6.6. End-Use Industry
- 17.6.7. Offering Type
- 17.6.8. Deployment Mode
- 17.7. Israel Metaverse Market
- 17.7.1. Country Segmental Analysis
- 17.7.2. Component
- 17.7.3. Platform
- 17.7.4. Technology
- 17.7.5. Application
- 17.7.6. End-Use Industry
- 17.7.7. Offering Type
- 17.7.8. Deployment Mode
- 17.8. Rest of Middle East Metaverse Market
- 17.8.1. Country Segmental Analysis
- 17.8.2. Component
- 17.8.3. Platform
- 17.8.4. Technology
- 17.8.5. Application
- 17.8.6. End-Use Industry
- 17.8.7. Offering Type
- 17.8.8. Deployment Mode
- 18. Africa Metaverse Market Analysis
- 18.1. Key Segment Analysis
- 18.2. Regional Snapshot
- 18.3. Africa Metaverse Market Size (Value - US$ Bn), Analysis, and Forecasts, 2021-2035
- 18.3.1. Component
- 18.3.2. Platform
- 18.3.3. Technology
- 18.3.4. Application
- 18.3.5. End-Use Industry
- 18.3.6. Offering Type
- 18.3.7. Deployment Mode
- 18.3.8. Country
- 18.3.8.1. South Africa
- 18.3.8.2. Egypt
- 18.3.8.3. Nigeria
- 18.3.8.4. Algeria
- 18.3.8.5. Rest of Africa
- 18.4. South Africa Metaverse Market
- 18.4.1. Country Segmental Analysis
- 18.4.2. Component
- 18.4.3. Platform
- 18.4.4. Technology
- 18.4.5. Application
- 18.4.6. End-Use Industry
- 18.4.7. Offering Type
- 18.4.8. Deployment Mode
- 18.5. Egypt Metaverse Market
- 18.5.1. Country Segmental Analysis
- 18.5.2. Component
- 18.5.3. Platform
- 18.5.4. Technology
- 18.5.5. Application
- 18.5.6. End-Use Industry
- 18.5.7. Offering Type
- 18.5.8. Deployment Mode
- 18.6. Nigeria Metaverse Market
- 18.6.1. Country Segmental Analysis
- 18.6.2. Component
- 18.6.3. Platform
- 18.6.4. Technology
- 18.6.5. Application
- 18.6.6. End-Use Industry
- 18.6.7. Offering Type
- 18.6.8. Deployment Mode
- 18.7. Algeria Metaverse Market
- 18.7.1. Country Segmental Analysis
- 18.7.2. Component
- 18.7.3. Platform
- 18.7.4. Technology
- 18.7.5. Application
- 18.7.6. End-Use Industry
- 18.7.7. Offering Type
- 18.7.8. Deployment Mode
- 18.8. Rest of Africa Metaverse Market
- 18.8.1. Country Segmental Analysis
- 18.8.2. Component
- 18.8.3. Platform
- 18.8.4. Technology
- 18.8.5. Application
- 18.8.6. End-Use Industry
- 18.8.7. Offering Type
- 18.8.8. Deployment Mode
- 19. South America Metaverse Market Analysis
- 19.1. Key Segment Analysis
- 19.2. Regional Snapshot
- 19.3. South America Metaverse Market Size (Value - US$ Bn), Analysis, and Forecasts, 2021-2035
- 19.3.1. Component
- 19.3.2. Platform
- 19.3.3. Technology
- 19.3.4. Application
- 19.3.5. End-Use Industry
- 19.3.6. Offering Type
- 19.3.7. Deployment Mode
- 19.3.8. Country
- 19.3.8.1. Brazil
- 19.3.8.2. Argentina
- 19.3.8.3. Rest of South America
- 19.4. Brazil Metaverse Market
- 19.4.1. Country Segmental Analysis
- 19.4.2. Component
- 19.4.3. Platform
- 19.4.4. Technology
- 19.4.5. Application
- 19.4.6. End-Use Industry
- 19.4.7. Offering Type
- 19.4.8. Deployment Mode
- 19.5. Argentina Metaverse Market
- 19.5.1. Country Segmental Analysis
- 19.5.2. Component
- 19.5.3. Platform
- 19.5.4. Technology
- 19.5.5. Application
- 19.5.6. End-Use Industry
- 19.5.7. Offering Type
- 19.5.8. Deployment Mode
- 19.6. Rest of South America Metaverse Market
- 19.6.1. Country Segmental Analysis
- 19.6.2. Component
- 19.6.3. Platform
- 19.6.4. Technology
- 19.6.5. Application
- 19.6.6. End-Use Industry
- 19.6.7. Offering Type
- 19.6.8. Deployment Mode
- 20. Key Players/ Company Profile
- 20.1. Amazon Web Services.
- 20.1.1. Company Details/ Overview
- 20.1.2. Company Financials
- 20.1.3. Key Customers and Competitors
- 20.1.4. Business/ Industry Portfolio
- 20.1.5. Product Portfolio/ Specification Details
- 20.1.6. Pricing Data
- 20.1.7. Strategic Overview
- 20.1.8. Recent Developments
- 20.2. Apple Inc.
- 20.3. ByteDance
- 20.4. Decentraland
- 20.5. Epic Games
- 20.6. Google LLC
- 20.7. HTC Corporation
- 20.8. Magic Leap
- 20.9. Meta Platforms
- 20.10. Microsoft Corporation
- 20.11. NetEase
- 20.12. Nextech AR Solutions
- 20.13. Niantic
- 20.14. NVIDIA Corporation
- 20.15. Roblox Corporation
- 20.16. Samsung Electronics
- 20.17. Snap Inc.
- 20.18. Sony Corporation
- 20.19. Tencent Holdings
- 20.20. The Sandbox
- 20.21. Unity Technologies
- 20.22. Other Key Players
- 20.1. Amazon Web Services.
Note* - This is just tentative list of players. While providing the report, we will cover more number of players based on their revenue and share for each geography
Research Design
Our research design integrates both demand-side and supply-side analysis through a balanced combination of primary and secondary research methodologies. By utilizing both bottom-up and top-down approaches alongside rigorous data triangulation methods, we deliver robust market intelligence that supports strategic decision-making.
MarketGenics' comprehensive research design framework ensures the delivery of accurate, reliable, and actionable market intelligence. Through the integration of multiple research approaches, rigorous validation processes, and expert analysis, we provide our clients with the insights needed to make informed strategic decisions and capitalize on market opportunities.

MarketGenics leverages a dedicated industry panel of experts and a comprehensive suite of paid databases to effectively collect, consolidate, and analyze market intelligence.
Our approach has consistently proven to be reliable and effective in generating accurate market insights, identifying key industry trends, and uncovering emerging business opportunities.
Through both primary and secondary research, we capture and analyze critical company-level data such as manufacturing footprints, including technical centers, R&D facilities, sales offices, and headquarters.
Our expert panel further enhances our ability to estimate market size for specific brands based on validated field-level intelligence.
Our data mining techniques incorporate both parametric and non-parametric methods, allowing for structured data collection, sorting, processing, and cleaning.
Demand projections are derived from large-scale data sets analyzed through proprietary algorithms, culminating in robust and reliable market sizing.
Research Approach
The bottom-up approach builds market estimates by starting with the smallest addressable market units and systematically aggregating them to create comprehensive market size projections.
This method begins with specific, granular data points and builds upward to create the complete market landscape.
Customer Analysis → Segmental Analysis → Geographical Analysis
The top-down approach starts with the broadest possible market data and systematically narrows it down through a series of filters and assumptions to arrive at specific market segments or opportunities.
This method begins with the big picture and works downward to increasingly specific market slices.
TAM → SAM → SOM


Research Methods
Desk / Secondary Research
While analysing the market, we extensively study secondary sources, directories, and databases to identify and collect information useful for this technical, market-oriented, and commercial report. Secondary sources that we utilize are not only the public sources, but it is a combination of Open Source, Associations, Paid Databases, MG Repository & Knowledgebase, and others.
- Company websites, annual reports, financial reports, broker reports, and investor presentations
- National government documents, statistical databases and reports
- News articles, press releases and web-casts specific to the companies operating in the market, Magazines, reports, and others
- We gather information from commercial data sources for deriving company specific data such as segmental revenue, share for geography, product revenue, and others
- Internal and external proprietary databases (industry-specific), relevant patent, and regulatory databases
- Governing Bodies, Government Organizations
- Relevant Authorities, Country-specific Associations for Industries
We also employ the model mapping approach to estimate the product level market data through the players' product portfolio
Primary Research
Primary research/ interviews is vital in analyzing the market. Most of the cases involves paid primary interviews. Primary sources include primary interviews through e-mail interactions, telephonic interviews, surveys as well as face-to-face interviews with the different stakeholders across the value chain including several industry experts.
| Type of Respondents | Number of Primaries |
|---|---|
| Tier 2/3 Suppliers | ~20 |
| Tier 1 Suppliers | ~25 |
| End-users | ~25 |
| Industry Expert/ Panel/ Consultant | ~30 |
| Total | ~100 |
MG Knowledgebase
• Repository of industry blog, newsletter and case studies
• Online platform covering detailed market reports, and company profiles
Forecasting Factors and Models
Forecasting Factors
- Historical Trends – Past market patterns, cycles, and major events that shaped how markets behave over time. Understanding past trends helps predict future behavior.
- Industry Factors – Specific characteristics of the industry like structure, regulations, and innovation cycles that affect market dynamics.
- Macroeconomic Factors – Economic conditions like GDP growth, inflation, and employment rates that affect how much money people have to spend.
- Demographic Factors – Population characteristics like age, income, and location that determine who can buy your product.
- Technology Factors – How quickly people adopt new technology and how much technology infrastructure exists.
- Regulatory Factors – Government rules, laws, and policies that can help or restrict market growth.
- Competitive Factors – Analyzing competition structure such as degree of competition and bargaining power of buyers and suppliers.
Forecasting Models / Techniques
Multiple Regression Analysis
- Identify and quantify factors that drive market changes
- Statistical modeling to establish relationships between market drivers and outcomes
Time Series Analysis – Seasonal Patterns
- Understand regular cyclical patterns in market demand
- Advanced statistical techniques to separate trend, seasonal, and irregular components
Time Series Analysis – Trend Analysis
- Identify underlying market growth patterns and momentum
- Statistical analysis of historical data to project future trends
Expert Opinion – Expert Interviews
- Gather deep industry insights and contextual understanding
- In-depth interviews with key industry stakeholders
Multi-Scenario Development
- Prepare for uncertainty by modeling different possible futures
- Creating optimistic, pessimistic, and most likely scenarios
Time Series Analysis – Moving Averages
- Sophisticated forecasting for complex time series data
- Auto-regressive integrated moving average models with seasonal components
Econometric Models
- Apply economic theory to market forecasting
- Sophisticated economic models that account for market interactions
Expert Opinion – Delphi Method
- Harness collective wisdom of industry experts
- Structured, multi-round expert consultation process
Monte Carlo Simulation
- Quantify uncertainty and probability distributions
- Thousands of simulations with varying input parameters
Research Analysis
Our research framework is built upon the fundamental principle of validating market intelligence from both demand and supply perspectives. This dual-sided approach ensures comprehensive market understanding and reduces the risk of single-source bias.
Demand-Side Analysis: We understand end-user/application behavior, preferences, and market needs along with the penetration of the product for specific application.
Supply-Side Analysis: We estimate overall market revenue, analyze the segmental share along with industry capacity, competitive landscape, and market structure.
Validation & Evaluation
Data triangulation is a validation technique that uses multiple methods, sources, or perspectives to examine the same research question, thereby increasing the credibility and reliability of research findings. In market research, triangulation serves as a quality assurance mechanism that helps identify and minimize bias, validate assumptions, and ensure accuracy in market estimates.
- Data Source Triangulation – Using multiple data sources to examine the same phenomenon
- Methodological Triangulation – Using multiple research methods to study the same research question
- Investigator Triangulation – Using multiple researchers or analysts to examine the same data
- Theoretical Triangulation – Using multiple theoretical perspectives to interpret the same data

Custom Market Research Services
We will customise the research for you, in case the report listed above does not meet your requirements.
Get 10% Free Customisation