Micro-mobility Vehicles Market Size, Share & Trends Analysis Report by Vehicle Type (E-Scooters, E-Bikes, Electric Skateboards, Electric Unicycles, Hoverboards, Electric Mopeds, Cargo E-Bikes), Battery Type, Voltage, Speed Range, Power Output, End-use, Target Demographics, and Geography (North America, Europe, Asia Pacific, Middle East, Africa, and South America) – Global Industry Data, Trends, and Forecasts, 2026–2035
|
|
|
Segmental Data Insights |
|
|
Demand Trends |
|
|
Competitive Landscape |
|
|
Strategic Development |
|
|
Future Outlook & Opportunities |
|
Micro-mobility Vehicles Market Size, Share, and Growth
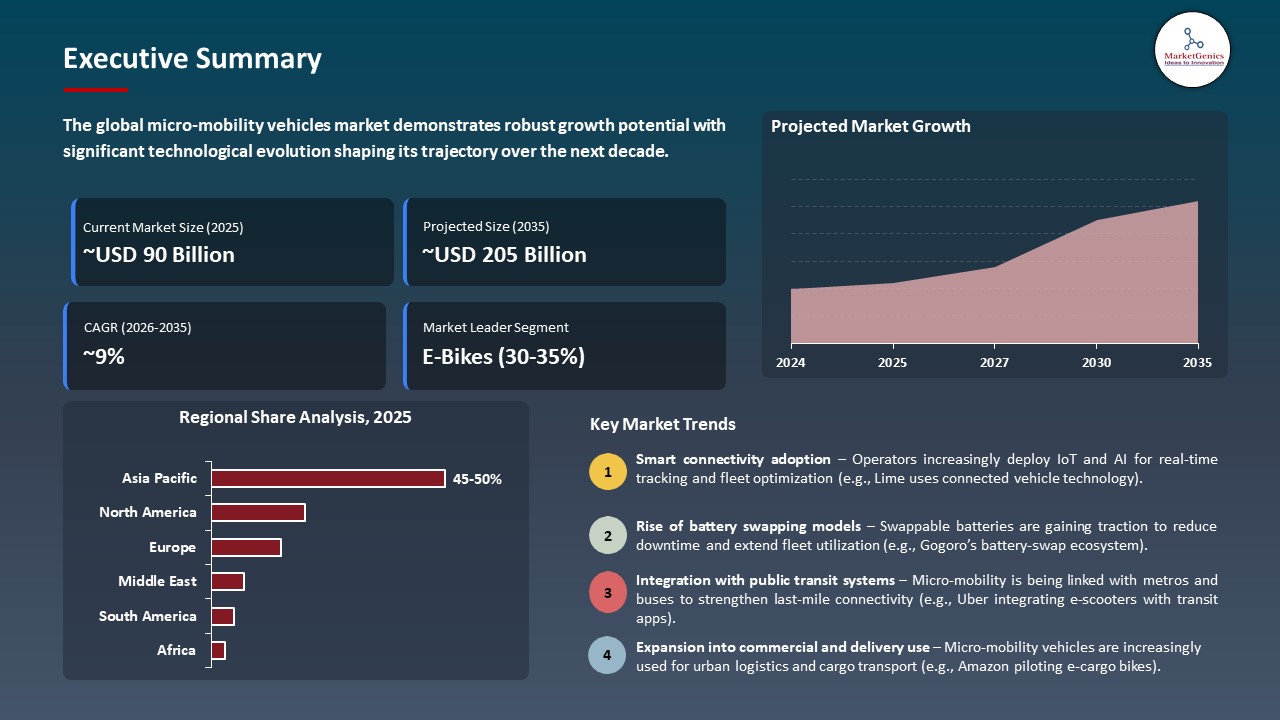
The global micro-mobility vehicles market is experiencing robust growth, with its estimated value of USD 89.6 billion in the year 2025 and USD 204.6 billion by the period 2035, registering a CAGR of 8.6%, during the forecast period. The global Micro-mobility Vehicles market, driven by rapid electrification of powertrains, growing adoption of hybrid and electric vehicles, and stricter fuel-efficiency and emission regulations, as electric pumps enable on-demand lubrication, reduced parasitic losses, improved thermal management, and optimized efficiency in start-stop, hybrid, and EV applications.
Andrea Castro, CEO of Copec Voltex, said, “Our partnership with Gogoro lets us offer an innovative charging solution that redefines city travel, lowering barriers to entry and bringing electric mobility to a new group of Chileans seeking more efficient and sustainable transportation for daily life.”
The necessity of sustainable, environmentally friendly transportation to limit carbon emissions and congestion in urban areas, the micro-mobility vehicles market has boosted the use of e-scooters and bikes as low-carbon, emission-free alternatives to cars and buses. For instance, in April 2025, Lime launched more than 10,000 new LimeBikes and LimeGliders electric vehicles to their shared mobility fleet in Europe and North America, making transportation more accessible and more sustainable by continuing to design vehicles in a more sustainable manner. This driver increases market demand by aligning micro-mobility solutions with sustainability goals, attracting eco-conscious users and supporting urban decarbonization efforts.
Additionally, the ongoing development and modernization of vehicles and technology are propelling the micro-mobility industry through enhanced performance, usability, and range, thus making these vehicles more desirable and affordable to more consumers. For instance, Segway-Ninebot introduced high-tech products like the Xyber and Xafari e-bikes and the next-generation GT3 Pro scooter, which proves that consistent product development with added functionality is propelling the growth of the micro-mobility market. These new technologies influence increased usage, as they expand ride experience, reliability, and versatility, and increase the global number of micro-mobility users.
The key adjacent opportunities to the global micro-mobility vehicles market include battery swapping and charging infrastructure, smart urban mobility software platforms, shared mobility and fleet management services, lightweight composite components, and last-mile delivery solutions integrated with e-scooters and e-bikes. These adjacencies broaden the finance groups, increase the development of the ecosystems, and strive to speed scalable and asset-light growth throughout urban mobility value chains.
Micro-mobility Vehicles Market Dynamics and Trends
Driver: Rapid Integration of AI & Telematics Increasing Operational Efficiency
-
The growth in the micro-mobility vehicles market, due to the active adoption of artificial intelligence (AI), Internet of Things (IoT), and telematics technologies. These technologies will also help operators to track and control fleets in real-time, improving predictive maintenance and making sure that vehicles will be serviced before they break down. This makes the capabilities lower downtimes and enhance operational efficiency that is important in densely populated cities.
- For instance, in July 2025, iGowise Mobility and Elektrik Express implemented 2,000 AI-driven BeiGo trikes in India, utilizing MicroLogi AI to make optimised routing, fleet health and energy management. These smart fleet systems boost the usage rates, minimize expenses and improve the reliability of services in cities applications of micro-mobility.
- The advantages of integrating intelligent mobility solutions to operators include reducing operational expenses, maximizing fleet usage, and providing a better experience to the rider. This leads to increased user satisfaction, increased adoption rates and the general expansion of urban micro-mobility ecosystem.
- Increased efficiency and reliability improve market development and competitiveness.
Restraint: Regulatory Complexities and Safety Compliance Challenges
-
Regulatory complications and the differences in safety requirements in regions are major constraints on the global micro-mobility market where manufacturers find it hard to standardize cars and meet local conditions of operation.
- The compliance usually involves hardware, software, and fleet management systems alterations, which increases the costs of development and operation. There are also requirements to have mandatory insurance, licensing of riders, and share of data, which further complicate the situation and burden the operator with administration.
- For example, e-scooter safety and reporting regulations in large European and North American cities have become very strict, restricting the freedom of operation by urban authorities. These regulatory restrictions may slow down the growth of fleet and innovation especially to new entrants who want to penetrate the market fast.
- The complexity of regulatory bodies adds to the cost of operation and limits scalable market expansion by manufacturers and operators.
Opportunity: Battery Swapping and Support Infrastructure Expansion
-
Battery swapping and support infrastructure expansion is a significant growth prospect of the global micro-mobility vehicles sector since it eliminates major threats that the industry is facing which includes low range, extensive charging duration and excessive purchase prices of batteries. This will allow operators to keep vehicles on the road, exchange batteries faster and minimize downtime, enhancing the efficiency of the fleet.
- Battery-as-a-Service (BaaS) and battery swapping ecosystems that enable riders to replace emptied batteries with fully charged ones within minutes can also make electric scooters and bikes more convenient to use in everyday urban life. This system makes life easier and convenient to individual users and allows shared mobility fleets to run round the clock without any delays.
- Players in the industry are investing and expanding this infrastructure. For instance, Yuma Energy and Motovolt Mobility joined forces to roll out 15,000 electric scooters with battery-swapping features in Bengaluru and Kolkata where swap stations make the administration of the fleet smoother and more accessible to energy. The innovations improve the efficiency of operations, promote the use of micro-mobility, and decrease the reliance on traditional charging.
- Increasing battery swapping infrastructure reduces barriers to adoption, improves reliability of services and facilitates a sustainable market development.
Key Trend: Expansion of Shared & Multi‑Modal Urban Transport Ecosystems
-
The development of shared and multi-modal urban transport systems is a major trend that is fueling the micro-mobility vehicles market. It aims at forming smooth linkages between micro-mobility solutions and more urban transportation systems so that riders can use e-scooters, e-bikes, ride-hailing, and transit by accessing them via single digital platforms. This connection aids effective first and last mile transportation, as well as decreasing dependence on personal vehicles.
- Leading shared mobility provider TIER Mobility has integrated its scooters and e‑bikes into multiple MaaS (Mobility as a Service) applications across European cities. Micro-mobility vehicles and other transportation modes are now available to users who can find and book the vehicles through third-party multimodal applications, making it easy to plan trips and enhancing the convenience of commuting to work and other destinations.
- The trend promotes the shift of mode out of personal cars, increases route flexibility, and reinforces sustainable transportation programs. With integration of different modes of transport, micro-mobility is adopted, there is more engagement between users and the sustainability of urban transportation systems is enhanced.
- Multi-modal integration increases the use of micro-mobility and streamlines the transportation systems in cities.
Micro-mobility-Vehicles-Market Analysis and Segmental Data
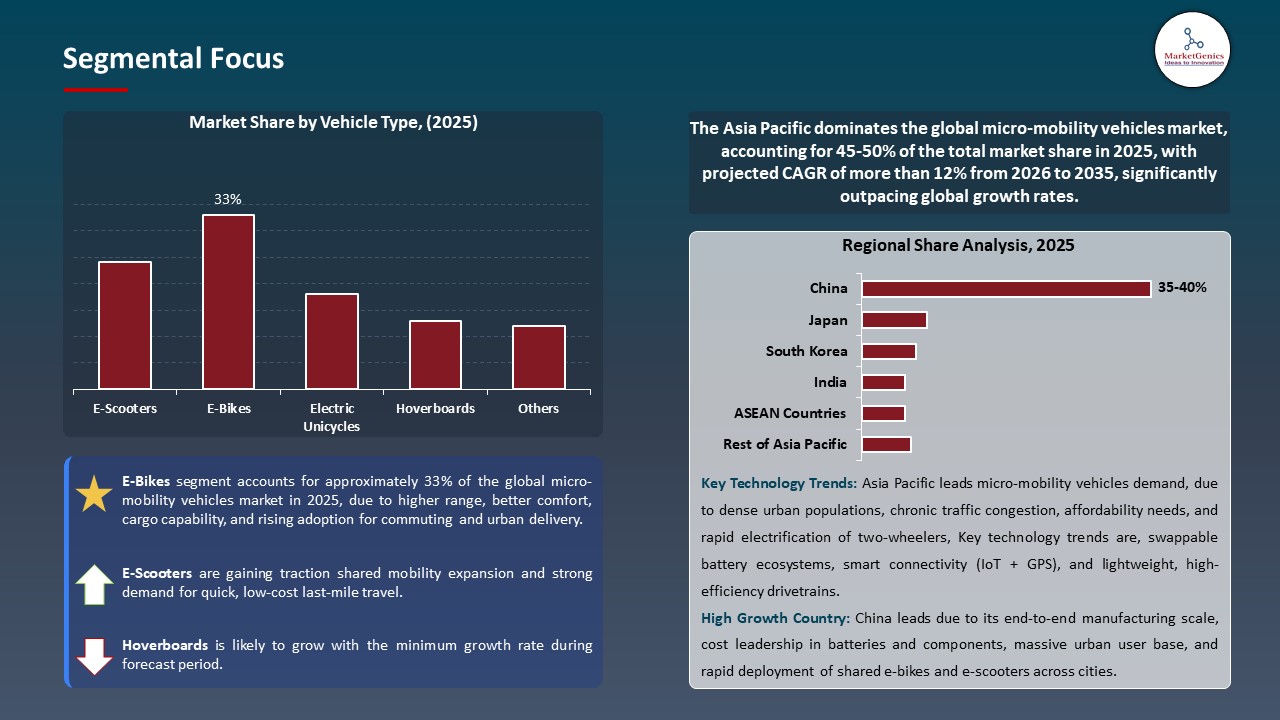
E-Bikes Dominate Global Micro-mobility Vehicles Market
-
The e-bikes segment dominates the global micro-mobility vehicles market, as it includes convenience, affordability and eco friendliness. Their adoption has been hastened by increasing urban congestion and the need to move deliveries over the last mile in Europe and Asia-Pacific.
- For instance, in 2024, Xiaomi has released its Electric Bike series in several countries with smart connectivity and long-range batteries, which greatly increased the sales and popularity of e-bikes compared to regular scooters.
- The trend continued into 2025 as manufacturers focused on enhancing performance, comfort, and battery efficiency, cementing e-bikes’ dominance in urban mobility solutions.
- The utilization of e-bikes is changing the transport culture in cities, improving traffic navigation and carbon footprint and introducing new prospects to micro-mobility infrastructure and services.
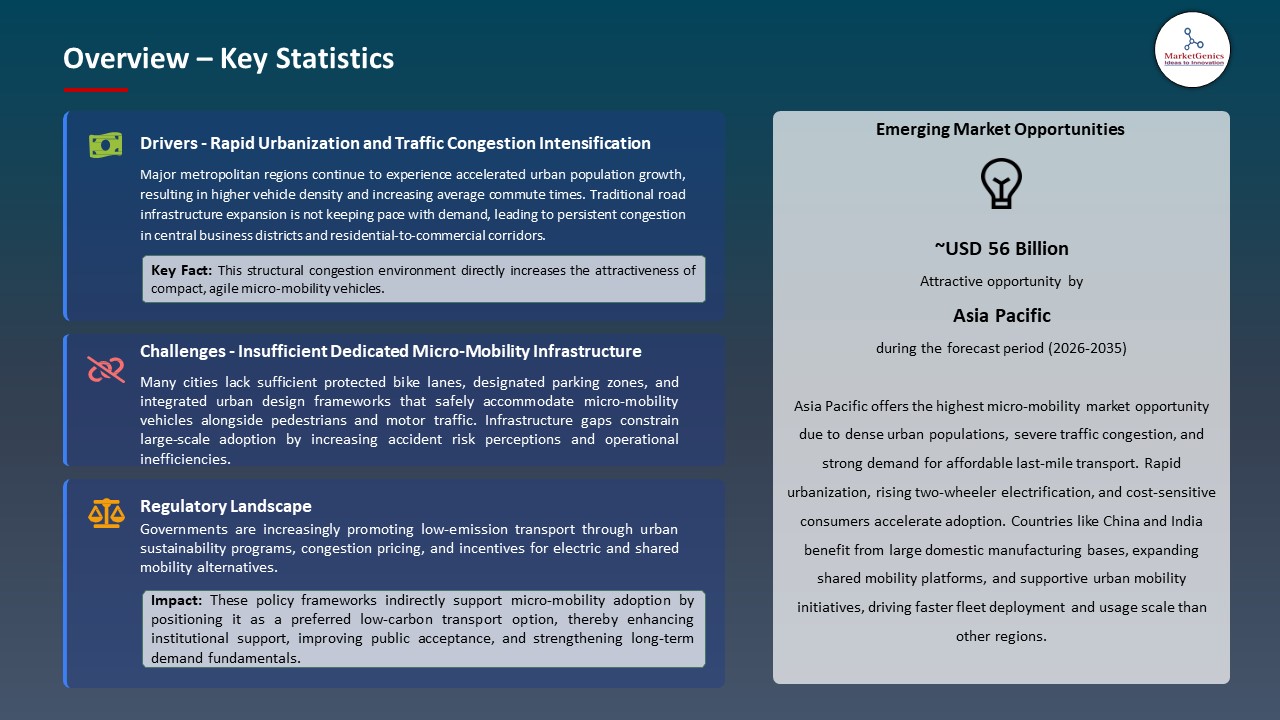
Asia Pacific Leads Global Micro-mobility Vehicles Market Demand
-
Asia Pacific leads the micro-mobility vehicles market, owing to rapid urbanization, high population density, and government policies that support economic, transport-friendly, and environmentally-friendly vehicles. Moreover, the quick pace of cities in such countries as China, India, Japan, and Southeast Asian countries is creating pressure in the use of e-bikes, scooters, and shared micro-mobility options as an alternative to congested streets and high prices of vehicles.
- In addition, the charging networks, battery-swapping stations, and smart mobility services have been rapidly developed in Asia Pacific, which increases the assimilation of micro-mobility vehicles. The sector businesses in the region are expanding operations to keep up with this demand, such as Oyika increased its battery-swapping services and installed swappable batteries and battery stations in 2024-2025 in Thailand, making the use of electric motorbikes easier and faster electric vehicle adoption in Thailand.
- The dominance in the Asia Pacific micro-mobility demand has been redefining the transport ecosystems in the region, minimizing emissions and traffic congestion and creating investment opportunities in EV infrastructure, production, and service networks.
Micro-mobility-Vehicles-Market Ecosystem
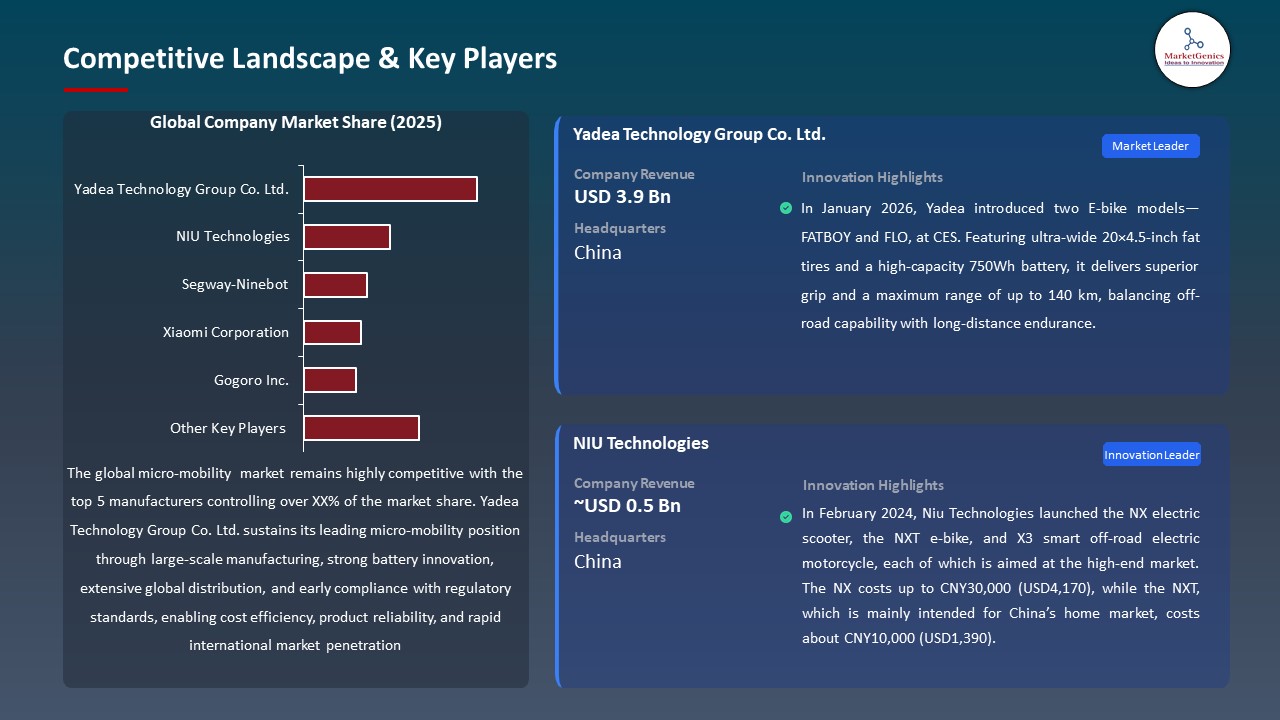
The global micro-mobility vehicles market is moderately fragmented, with high concentration among key players such as Yadea Technology Group Co. Ltd., NIU Technologies, Segway-Ninebot, Xiaomi Corporation, and Gogoro Inc., dominate through the product introduction strategy, technological innovation, high density of distribution channels and strong brand, helping them to seize the key markets in the region and the world and still expand their micro-mobility vehicles.
The presence of dominant actors fosters innovation, enhances the quality of products and increases the speed of micro-mobility solutions uptake in various countries across the world and generates competitive pressures that would spur smaller companies to be differentiated by offering niche products and localized services.
Recent Development and Strategic Overview:
-
In January 2025, Xiaomi Corporation launched the Xiaomi Electric Scooter 5 and 5 Pro worldwide. Featuring a robust design, improved suspension, and smart connectivity, the new models strengthen the company’s urban mobility offerings and aim to enhance the commuter experience.
- In November 2024, Gogoro Inc. extended its battery-swapping ecosystem to Chile, rolling out smart scooters and charging stations. This expansion marks a significant step in the company’s international network growth, aiming to enhance sustainable urban mobility in the region.
Report Scope
|
Detail |
|
|
Market Size in 2025 |
USD 89.6 Bn |
|
Market Forecast Value in 2035 |
USD 204.6 Bn |
|
Growth Rate (CAGR) |
8.6% |
|
Forecast Period |
2026 – 2035 |
|
Historical Data Available for |
2021 – 2024 |
|
Market Size Units |
US$ Billion for Value Million Units for Volume |
|
Report Format |
Electronic (PDF) + Excel |
|
North America |
Europe |
Asia Pacific |
Middle East |
Africa |
South America |
|
|
|
|
|
|
|
Companies Covered |
|||||
|
|
|
|
|
|
Micro-mobility-Vehicles-Market Segmentation and Highlights
|
Segment |
Sub-segment |
|
Micro-mobility Vehicles Market, By Vehicle Type |
|
|
Micro-mobility Vehicles Market, By Battery Type |
|
|
Micro-mobility Vehicles Market, By Voltage |
|
|
Micro-mobility Vehicles Market, By Speed Range |
|
|
Micro-mobility Vehicles Market, By Power Output |
|
|
Micro-mobility Vehicles Market, By End-use
|
|
|
Micro-mobility Vehicles Market, By Target Demographics
|
|
Frequently Asked Questions
Table of Contents
- 1. Research Methodology and Assumptions
- 1.1. Definitions
- 1.2. Research Design and Approach
- 1.3. Data Collection Methods
- 1.4. Base Estimates and Calculations
- 1.5. Forecasting Models
- 1.5.1. Key Forecast Factors & Impact Analysis
- 1.6. Secondary Research
- 1.6.1. Open Sources
- 1.6.2. Paid Databases
- 1.6.3. Associations
- 1.7. Primary Research
- 1.7.1. Primary Sources
- 1.7.2. Primary Interviews with Stakeholders across Ecosystem
- 2. Executive Summary
- 2.1. Global Micro-mobility Vehicles Market Outlook
- 2.1.1. Micro-mobility Vehicles Market Size (Volume – Million Units and Value – US$ Bn), and Forecasts, 2021-2035
- 2.1.2. Compounded Annual Growth Rate Analysis
- 2.1.3. Growth Opportunity Analysis
- 2.1.4. Segmental Share Analysis
- 2.1.5. Geographical Share Analysis
- 2.2. Market Analysis and Facts
- 2.3. Supply-Demand Analysis
- 2.4. Competitive Benchmarking
- 2.5. Go-to- Market Strategy
- 2.5.1. Customer/ End-use Industry Assessment
- 2.5.2. Growth Opportunity Data, 2026-2035
- 2.5.2.1. Regional Data
- 2.5.2.2. Country Data
- 2.5.2.3. Segmental Data
- 2.5.3. Identification of Potential Market Spaces
- 2.5.4. GAP Analysis
- 2.5.5. Potential Attractive Price Points
- 2.5.6. Prevailing Market Risks & Challenges
- 2.5.7. Preferred Sales & Marketing Strategies
- 2.5.8. Key Recommendations and Analysis
- 2.5.9. A Way Forward
- 2.1. Global Micro-mobility Vehicles Market Outlook
- 3. Industry Data and Premium Insights
- 3.1. Global Automotive & Transportation Industry Overview, 2025
- 3.1.1. Automotive & Transportation Industry Ecosystem Analysis
- 3.1.2. Key Trends for Automotive & Transportation Industry
- 3.1.3. Regional Distribution for Automotive & Transportation Industry
- 3.2. Supplier Customer Data
- 3.3. Technology Roadmap and Developments
- 3.4. Trade Analysis
- 3.4.1. Import & Export Analysis, 2025
- 3.4.2. Top Importing Countries
- 3.4.3. Top Exporting Countries
- 3.5. Trump Tariff Impact Analysis
- 3.5.1. Manufacturer
- 3.5.1.1. Based on the component & Raw material
- 3.5.2. Supply Chain
- 3.5.3. End Consumer
- 3.5.1. Manufacturer
- 3.6. Raw Material Analysis
- 3.1. Global Automotive & Transportation Industry Overview, 2025
- 4. Market Overview
- 4.1. Market Dynamics
- 4.1.1. Drivers
- 4.1.1.1. Rising urban congestion and demand for cost-effective last-mile transportation
- 4.1.1.2. Strong push for low-emission mobility through sustainability goals and incentives
- 4.1.1.3. Rapid growth of shared micro-mobility platforms and battery technology improvements
- 4.1.2. Restraints
- 4.1.2.1. Regulatory uncertainty and safety concerns across cities and countries
- 4.1.2.2. Limited supporting infrastructure such as dedicated lanes and charging networks
- 4.1.1. Drivers
- 4.2. Key Trend Analysis
- 4.3. Regulatory Framework
- 4.3.1. Key Regulations, Norms, and Subsidies, by Key Countries
- 4.3.2. Tariffs and Standards
- 4.3.3. Impact Analysis of Regulations on the Market
- 4.4. Value Chain Analysis
- 4.4.1. Component Suppliers
- 4.4.2. Vehicle Manufacturers / Assemblers
- 4.4.3. Distribution & Sales Channels
- 4.4.4. End Users
- 4.5. Cost Structure Analysis
- 4.5.1. Parameter’s Share for Cost Associated
- 4.5.2. COGP vs COGS
- 4.5.3. Profit Margin Analysis
- 4.6. Pricing Analysis
- 4.6.1. Regional Pricing Analysis
- 4.6.2. Segmental Pricing Trends
- 4.6.3. Factors Influencing Pricing
- 4.7. Porter’s Five Forces Analysis
- 4.8. PESTEL Analysis
- 4.9. Global Micro-mobility Vehicles Market Demand
- 4.9.1. Historical Market Size – Volume (Million Units) and Value (US$ Bn), 2020-2024
- 4.9.2. Current and Future Market Size – Volume (Million Units) and Value (US$ Bn), 2026–2035
- 4.9.2.1. Y-o-Y Growth Trends
- 4.9.2.2. Absolute $ Opportunity Assessment
- 4.1. Market Dynamics
- 5. Competition Landscape
- 5.1. Competition structure
- 5.1.1. Fragmented v/s consolidated
- 5.2. Company Share Analysis, 2025
- 5.2.1. Global Company Market Share
- 5.2.2. By Region
- 5.2.2.1. North America
- 5.2.2.2. Europe
- 5.2.2.3. Asia Pacific
- 5.2.2.4. Middle East
- 5.2.2.5. Africa
- 5.2.2.6. South America
- 5.3. Product Comparison Matrix
- 5.3.1. Specifications
- 5.3.2. Market Positioning
- 5.3.3. Pricing
- 5.1. Competition structure
- 6. Global Micro-mobility Vehicles Market Analysis, by Vehicle Type
- 6.1. Key Segment Analysis
- 6.2. Micro-mobility Vehicles Market Size (Volume – Million Units and Value – US$ Bn), Analysis, and Forecasts, by Vehicle Type, 2021-2035
- 6.2.1. E-Scooters
- 6.2.1.1. Standing e-scooters
- 6.2.1.2. Seated e-scooters
- 6.2.2. E-Bikes
- 6.2.2.1. Pedal-assist e-bikes
- 6.2.2.2. Throttle-controlled e-bikes
- 6.2.2.3. Speed pedelecs
- 6.2.3. Electric Skateboards
- 6.2.3.1. Longboard electric skateboards
- 6.2.3.2. Shortboard electric skateboards
- 6.2.4. Electric Unicycles
- 6.2.5. Hoverboards
- 6.2.6. Electric Mopeds
- 6.2.7. Cargo E-Bikes
- 6.2.7.1. Front-loader cargo e-bikes
- 6.2.7.2. Long-tail cargo e-bikes
- 6.2.1. E-Scooters
- 7. Global Micro-mobility Vehicles Market Analysis, by Battery Type
- 7.1. Key Segment Analysis
- 7.2. Micro-mobility Vehicles Market Size (Volume – Million Units and Value – US$ Bn), Analysis, and Forecasts, by Battery Type, 2021-2035
- 7.2.1. Lithium-ion Battery
- 7.2.2. Lithium Nickel Manganese Cobalt (NMC)
- 7.2.3. Lithium Iron Phosphate (LFP)
- 7.2.4. Lithium Nickel Cobalt Aluminum (NCA)
- 7.2.5. Lithium Polymer Battery
- 7.2.6. Lead-acid Battery
- 7.2.7. Nickel-Metal Hydride Battery
- 8. Global Micro-mobility Vehicles Market Analysis, by Voltage
- 8.1. Key Segment Analysis
- 8.2. Micro-mobility Vehicles Market Size (Volume – Million Units and Value – US$ Bn), Analysis, and Forecasts, by Voltage, 2021-2035
- 8.2.1. 24V
- 8.2.2. 36V
- 8.2.3. 48V
- 8.2.4. 60V and Above
- 9. Global Micro-mobility Vehicles Market Analysis, by Speed Range
- 9.1. Key Segment Analysis
- 9.2. Micro-mobility Vehicles Market Size (Volume – Million Units and Value – US$ Bn), Analysis, and Forecasts, by Speed Range, 2021-2035
- 9.2.1. Up to 25 km/h
- 9.2.2. 25-45 km/h
- 9.2.3. Above 45 km/h
- 10. Global Micro-mobility Vehicles Market Analysis, by Power Output
- 10.1. Key Segment Analysis
- 10.2. Micro-mobility Vehicles Market Size (Volume – Million Units and Value – US$ Bn), Analysis, and Forecasts, by Power Output, 2021-2035
- 10.2.1. Below 250W
- 10.2.2. 250W-500W
- 10.2.3. 500W-750W
- 10.2.4. Above 750W
- 11. Global Micro-mobility Vehicles Market Analysis and Forecasts, by End-use
- 11.1. Key Findings
- 11.2. Micro-mobility Vehicles Market Size (Volume – Million Units and Value – US$ Bn), Analysis, and Forecasts, by End-use, 2021-2035
- 11.2.1. Commercial
- 11.2.1.1. Last-mile Delivery Services
- 11.2.1.2. Food and Grocery Delivery
- 11.2.1.3. Parcel and Courier Services
- 11.2.1.4. E-commerce Logistics
- 11.2.1.5. Ride-sharing Services
- 11.2.1.6. Fleet Operations
- 11.2.1.7. Campus Transportation
- 11.2.1.8. Tourism and Sightseeing
- 11.2.1.9. Security and Patrol Services
- 11.2.1.10. Others
- 11.2.2. Personal/Individual
- 11.2.2.1. Daily Commuting
- 11.2.2.1.1. Home to Office
- 11.2.2.1.2. Home to Transit Stations
- 11.2.2.2. Recreational Activities
- 11.2.2.2.1. Leisure Riding
- 11.2.2.2.2. Sports and Adventure
- 11.2.2.2.3. Shopping and Errands
- 11.2.2.3. Others
- 11.2.2.1. Daily Commuting
- 11.2.3. Municipal/Government
- 11.2.4. Public Transportation Integration
- 11.2.4.1. Emergency Response Services
- 11.2.4.2. Municipal Maintenance Operations
- 11.2.4.3. Park and Recreation Services
- 11.2.4.4. Others
- 11.2.1. Commercial
- 12. Global Micro-mobility Vehicles Market Analysis and Forecasts, by Target Demographics
- 12.1. Key Findings
- 12.2. Micro-mobility Vehicles Market Size (Volume – Million Units and Value – US$ Bn), Analysis, and Forecasts, by Target Demographics, 2021-2035
- 12.2.1. Students (Age 15-24)
- 12.2.2. Young Professionals (Age 25-40)
- 12.2.3. Middle-aged Adults (Age 41-60)
- 12.2.4. Senior Citizens (Above 60)
- 13. Global Micro-mobility Vehicles Market Analysis and Forecasts, by Region
- 13.1. Key Findings
- 13.2. Micro-mobility Vehicles Market Size (Volume – Million Units and Value – US$ Bn), Analysis, and Forecasts, by Region, 2021-2035
- 13.2.1. North America
- 13.2.2. Europe
- 13.2.3. Asia Pacific
- 13.2.4. Middle East
- 13.2.5. Africa
- 13.2.6. South America
- 14. North America Micro-mobility Vehicles Market Analysis
- 14.1. Key Segment Analysis
- 14.2. Regional Snapshot
- 14.3. North America Micro-mobility Vehicles Market Size (Volume – Million Units and Value – US$ Bn), Analysis, and Forecasts, 2021-2035
- 14.3.1. Vehicle Type
- 14.3.2. Battery Type
- 14.3.3. Voltage
- 14.3.4. Speed Range
- 14.3.5. Power Output
- 14.3.6. End-use
- 14.3.7. Target Demographics
- 14.3.8. Country
- 14.3.8.1. USA
- 14.3.8.2. Canada
- 14.3.8.3. Mexico
- 14.4. USA Micro-mobility Vehicles Market
- 14.4.1. Country Segmental Analysis
- 14.4.2. Vehicle Type
- 14.4.3. Battery Type
- 14.4.4. Voltage
- 14.4.5. Speed Range
- 14.4.6. Power Output
- 14.4.7. End-use
- 14.4.8. Target Demographics
- 14.5. Canada Micro-mobility Vehicles Market
- 14.5.1. Country Segmental Analysis
- 14.5.2. Vehicle Type
- 14.5.3. Battery Type
- 14.5.4. Voltage
- 14.5.5. Speed Range
- 14.5.6. Power Output
- 14.5.7. End-use
- 14.5.8. Target Demographics
- 14.6. Mexico Micro-mobility Vehicles Market
- 14.6.1. Country Segmental Analysis
- 14.6.2. Vehicle Type
- 14.6.3. Battery Type
- 14.6.4. Voltage
- 14.6.5. Speed Range
- 14.6.6. Power Output
- 14.6.7. End-use
- 14.6.8. Target Demographics
- 15. Europe Micro-mobility Vehicles Market Analysis
- 15.1. Key Segment Analysis
- 15.2. Regional Snapshot
- 15.3. Europe Micro-mobility Vehicles Market Size (Volume – Million Units and Value – US$ Bn), Analysis, and Forecasts, 2021-2035
- 15.3.1. Vehicle Type
- 15.3.2. Battery Type
- 15.3.3. Voltage
- 15.3.4. Speed Range
- 15.3.5. Power Output
- 15.3.6. End-use
- 15.3.7. Target Demographics
- 15.3.8. Country
- 15.3.8.1. Germany
- 15.3.8.2. United Kingdom
- 15.3.8.3. France
- 15.3.8.4. Italy
- 15.3.8.5. Spain
- 15.3.8.6. Netherlands
- 15.3.8.7. Nordic Countries
- 15.3.8.8. Poland
- 15.3.8.9. Russia & CIS
- 15.3.8.10. Rest of Europe
- 15.4. Germany Micro-mobility Vehicles Market
- 15.4.1. Country Segmental Analysis
- 15.4.2. Vehicle Type
- 15.4.3. Battery Type
- 15.4.4. Voltage
- 15.4.5. Speed Range
- 15.4.6. Power Output
- 15.4.7. End-use
- 15.4.8. Target Demographics
- 15.5. United Kingdom Micro-mobility Vehicles Market
- 15.5.1. Country Segmental Analysis
- 15.5.2. Vehicle Type
- 15.5.3. Battery Type
- 15.5.4. Voltage
- 15.5.5. Speed Range
- 15.5.6. Power Output
- 15.5.7. End-use
- 15.5.8. Target Demographics
- 15.6. France Micro-mobility Vehicles Market
- 15.6.1. Country Segmental Analysis
- 15.6.2. Vehicle Type
- 15.6.3. Battery Type
- 15.6.4. Voltage
- 15.6.5. Speed Range
- 15.6.6. Power Output
- 15.6.7. End-use
- 15.6.8. Target Demographics
- 15.7. Italy Micro-mobility Vehicles Market
- 15.7.1. Country Segmental Analysis
- 15.7.2. Vehicle Type
- 15.7.3. Battery Type
- 15.7.4. Voltage
- 15.7.5. Speed Range
- 15.7.6. Power Output
- 15.7.7. End-use
- 15.7.8. Target Demographics
- 15.8. Spain Micro-mobility Vehicles Market
- 15.8.1. Country Segmental Analysis
- 15.8.2. Vehicle Type
- 15.8.3. Battery Type
- 15.8.4. Voltage
- 15.8.5. Speed Range
- 15.8.6. Power Output
- 15.8.7. End-use
- 15.8.8. Target Demographics
- 15.9. Netherlands Micro-mobility Vehicles Market
- 15.9.1. Country Segmental Analysis
- 15.9.2. Vehicle Type
- 15.9.3. Battery Type
- 15.9.4. Voltage
- 15.9.5. Speed Range
- 15.9.6. Power Output
- 15.9.7. End-use
- 15.9.8. Target Demographics
- 15.10. Nordic Countries Micro-mobility Vehicles Market
- 15.10.1. Country Segmental Analysis
- 15.10.2. Vehicle Type
- 15.10.3. Battery Type
- 15.10.4. Voltage
- 15.10.5. Speed Range
- 15.10.6. Power Output
- 15.10.7. End-use
- 15.10.8. Target Demographics
- 15.11. Poland Micro-mobility Vehicles Market
- 15.11.1. Country Segmental Analysis
- 15.11.2. Vehicle Type
- 15.11.3. Battery Type
- 15.11.4. Voltage
- 15.11.5. Speed Range
- 15.11.6. Power Output
- 15.11.7. End-use
- 15.11.8. Target Demographics
- 15.12. Russia & CIS Micro-mobility Vehicles Market
- 15.12.1. Country Segmental Analysis
- 15.12.2. Vehicle Type
- 15.12.3. Battery Type
- 15.12.4. Voltage
- 15.12.5. Speed Range
- 15.12.6. Power Output
- 15.12.7. End-use
- 15.12.8. Target Demographics
- 15.13. Rest of Europe Micro-mobility Vehicles Market
- 15.13.1. Country Segmental Analysis
- 15.13.2. Vehicle Type
- 15.13.3. Battery Type
- 15.13.4. Voltage
- 15.13.5. Speed Range
- 15.13.6. Power Output
- 15.13.7. End-use
- 15.13.8. Target Demographics
- 16. Asia Pacific Micro-mobility Vehicles Market Analysis
- 16.1. Key Segment Analysis
- 16.2. Regional Snapshot
- 16.3. Asia Pacific Micro-mobility Vehicles Market Size (Volume – Million Units and Value – US$ Bn), Analysis, and Forecasts, 2021-2035
- 16.3.1. Vehicle Type
- 16.3.2. Battery Type
- 16.3.3. Voltage
- 16.3.4. Speed Range
- 16.3.5. Power Output
- 16.3.6. End-use
- 16.3.7. Target Demographics
- 16.3.8. Country
- 16.3.8.1. China
- 16.3.8.2. India
- 16.3.8.3. Japan
- 16.3.8.4. South Korea
- 16.3.8.5. Australia and New Zealand
- 16.3.8.6. Indonesia
- 16.3.8.7. Malaysia
- 16.3.8.8. Thailand
- 16.3.8.9. Vietnam
- 16.3.8.10. Rest of Asia Pacific
- 16.4. China Micro-mobility Vehicles Market
- 16.4.1. Country Segmental Analysis
- 16.4.2. Vehicle Type
- 16.4.3. Battery Type
- 16.4.4. Voltage
- 16.4.5. Speed Range
- 16.4.6. Power Output
- 16.4.7. End-use
- 16.4.8. Target Demographics
- 16.5. India Micro-mobility Vehicles Market
- 16.5.1. Country Segmental Analysis
- 16.5.2. Vehicle Type
- 16.5.3. Battery Type
- 16.5.4. Voltage
- 16.5.5. Speed Range
- 16.5.6. Power Output
- 16.5.7. End-use
- 16.5.8. Target Demographics
- 16.6. Japan Micro-mobility Vehicles Market
- 16.6.1. Country Segmental Analysis
- 16.6.2. Vehicle Type
- 16.6.3. Battery Type
- 16.6.4. Voltage
- 16.6.5. Speed Range
- 16.6.6. Power Output
- 16.6.7. End-use
- 16.6.8. Target Demographics
- 16.7. South Korea Micro-mobility Vehicles Market
- 16.7.1. Country Segmental Analysis
- 16.7.2. Vehicle Type
- 16.7.3. Battery Type
- 16.7.4. Voltage
- 16.7.5. Speed Range
- 16.7.6. Power Output
- 16.7.7. End-use
- 16.7.8. Target Demographics
- 16.8. Australia and New Zealand Micro-mobility Vehicles Market
- 16.8.1. Country Segmental Analysis
- 16.8.2. Vehicle Type
- 16.8.3. Battery Type
- 16.8.4. Voltage
- 16.8.5. Speed Range
- 16.8.6. Power Output
- 16.8.7. End-use
- 16.8.8. Target Demographics
- 16.9. Indonesia Micro-mobility Vehicles Market
- 16.9.1. Country Segmental Analysis
- 16.9.2. Vehicle Type
- 16.9.3. Battery Type
- 16.9.4. Voltage
- 16.9.5. Speed Range
- 16.9.6. Power Output
- 16.9.7. End-use
- 16.9.8. Target Demographics
- 16.10. Malaysia Micro-mobility Vehicles Market
- 16.10.1. Country Segmental Analysis
- 16.10.2. Vehicle Type
- 16.10.3. Battery Type
- 16.10.4. Voltage
- 16.10.5. Speed Range
- 16.10.6. Power Output
- 16.10.7. End-use
- 16.10.8. Target Demographics
- 16.11. Thailand Micro-mobility Vehicles Market
- 16.11.1. Country Segmental Analysis
- 16.11.2. Vehicle Type
- 16.11.3. Battery Type
- 16.11.4. Voltage
- 16.11.5. Speed Range
- 16.11.6. Power Output
- 16.11.7. End-use
- 16.11.8. Target Demographics
- 16.12. Vietnam Micro-mobility Vehicles Market
- 16.12.1. Country Segmental Analysis
- 16.12.2. Vehicle Type
- 16.12.3. Battery Type
- 16.12.4. Voltage
- 16.12.5. Speed Range
- 16.12.6. Power Output
- 16.12.7. End-use
- 16.12.8. Target Demographics
- 16.13. Rest of Asia Pacific Micro-mobility Vehicles Market
- 16.13.1. Country Segmental Analysis
- 16.13.2. Vehicle Type
- 16.13.3. Battery Type
- 16.13.4. Voltage
- 16.13.5. Speed Range
- 16.13.6. Power Output
- 16.13.7. End-use
- 16.13.8. Target Demographics
- 17. Middle East Micro-mobility Vehicles Market Analysis
- 17.1. Key Segment Analysis
- 17.2. Regional Snapshot
- 17.3. Middle East Micro-mobility Vehicles Market Size (Volume – Million Units and Value – US$ Bn), Analysis, and Forecasts, 2021-2035
- 17.3.1. Vehicle Type
- 17.3.2. Battery Type
- 17.3.3. Voltage
- 17.3.4. Speed Range
- 17.3.5. Power Output
- 17.3.6. End-use
- 17.3.7. Target Demographics
- 17.3.8. Country
- 17.3.8.1. Turkey
- 17.3.8.2. UAE
- 17.3.8.3. Saudi Arabia
- 17.3.8.4. Israel
- 17.3.8.5. Rest of Middle East
- 17.4. Turkey Micro-mobility Vehicles Market
- 17.4.1. Country Segmental Analysis
- 17.4.2. Vehicle Type
- 17.4.3. Battery Type
- 17.4.4. Voltage
- 17.4.5. Speed Range
- 17.4.6. Power Output
- 17.4.7. End-use
- 17.4.8. Target Demographics
- 17.5. UAE Micro-mobility Vehicles Market
- 17.5.1. Country Segmental Analysis
- 17.5.2. Vehicle Type
- 17.5.3. Battery Type
- 17.5.4. Voltage
- 17.5.5. Speed Range
- 17.5.6. Power Output
- 17.5.7. End-use
- 17.5.8. Target Demographics
- 17.6. Saudi Arabia Micro-mobility Vehicles Market
- 17.6.1. Country Segmental Analysis
- 17.6.2. Vehicle Type
- 17.6.3. Battery Type
- 17.6.4. Voltage
- 17.6.5. Speed Range
- 17.6.6. Power Output
- 17.6.7. End-use
- 17.6.8. Target Demographics
- 17.7. Israel Micro-mobility Vehicles Market
- 17.7.1. Country Segmental Analysis
- 17.7.2. Vehicle Type
- 17.7.3. Battery Type
- 17.7.4. Voltage
- 17.7.5. Speed Range
- 17.7.6. Power Output
- 17.7.7. End-use
- 17.7.8. Target Demographics
- 17.8. Rest of Middle East Micro-mobility Vehicles Market
- 17.8.1. Country Segmental Analysis
- 17.8.2. Vehicle Type
- 17.8.3. Battery Type
- 17.8.4. Voltage
- 17.8.5. Speed Range
- 17.8.6. Power Output
- 17.8.7. End-use
- 17.8.8. Target Demographics
- 18. Africa Micro-mobility Vehicles Market Analysis
- 18.1. Key Segment Analysis
- 18.2. Regional Snapshot
- 18.3. Africa Micro-mobility Vehicles Market Size (Volume – Million Units and Value – US$ Bn), Analysis, and Forecasts, 2021-2035
- 18.3.1. Vehicle Type
- 18.3.2. Battery Type
- 18.3.3. Voltage
- 18.3.4. Speed Range
- 18.3.5. Power Output
- 18.3.6. End-use
- 18.3.7. Target Demographics
- 18.3.8. Country
- 18.3.8.1. South Africa
- 18.3.8.2. Egypt
- 18.3.8.3. Nigeria
- 18.3.8.4. Algeria
- 18.3.8.5. Rest of Africa
- 18.4. South Africa Micro-mobility Vehicles Market
- 18.4.1. Country Segmental Analysis
- 18.4.2. Vehicle Type
- 18.4.3. Battery Type
- 18.4.4. Voltage
- 18.4.5. Speed Range
- 18.4.6. Power Output
- 18.4.7. End-use
- 18.4.8. Target Demographics
- 18.5. Egypt Micro-mobility Vehicles Market
- 18.5.1. Country Segmental Analysis
- 18.5.2. Vehicle Type
- 18.5.3. Battery Type
- 18.5.4. Voltage
- 18.5.5. Speed Range
- 18.5.6. Power Output
- 18.5.7. End-use
- 18.5.8. Target Demographics
- 18.6. Nigeria Micro-mobility Vehicles Market
- 18.6.1. Country Segmental Analysis
- 18.6.2. Vehicle Type
- 18.6.3. Battery Type
- 18.6.4. Voltage
- 18.6.5. Speed Range
- 18.6.6. Power Output
- 18.6.7. End-use
- 18.6.8. Target Demographics
- 18.7. Algeria Micro-mobility Vehicles Market
- 18.7.1. Country Segmental Analysis
- 18.7.2. Vehicle Type
- 18.7.3. Battery Type
- 18.7.4. Voltage
- 18.7.5. Speed Range
- 18.7.6. Power Output
- 18.7.7. End-use
- 18.7.8. Target Demographics
- 18.8. Rest of Africa Micro-mobility Vehicles Market
- 18.8.1. Country Segmental Analysis
- 18.8.2. Vehicle Type
- 18.8.3. Battery Type
- 18.8.4. Voltage
- 18.8.5. Speed Range
- 18.8.6. Power Output
- 18.8.7. End-use
- 18.8.8. Target Demographics
- 19. South America Micro-mobility Vehicles Market Analysis
- 19.1. Key Segment Analysis
- 19.2. Regional Snapshot
- 19.3. South America Micro-mobility Vehicles Market Size (Volume – Million Units and Value – US$ Bn), Analysis, and Forecasts, 2021-2035
- 19.3.1. Vehicle Type
- 19.3.2. Battery Type
- 19.3.3. Voltage
- 19.3.4. Speed Range
- 19.3.5. Power Output
- 19.3.6. End-use
- 19.3.7. Target Demographics
- 19.3.8. Country
- 19.3.8.1. Brazil
- 19.3.8.2. Argentina
- 19.3.8.3. Rest of South America
- 19.4. Brazil Micro-mobility Vehicles Market
- 19.4.1. Country Segmental Analysis
- 19.4.2. Vehicle Type
- 19.4.3. Battery Type
- 19.4.4. Voltage
- 19.4.5. Speed Range
- 19.4.6. Power Output
- 19.4.7. End-use
- 19.4.8. Target Demographics
- 19.5. Argentina Micro-mobility Vehicles Market
- 19.5.1. Country Segmental Analysis
- 19.5.2. Vehicle Type
- 19.5.3. Battery Type
- 19.5.4. Voltage
- 19.5.5. Speed Range
- 19.5.6. Power Output
- 19.5.7. End-use
- 19.5.8. Target Demographics
- 19.6. Rest of South America Micro-mobility Vehicles Market
- 19.6.1. Country Segmental Analysis
- 19.6.2. Vehicle Type
- 19.6.3. Battery Type
- 19.6.4. Voltage
- 19.6.5. Speed Range
- 19.6.6. Power Output
- 19.6.7. End-use
- 19.6.8. Target Demographics
- 20. Key Players/ Company Profile
- 20.1. Ather Energy
- 20.1.1. Company Details/ Overview
- 20.1.2. Company Financials
- 20.1.3. Key Customers and Competitors
- 20.1.4. Business/ Industry Portfolio
- 20.1.5. Product Portfolio/ Specification Details
- 20.1.6. Pricing Data
- 20.1.7. Strategic Overview
- 20.1.8. Recent Developments
- 20.2. Bird Rides Inc.
- 20.3. Bolt Technology OÜ
- 20.4. Gogoro Inc.
- 20.5. GOVECS Group
- 20.6. Lime (Neutron Holdings Inc.)
- 20.7. Lyft Inc.
- 20.8. NIU Technologies
- 20.9. Okai
- 20.10. Ola Electric Mobility
- 20.11. Rad Power Bikes
- 20.12. Razor USA LLC
- 20.13. Riese & Müller
- 20.14. Segway-Ninebot
- 20.15. Spin (Ford Mobility)
- 20.16. Vmoto Limited
- 20.17. Voi Technology AB
- 20.18. Xiaomi Corporation
- 20.19. Yadea Technology Group Co. Ltd.
- 20.20. Zero Motorcycles Inc.
- 20.21. Other Key Players
- 20.1. Ather Energy
Note* - This is just tentative list of players. While providing the report, we will cover more number of players based on their revenue and share for each geography
Research Design
Our research design integrates both demand-side and supply-side analysis through a balanced combination of primary and secondary research methodologies. By utilizing both bottom-up and top-down approaches alongside rigorous data triangulation methods, we deliver robust market intelligence that supports strategic decision-making.
MarketGenics' comprehensive research design framework ensures the delivery of accurate, reliable, and actionable market intelligence. Through the integration of multiple research approaches, rigorous validation processes, and expert analysis, we provide our clients with the insights needed to make informed strategic decisions and capitalize on market opportunities.

MarketGenics leverages a dedicated industry panel of experts and a comprehensive suite of paid databases to effectively collect, consolidate, and analyze market intelligence.
Our approach has consistently proven to be reliable and effective in generating accurate market insights, identifying key industry trends, and uncovering emerging business opportunities.
Through both primary and secondary research, we capture and analyze critical company-level data such as manufacturing footprints, including technical centers, R&D facilities, sales offices, and headquarters.
Our expert panel further enhances our ability to estimate market size for specific brands based on validated field-level intelligence.
Our data mining techniques incorporate both parametric and non-parametric methods, allowing for structured data collection, sorting, processing, and cleaning.
Demand projections are derived from large-scale data sets analyzed through proprietary algorithms, culminating in robust and reliable market sizing.
Research Approach
The bottom-up approach builds market estimates by starting with the smallest addressable market units and systematically aggregating them to create comprehensive market size projections.
This method begins with specific, granular data points and builds upward to create the complete market landscape.
Customer Analysis → Segmental Analysis → Geographical Analysis
The top-down approach starts with the broadest possible market data and systematically narrows it down through a series of filters and assumptions to arrive at specific market segments or opportunities.
This method begins with the big picture and works downward to increasingly specific market slices.
TAM → SAM → SOM


Research Methods
Desk / Secondary Research
While analysing the market, we extensively study secondary sources, directories, and databases to identify and collect information useful for this technical, market-oriented, and commercial report. Secondary sources that we utilize are not only the public sources, but it is a combination of Open Source, Associations, Paid Databases, MG Repository & Knowledgebase, and others.
- Company websites, annual reports, financial reports, broker reports, and investor presentations
- National government documents, statistical databases and reports
- News articles, press releases and web-casts specific to the companies operating in the market, Magazines, reports, and others
- We gather information from commercial data sources for deriving company specific data such as segmental revenue, share for geography, product revenue, and others
- Internal and external proprietary databases (industry-specific), relevant patent, and regulatory databases
- Governing Bodies, Government Organizations
- Relevant Authorities, Country-specific Associations for Industries
We also employ the model mapping approach to estimate the product level market data through the players' product portfolio
Primary Research
Primary research/ interviews is vital in analyzing the market. Most of the cases involves paid primary interviews. Primary sources include primary interviews through e-mail interactions, telephonic interviews, surveys as well as face-to-face interviews with the different stakeholders across the value chain including several industry experts.
| Type of Respondents | Number of Primaries |
|---|---|
| Tier 2/3 Suppliers | ~20 |
| Tier 1 Suppliers | ~25 |
| End-users | ~25 |
| Industry Expert/ Panel/ Consultant | ~30 |
| Total | ~100 |
MG Knowledgebase
• Repository of industry blog, newsletter and case studies
• Online platform covering detailed market reports, and company profiles
Forecasting Factors and Models
Forecasting Factors
- Historical Trends – Past market patterns, cycles, and major events that shaped how markets behave over time. Understanding past trends helps predict future behavior.
- Industry Factors – Specific characteristics of the industry like structure, regulations, and innovation cycles that affect market dynamics.
- Macroeconomic Factors – Economic conditions like GDP growth, inflation, and employment rates that affect how much money people have to spend.
- Demographic Factors – Population characteristics like age, income, and location that determine who can buy your product.
- Technology Factors – How quickly people adopt new technology and how much technology infrastructure exists.
- Regulatory Factors – Government rules, laws, and policies that can help or restrict market growth.
- Competitive Factors – Analyzing competition structure such as degree of competition and bargaining power of buyers and suppliers.
Forecasting Models / Techniques
Multiple Regression Analysis
- Identify and quantify factors that drive market changes
- Statistical modeling to establish relationships between market drivers and outcomes
Time Series Analysis – Seasonal Patterns
- Understand regular cyclical patterns in market demand
- Advanced statistical techniques to separate trend, seasonal, and irregular components
Time Series Analysis – Trend Analysis
- Identify underlying market growth patterns and momentum
- Statistical analysis of historical data to project future trends
Expert Opinion – Expert Interviews
- Gather deep industry insights and contextual understanding
- In-depth interviews with key industry stakeholders
Multi-Scenario Development
- Prepare for uncertainty by modeling different possible futures
- Creating optimistic, pessimistic, and most likely scenarios
Time Series Analysis – Moving Averages
- Sophisticated forecasting for complex time series data
- Auto-regressive integrated moving average models with seasonal components
Econometric Models
- Apply economic theory to market forecasting
- Sophisticated economic models that account for market interactions
Expert Opinion – Delphi Method
- Harness collective wisdom of industry experts
- Structured, multi-round expert consultation process
Monte Carlo Simulation
- Quantify uncertainty and probability distributions
- Thousands of simulations with varying input parameters
Research Analysis
Our research framework is built upon the fundamental principle of validating market intelligence from both demand and supply perspectives. This dual-sided approach ensures comprehensive market understanding and reduces the risk of single-source bias.
Demand-Side Analysis: We understand end-user/application behavior, preferences, and market needs along with the penetration of the product for specific application.
Supply-Side Analysis: We estimate overall market revenue, analyze the segmental share along with industry capacity, competitive landscape, and market structure.
Validation & Evaluation
Data triangulation is a validation technique that uses multiple methods, sources, or perspectives to examine the same research question, thereby increasing the credibility and reliability of research findings. In market research, triangulation serves as a quality assurance mechanism that helps identify and minimize bias, validate assumptions, and ensure accuracy in market estimates.
- Data Source Triangulation – Using multiple data sources to examine the same phenomenon
- Methodological Triangulation – Using multiple research methods to study the same research question
- Investigator Triangulation – Using multiple researchers or analysts to examine the same data
- Theoretical Triangulation – Using multiple theoretical perspectives to interpret the same data

Custom Market Research Services
We will customise the research for you, in case the report listed above does not meet your requirements.
Get 10% Free Customisation