Observability Platform Market Size, Share & Trends Analysis Report Component (Platform, Services), Deployment Mode, Organization Size, Data Type, Technology, Pricing Model, Integration Type, Analytics Type, End-use Industry, and Geography (North America, Europe, Asia Pacific, Middle East, Africa, and South America) – Global Industry Data, Trends, and Forecasts, 2026–2035
|
|
|
Segmental Data Insights |
|
|
Demand Trends |
|
|
Competitive Landscape |
|
|
Strategic Development |
|
|
Future Outlook & Opportunities |
|
Observability Platform Market Size, Share, and Growth
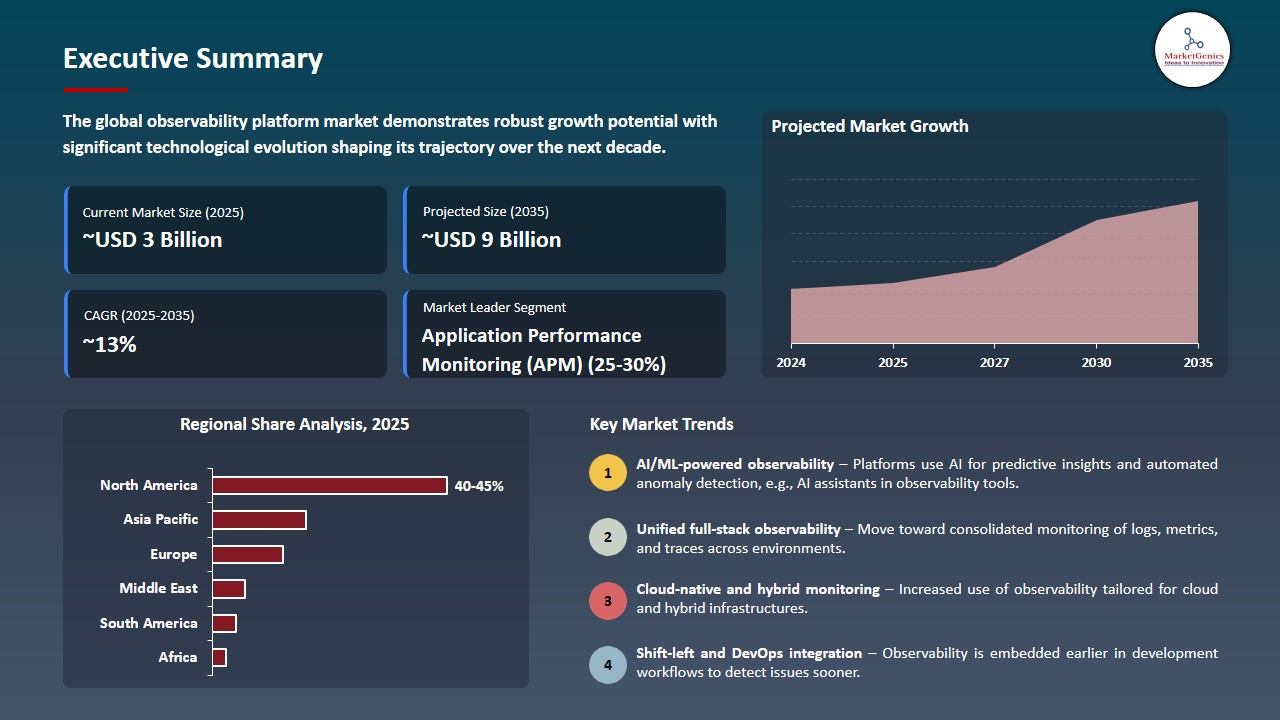
The global observability platform market is exhibiting strong growth, with an estimated value of USD 2.8 billion in 2025 and USD 9.3 billion by 2035, achieving a CAGR of 12.7%, during the forecast period. The global observability platform market is driven by the rapid adoption of multi-cloud and hybrid IT environments, increasing complexity of applications, the need for real-time performance monitoring, AI‑driven analytics for proactive issue resolution, and growing DevOps adoption to ensure reliability, scalability, and enhanced user experience.
“Agents represent the evolution beyond chat assistants, unlocking the potential of generative AI. As we equip these agents with more tools, comprehensive observability is essential to confidently transition use cases into production. Our partnership with Datadog ensures teams have the visibility and insights needed to deploy agentic solutions at scale,” said Timothée Lacroix, Co-founder & CTO at Mistral AI.
The growing enterprise need of AI-based analytics and automated incident resolution is driving the observability platform market, as organizations demand greater real-time insights into distributed cloud and hybrid environments. For instance, in January 2025 Dynatrace released high-tech AI-enhanced observability which automatizes root-cause analysis and provides accurate performance diagnostics across highly-complex systems. Observability Artificial Intelligence reduces the time of real-time understanding, boosts the speed of resolving an issue, and the overall reliability of the system.
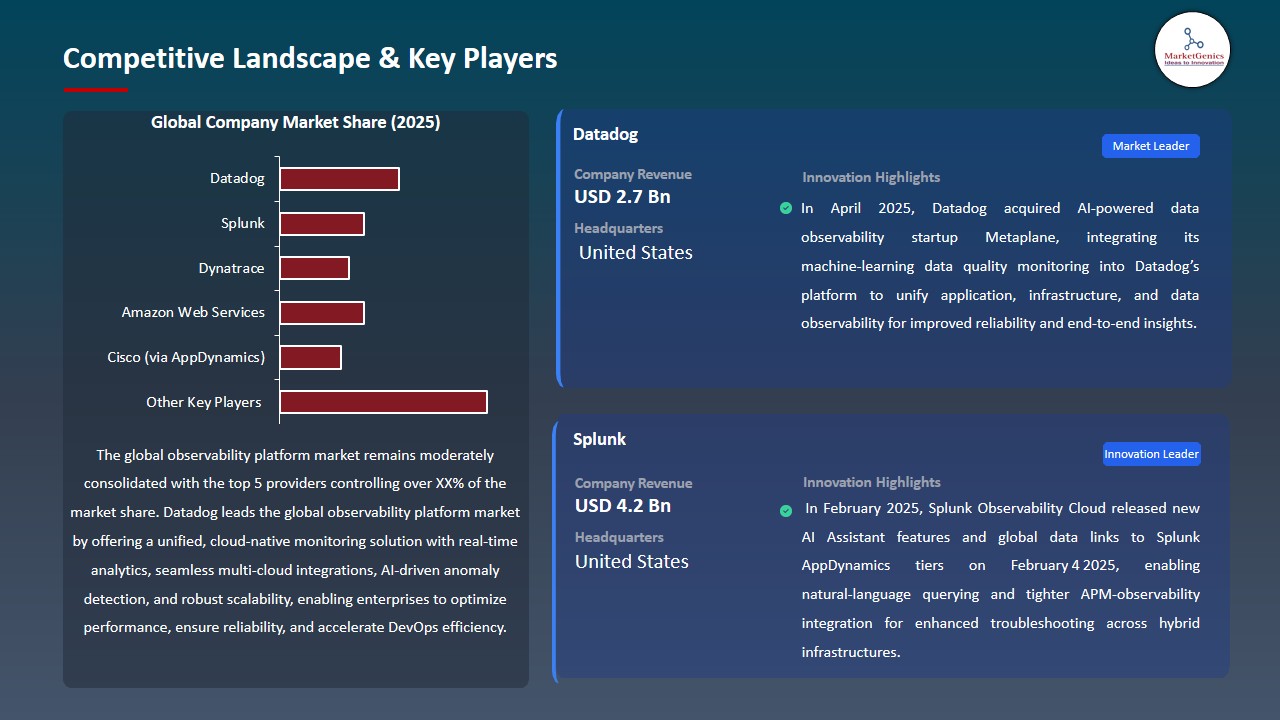
Moreover, the businesses are increasingly embracing an integrated observability platform which integrates data, applications, and infrastructure monitoring, which is growing by enabling real-time visibility, simplified troubleshooting, and better operational efficiency in highly complex, cloud-native architectures. For instance, in April 2025, Datadog acquired AI powered data observability startup, Metaplane, with the aim of integrating application and data observability to cloud native workloads. Cohesive observability leads to operational efficiency, faster problem solving, and development of the enterprise.
Adjacent opportunities to the Global observability platform market include AIOps platforms, cloud infrastructure monitoring tools, log management and analytics solutions, application performance monitoring (APM) software, and security observability platforms. These complementary markets allow business to improve automated insights, impose incident response, and boost reliability of IT in general. By exploiting these adjacent markets, observability adoption is expanded and generates operational restiveness on multifaceted enterprise contexts.
Observability Platform Market Dynamics and Trends
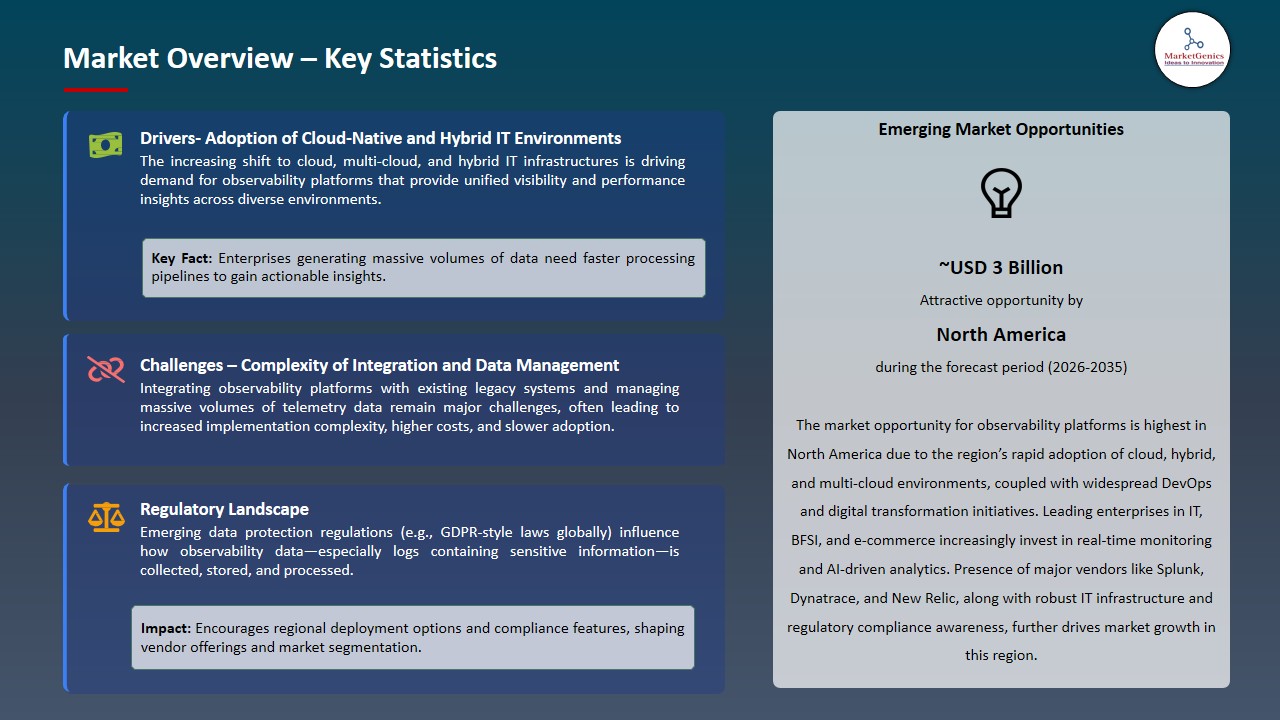
Driver: Expansion of AI‑Enhanced Observability for Predictive Issue Resolution and Automation
-
Businesses are moving towards observability platforms which combine artificial intelligence and machine learning with moving away from reactive monitoring operations to proactive issue resolution, automatic root-cause analysis, and self-repairing operational processes. This strategic change allows IT operations teams to reduce the downtime of systems and redistribute resources towards innovation instead of troubleshooting them manually.
- For instance, in January 2025, Dynatrace unveiled superior AI-based observability which leverages Davis AI to automatically root-cause detect and search across distributed hybrid-cloud environment, delivering scalable accuracy in performance diagnostics, anomaly prediction, and prescriptive advice of remediation. These solutions are real-time, cross-infrastructure, cross-application and user experience layer correlations that alleviate alert fatigue and focus on high-impact incidents. Organizations can leverage the integration of AI into observability processes to find problems before they impact an end user or business process.
- AI-based observability ensures better responsiveness to the operation and increases the reliability of the system in the multifaceted enterprise environments.
Restraint: Integration Challenges with Legacy and Third‑Party Monitoring Tools Impede Unified Observability
-
The integration of contemporary observability platforms with older systems and third-party monitoring tools presents considerable problems for many businesses, despite the platforms' promise of unified insights across infrastructure, apps, and logs. Legacy monitoring silos, proprietary protocols, and inconsistent data formats result in fragmented views, delayed analysis, and redundant tooling costs, undermining the value proposition of a cohesive observability strategy.
- Organizations frequently need to invest in purpose-built adapters, middleware or layers of data transformation as a way to consolidate different sources of telemetry, and it increases the implementation cycles and the overall cost of ownership. In the case of most mid-market size companies already struggling with low engineering bandwidth, such integration complexities make the process of adopting traditional monitoring into fully integrated observability platforms slow.
- The assimilation challenges with the current systems disrupt the speed of rollout and constrain the achievement of an integrated observability.
Opportunity: Convergence of Observability with Security Monitoring Enables Extended Use Cases
-
The increasing focus on ensuring the security of distributed cloud environments is a strategic opportunity to observability vendors to continue offering security observability (performance telemetry with risk and threat indicators). Older security information and event management (SIEM) systems do not typically have performance context, whereas observability platforms can add real-time information on anomalies in system behavior that can suggest an attack, configuration or compliance vulnerabilities.
- For instance, in June 2025, Splunk has broadened its observability with new security observability functions that correlates application telemetry with infrastructure telemetry and threat intelligence and risk scoring, which make cross-domain analysis to increase both operational reliability and security posture. Through providing combined observability-security workflows, vendors are able to attract more customers, differentiate within a competitive environment, and elevate the size of average deals.
- Convergence Security observability creates new enterprise workload cases and enhances the vendor value propositions.
Key Trend: Growth of Open Standards and Interoperability Accelerates Ecosystem Adoption
-
As organizations adopt increasingly heterogeneous cloud and microservices environments, there is a clear trend toward open standards (such as Open Telemetry) and interoperability across observability tools and telemetry pipelines. The trend minimizes the risks of vendor lock-in and makes distributed systems more instrumental to enterprises by ensuring smooth data collection between applications, infrastructure, containers, and services.
- Most observability vendors are providing such open standards in the heart of their offerings, so that customers can collect, normalize and analyses telemetry without proprietary agents. For instance, in March 2026, New Relic has announced the addition of wider support of Open Telemetry schema to all of their observability services, enabling users to centralize traces, metrics, and logs with a wide variety of sources and instrumented with standardized instrumentation, enhancing the quality of data and the compatibility of tools.
- Open standards are widely used and this enables easier integration of the toolchains and switching between vendors is less expensive.
- Interoperability is possible through the use of open standards, which increases the speed of observability deployment and ecosystem innovation.
Observability Platform Market Analysis and Segmental Data
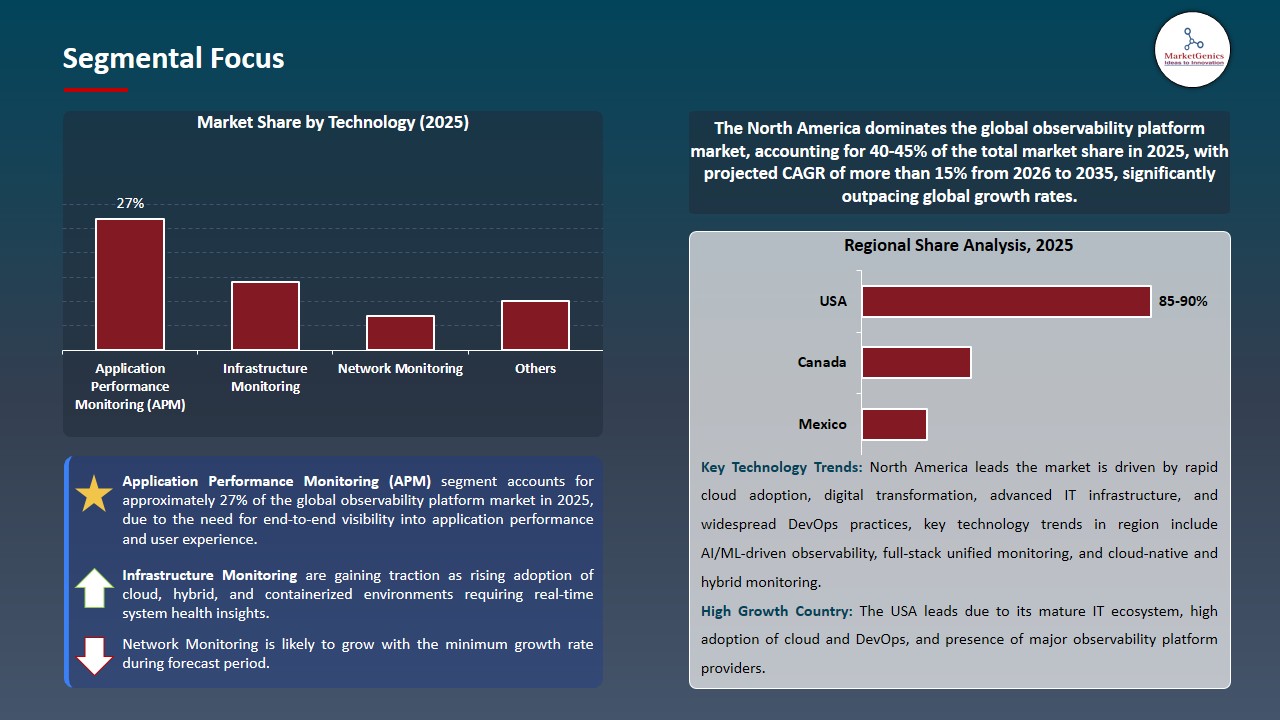
Application Performance Monitoring (APM) Dominate Global Observability Platform Market
-
The application performance monitoring (APM) segment dominates the global observability platform market, as it offers a base visibility of application behavior, user experience, and service dependencies that are essential to the reliability of digital services in cloud-native and hybrid systems. APM tools help enterprises to trace transactions, measure the performance of latency of services, and diagnose performance bottlenecks across distributed systems in real-time.
- The APM is frequently the foundation of modern observability strategies, which still incorporate metrics, logs, and traces to provide a broad understanding of both the health of applications and their business results. For instance, Dynatrace has been acknowledged to be a leader in APM and observability, ranking top in a variety of applications in the Gartner Critical Capabilities of APM and Observability report, demonstrating its high usage and complex capabilities in the process of AI-driven performance monitoring.
- The focal position of APM in observing application performance leads to the wider adoption of observability and provides essential operational insights that enable enterprise digital transformation.
North America Leads Global Observability Platform Market Demand
-
North America leads the observability platform market is fueled by the concentration of dominant technology vendors who constantly innovate with advanced monitoring and analytics tools. For instance, New Relic was selected as a leader in the 2025 IDC MarketScape of Worldwide Observability Software, which demonstrates the high level of observability functionality and adherence to flexible and open standards that fulfill the requirements of the enterprises and promote their adoption among the U.S. and Canadian companies.
- Moreover, Enterprise in North America are quickly switching to the cloud native designs and AI enhanced observability frameworks to handle intricate hybrid landscape and enhance operational efficiency. This need can be seen with key providers like Datadog, Dynatrace, and Splunk based there and widely used in the region still developing more monitoring features using AI and automation, solidifying the position of enterprise dependence on observability to drive performance and reliability.
- These regional drivers increase the leadership of North America in observability adoption, defining the trends worldwide and fastening the platform implementation in large enterprises.
Observability Platform Market Ecosystem
The global observability platform market moderately consolidated, with major players such as Datadog, Splunk, Dynatrace, Amazon Web Services (AWS), and Cisco (via AppDynamics), with these leaders dominating through advanced AI‑driven technologies and comprehensive cloud-native solutions that address end-to-end observability across metrics, logs, and traces. This leadership is supported by the speed of cloud-adoption, multi-cloud complexity, integration of artificial intelligence (AI) and machine learning (ML) to predictive analytics and real-time insights, as well as to generate automated anomaly detection.
The major players are also paying more attention to niche innovations as a way of evolving the market. The AI and Agentic Observability Suite by Datadog is better in monitoring AI workflows; the OpenTelemetry improvements by Splunk make telemetry collection easier; the Observability for Developers feature by Dynatrace is aimed at debugging runtimes; and the AWS CloudWatch was expanded with generative AI observability to modern workloads as special-purpose solutions that increase reliability, visibility, and developer productivity.
Government bodies and institutions also influence market growth by supporting digital transformation programs, which increase cloud adoption and telemetry needs. For instance, initiatives like national smart city projects accelerate IT modernization, indirectly boosting demand for advanced observability tools.
Product diversification and portfolio expansion with AI operations (AIOps), security analytics, and unified observability based on IT solutions are emphasized by market leaders to increase operational efficiency and sustainability. In February 2025 Dynatrace released their Observability for Developers suite, which includes a Live Debugger which can provide real-time runtime visibility without redeploying the system to enhance the speed at which issues are solved and system reliability.
Recent Development and Strategic Overview:
-
In June 2025, Datadog enhanced its observability platform by introducing AI Agent Monitoring, LLM Experiments, and the AI Agents Console. These capabilities deliver comprehensive monitoring and diagnostics for agentic AI, enabling enterprises to gain detailed insights into AI system performance and application telemetry.
- In April 2025, Splunk advanced its Observability Cloud by streamlining OpenTelemetry integration, automating instrumentation, and enhancing Service Inventory, thereby improving system visibility, reducing configuration complexity, and strengthening Kubernetes monitoring and operational efficiency.
Report Scope
|
Detail |
|
|
Market Size in 2025 |
USD 2.8 Bn |
|
Market Forecast Value in 2035 |
USD 9.3 Bn |
|
Growth Rate (CAGR) |
12.7% |
|
Forecast Period |
2026 – 2035 |
|
Historical Data Available for |
2021 – 2024 |
|
Market Size Units |
US$ Billion for Value |
|
Report Format |
Electronic (PDF) + Excel |
|
North America |
Europe |
Asia Pacific |
Middle East |
Africa |
South America |
|
|
|
|
|
|
|
Companies Covered |
|||||
|
|
|
|
|
|
Observability Platform Market Segmentation and Highlights
|
Segment |
Sub-segment |
|
Observability Platform Market, By Component |
|
|
Observability Platform Market, By Deployment Mode |
|
|
Observability Platform Market, By Organization Size |
|
|
Observability Platform Market, By Data Type |
|
|
Observability Platform Market, By Technology |
|
|
Observability Platform Market, By Pricing Model |
|
|
Observability Platform Market, By Integration Type |
|
|
Observability Platform Market, By Analytics Type |
|
|
Observability Platform Market, By End-use Industry |
|
Frequently Asked Questions
Table of Contents
- 1. Research Methodology and Assumptions
- 1.1. Definitions
- 1.2. Research Design and Approach
- 1.3. Data Collection Methods
- 1.4. Base Estimates and Calculations
- 1.5. Forecasting Models
- 1.5.1. Key Forecast Factors & Impact Analysis
- 1.6. Secondary Research
- 1.6.1. Open Sources
- 1.6.2. Paid Databases
- 1.6.3. Associations
- 1.7. Primary Research
- 1.7.1. Primary Sources
- 1.7.2. Primary Interviews with Stakeholders across Ecosystem
- 2. Executive Summary
- 2.1. Global Observability Platform Market Outlook
- 2.1.1. Observability Platform Market Size (Value - US$ Bn), and Forecasts, 2021-2035
- 2.1.2. Compounded Annual Growth Rate Analysis
- 2.1.3. Growth Opportunity Analysis
- 2.1.4. Segmental Share Analysis
- 2.1.5. Geographical Share Analysis
- 2.2. Market Analysis and Facts
- 2.3. Supply-Demand Analysis
- 2.4. Competitive Benchmarking
- 2.5. Go-to- Market Strategy
- 2.5.1. Customer/ End-use Industry Assessment
- 2.5.2. Growth Opportunity Data, 2026-2035
- 2.5.2.1. Regional Data
- 2.5.2.2. Country Data
- 2.5.2.3. Segmental Data
- 2.5.3. Identification of Potential Market Spaces
- 2.5.4. GAP Analysis
- 2.5.5. Potential Attractive Price Points
- 2.5.6. Prevailing Market Risks & Challenges
- 2.5.7. Preferred Sales & Marketing Strategies
- 2.5.8. Key Recommendations and Analysis
- 2.5.9. A Way Forward
- 2.1. Global Observability Platform Market Outlook
- 3. Industry Data and Premium Insights
- 3.1. Global Information Technology & Media Overview, 2025
- 3.1.1. Information Technology & Media Ecosystem Analysis
- 3.1.2. Key Trends for Information Technology & Media Industry
- 3.1.3. Regional Distribution for Information Technology & Media Industry
- 3.2. Supplier Customer Data
- 3.3. Technology Roadmap and Developments
- 3.4. Trade Analysis
- 3.4.1. Import & Export Analysis, 2025
- 3.4.2. Top Importing Countries
- 3.4.3. Top Exporting Countries
- 3.5. Trump Tariff Impact Analysis
- 3.5.1. Manufacturer
- 3.5.1.1. Based on the component & Raw material
- 3.5.2. Supply Chain
- 3.5.3. End Consumer
- 3.5.1. Manufacturer
- 3.6. Raw Material Analysis
- 3.1. Global Information Technology & Media Overview, 2025
- 4. Market Overview
- 4.1. Market Dynamics
- 4.1.1. Drivers
- 4.1.1.1. Rising adoption of cloud and multi‑cloud environments
- 4.1.1.2. Increasing IT complexity with microservices and containers
- 4.1.1.3. Integration with DevOps for real‑time analytics and efficiency
- 4.1.2. Restraints
- 4.1.2.1. High implementation and maintenance costs
- 4.1.2.2. Challenges in integrating with existing infrastructure and managing large telemetry data
- 4.1.1. Drivers
- 4.2. Key Trend Analysis
- 4.3. Regulatory Framework
- 4.3.1. Key Regulations, Norms, and Subsidies, by Key Countries
- 4.3.2. Tariffs and Standards
- 4.3.3. Impact Analysis of Regulations on the Market
- 4.4. Ecosystem Analysis
- 4.5. Porter’s Five Forces Analysis
- 4.6. PESTEL Analysis
- 4.7. Global Observability Platform Market Demand
- 4.7.1. Historical Market Size – in Value (US$ Bn), 2020-2024
- 4.7.2. Current and Future Market Size – in Value (US$ Bn), 2026–2035
- 4.7.2.1. Y-o-Y Growth Trends
- 4.7.2.2. Absolute $ Opportunity Assessment
- 4.1. Market Dynamics
- 5. Competition Landscape
- 5.1. Competition structure
- 5.1.1. Fragmented v/s consolidated
- 5.2. Company Share Analysis, 2025
- 5.2.1. Global Company Market Share
- 5.2.2. By Region
- 5.2.2.1. North America
- 5.2.2.2. Europe
- 5.2.2.3. Asia Pacific
- 5.2.2.4. Middle East
- 5.2.2.5. Africa
- 5.2.2.6. South America
- 5.3. Product Comparison Matrix
- 5.3.1. Specifications
- 5.3.2. Market Positioning
- 5.3.3. Pricing
- 5.1. Competition structure
- 6. Global Observability Platform Market Analysis, by Component
- 6.1. Key Segment Analysis
- 6.2. Observability Platform Market Size (Value - US$ Bn), Analysis, and Forecasts, Component, 2021-2035
- 6.2.1. Platform/Software
- 6.2.2. Services
- 6.2.2.1. Professional Services
- 6.2.2.1.1. Consulting Services
- 6.2.2.1.2. Integration & Implementation Services
- 6.2.2.1.3. Support & Maintenance Services
- 6.2.2.2. Managed Services
- 6.2.2.1. Professional Services
- 7. Global Observability Platform Market Analysis, by Deployment Mode
- 7.1. Key Segment Analysis
- 7.2. Observability Platform Market Size (Value - US$ Bn), Analysis, and Forecasts, by Deployment Mode, 2021-2035
- 7.2.1. Cloud-based
- 7.2.1.1. Public Cloud
- 7.2.1.2. Private Cloud
- 7.2.1.3. Hybrid Cloud
- 7.2.2. On-premises
- 7.2.3. Hybrid
- 7.2.1. Cloud-based
- 8. Global Observability Platform Market Analysis, by Organization Size
- 8.1. Key Segment Analysis
- 8.2. Observability Platform Market Size (Value - US$ Bn), Analysis, and Forecasts, by Organization Size, 2021-2035
- 8.2.1. Large Enterprises
- 8.2.2. Small and Medium Enterprises (SMEs)
- 9. Global Observability Platform Market Analysis, by Data Type
- 9.1. Key Segment Analysis
- 9.2. Observability Platform Market Size (Value - US$ Bn), Analysis, and Forecasts, by Data Type, 2021-2035
- 9.2.1. Metrics
- 9.2.2. Logs
- 9.2.3. Traces
- 9.2.4. Events
- 9.2.5. User Experience Data
- 10. Global Observability Platform Market Analysis, by Technology
- 10.1. Key Segment Analysis
- 10.2. Observability Platform Market Size (Value - US$ Bn), Analysis, and Forecasts, by Technology, 2021-2035
- 10.2.1. Application Performance Monitoring (APM)
- 10.2.2. Infrastructure Monitoring
- 10.2.3. Network Monitoring
- 10.2.4. Cloud Monitoring
- 10.2.5. Container Monitoring
- 10.2.6. Kubernetes Monitoring
- 10.2.7. Serverless Monitoring
- 10.2.8. Database Monitoring
- 10.2.9. Real User Monitoring (RUM)
- 10.2.10. Synthetic Monitoring
- 10.2.11. Others
- 11. Global Observability Platform Market Analysis, by Pricing Model
- 11.1. Key Segment Analysis
- 11.2. Observability Platform Market Size (Value - US$ Bn), Analysis, and Forecasts, by Pricing Model, 2021-2035
- 11.2.1. Subscription-based
- 11.2.2. Pay-as-you-go
- 11.2.3. Perpetual License
- 11.2.4. Freemium
- 12. Global Observability Platform Market Analysis, by Integration Type
- 12.1. Key Segment Analysis
- 12.2. Observability Platform Market Size (Value - US$ Bn), Analysis, and Forecasts, by Integration Type, 2021-2035
- 12.2.1. Native Integration
- 12.2.2. API-based Integration
- 12.2.3. Agent-based Integration
- 12.2.4. Agentless Integration
- 13. Global Observability Platform Market Analysis, by Analytics Type
- 13.1. Key Segment Analysis
- 13.2. Observability Platform Market Size (Value - US$ Bn), Analysis, and Forecasts, by Analytics Type, 2021-2035
- 13.2.1. Descriptive Analytics
- 13.2.2. Diagnostic Analytics
- 13.2.3. Predictive Analytics
- 13.2.4. Prescriptive Analytics
- 14. Global Observability Platform Market Analysis, by End-use Industry
- 14.1. Key Segment Analysis
- 14.2. Observability Platform Market Size (Value - US$ Bn), Analysis, and Forecasts, by End-use Industry, 2021-2035
- 14.2.1. Banking, Financial Services, and Insurance (BFSI)
- 14.2.2. IT & Telecommunications
- 14.2.3. Retail & E-commerce
- 14.2.4. Healthcare & Life Sciences
- 14.2.5. Manufacturing
- 14.2.6. Media & Entertainment
- 14.2.7. Government & Public Sector
- 14.2.8. Education
- 14.2.9. Energy & Utilities
- 14.2.10. Travel & Hospitality
- 14.2.11. Transportation & Logistics
- 14.2.12. Others
- 15. Global Observability Platform Market Analysis, by Region
- 15.1. Key Findings
- 15.2. Observability Platform Market Size (Value - US$ Bn), Analysis, and Forecasts, by Region, 2021-2035
- 15.2.1. North America
- 15.2.2. Europe
- 15.2.3. Asia Pacific
- 15.2.4. Middle East
- 15.2.5. Africa
- 15.2.6. South America
- 16. North America Observability Platform Market Analysis
- 16.1. Key Segment Analysis
- 16.2. Regional Snapshot
- 16.3. North America Observability Platform Market Size (Value - US$ Bn), Analysis, and Forecasts, 2021-2035
- 16.3.1. Component
- 16.3.2. Deployment Mode
- 16.3.3. Organization Size
- 16.3.4. Data Type
- 16.3.5. Technology
- 16.3.6. Pricing Model
- 16.3.7. Integration Type
- 16.3.8. Analytics Type
- 16.3.9. End-use Industry
- 16.3.10. Country
- 16.3.10.1. USA
- 16.3.10.2. Canada
- 16.3.10.3. Mexico
- 16.4. USA Observability Platform Market
- 16.4.1. Country Segmental Analysis
- 16.4.2. Component
- 16.4.3. Deployment Mode
- 16.4.4. Organization Size
- 16.4.5. Data Type
- 16.4.6. Technology
- 16.4.7. Pricing Model
- 16.4.8. Integration Type
- 16.4.9. Analytics Type
- 16.4.10. End-use Industry
- 16.5. Canada Observability Platform Market
- 16.5.1. Country Segmental Analysis
- 16.5.2. Component
- 16.5.3. Deployment Mode
- 16.5.4. Organization Size
- 16.5.5. Data Type
- 16.5.6. Technology
- 16.5.7. Pricing Model
- 16.5.8. Integration Type
- 16.5.9. Analytics Type
- 16.5.10. End-use Industry
- 16.6. Mexico Observability Platform Market
- 16.6.1. Country Segmental Analysis
- 16.6.2. Component
- 16.6.3. Deployment Mode
- 16.6.4. Organization Size
- 16.6.5. Data Type
- 16.6.6. Technology
- 16.6.7. Pricing Model
- 16.6.8. Integration Type
- 16.6.9. Analytics Type
- 16.6.10. End-use Industry
- 17. Europe Observability Platform Market Analysis
- 17.1. Key Segment Analysis
- 17.2. Regional Snapshot
- 17.3. Europe Observability Platform Market Size (Value - US$ Bn), Analysis, and Forecasts, 2021-2035
- 17.3.1. Component
- 17.3.2. Deployment Mode
- 17.3.3. Organization Size
- 17.3.4. Data Type
- 17.3.5. Technology
- 17.3.6. Pricing Model
- 17.3.7. Integration Type
- 17.3.8. Analytics Type
- 17.3.9. End-use Industry
- 17.3.10. Country
- 17.3.10.1. Germany
- 17.3.10.2. United Kingdom
- 17.3.10.3. France
- 17.3.10.4. Italy
- 17.3.10.5. Spain
- 17.3.10.6. Netherlands
- 17.3.10.7. Nordic Countries
- 17.3.10.8. Poland
- 17.3.10.9. Russia & CIS
- 17.3.10.10. Rest of Europe
- 17.4. Germany Observability Platform Market
- 17.4.1. Country Segmental Analysis
- 17.4.2. Component
- 17.4.3. Deployment Mode
- 17.4.4. Organization Size
- 17.4.5. Data Type
- 17.4.6. Technology
- 17.4.7. Pricing Model
- 17.4.8. Integration Type
- 17.4.9. Analytics Type
- 17.4.10. End-use Industry
- 17.5. United Kingdom Observability Platform Market
- 17.5.1. Country Segmental Analysis
- 17.5.2. Component
- 17.5.3. Deployment Mode
- 17.5.4. Organization Size
- 17.5.5. Data Type
- 17.5.6. Technology
- 17.5.7. Pricing Model
- 17.5.8. Integration Type
- 17.5.9. Analytics Type
- 17.5.10. End-use Industry
- 17.6. France Observability Platform Market
- 17.6.1. Country Segmental Analysis
- 17.6.2. Component
- 17.6.3. Deployment Mode
- 17.6.4. Organization Size
- 17.6.5. Data Type
- 17.6.6. Technology
- 17.6.7. Pricing Model
- 17.6.8. Integration Type
- 17.6.9. Analytics Type
- 17.6.10. End-use Industry
- 17.7. Italy Observability Platform Market
- 17.7.1. Country Segmental Analysis
- 17.7.2. Component
- 17.7.3. Deployment Mode
- 17.7.4. Organization Size
- 17.7.5. Data Type
- 17.7.6. Technology
- 17.7.7. Pricing Model
- 17.7.8. Integration Type
- 17.7.9. Analytics Type
- 17.7.10. End-use Industry
- 17.8. Spain Observability Platform Market
- 17.8.1. Country Segmental Analysis
- 17.8.2. Component
- 17.8.3. Deployment Mode
- 17.8.4. Organization Size
- 17.8.5. Data Type
- 17.8.6. Technology
- 17.8.7. Pricing Model
- 17.8.8. Integration Type
- 17.8.9. Analytics Type
- 17.8.10. End-use Industry
- 17.9. Netherlands Observability Platform Market
- 17.9.1. Country Segmental Analysis
- 17.9.2. Component
- 17.9.3. Deployment Mode
- 17.9.4. Organization Size
- 17.9.5. Data Type
- 17.9.6. Technology
- 17.9.7. Pricing Model
- 17.9.8. Integration Type
- 17.9.9. Analytics Type
- 17.9.10. End-use Industry
- 17.10. Nordic Countries Observability Platform Market
- 17.10.1. Country Segmental Analysis
- 17.10.2. Component
- 17.10.3. Deployment Mode
- 17.10.4. Organization Size
- 17.10.5. Data Type
- 17.10.6. Technology
- 17.10.7. Pricing Model
- 17.10.8. Integration Type
- 17.10.9. Analytics Type
- 17.10.10. End-use Industry
- 17.11. Poland Observability Platform Market
- 17.11.1. Country Segmental Analysis
- 17.11.2. Component
- 17.11.3. Deployment Mode
- 17.11.4. Organization Size
- 17.11.5. Data Type
- 17.11.6. Technology
- 17.11.7. Pricing Model
- 17.11.8. Integration Type
- 17.11.9. Analytics Type
- 17.11.10. End-use Industry
- 17.12. Russia & CIS Observability Platform Market
- 17.12.1. Country Segmental Analysis
- 17.12.2. Component
- 17.12.3. Deployment Mode
- 17.12.4. Organization Size
- 17.12.5. Data Type
- 17.12.6. Technology
- 17.12.7. Pricing Model
- 17.12.8. Integration Type
- 17.12.9. Analytics Type
- 17.12.10. End-use Industry
- 17.13. Rest of Europe Observability Platform Market
- 17.13.1. Country Segmental Analysis
- 17.13.2. Component
- 17.13.3. Deployment Mode
- 17.13.4. Organization Size
- 17.13.5. Data Type
- 17.13.6. Technology
- 17.13.7. Pricing Model
- 17.13.8. Integration Type
- 17.13.9. Analytics Type
- 17.13.10. End-use Industry
- 18. Asia Pacific Observability Platform Market Analysis
- 18.1. Key Segment Analysis
- 18.2. Regional Snapshot
- 18.3. Asia Pacific Observability Platform Market Size (Value - US$ Bn), Analysis, and Forecasts, 2021-2035
- 18.3.1. Component
- 18.3.2. Deployment Mode
- 18.3.3. Organization Size
- 18.3.4. Data Type
- 18.3.5. Technology
- 18.3.6. Pricing Model
- 18.3.7. Integration Type
- 18.3.8. Analytics Type
- 18.3.9. End-use Industry
- 18.3.10. Country
- 18.3.10.1. China
- 18.3.10.2. India
- 18.3.10.3. Japan
- 18.3.10.4. South Korea
- 18.3.10.5. Australia and New Zealand
- 18.3.10.6. Indonesia
- 18.3.10.7. Malaysia
- 18.3.10.8. Thailand
- 18.3.10.9. Vietnam
- 18.3.10.10. Rest of Asia Pacific
- 18.4. China Observability Platform Market
- 18.4.1. Country Segmental Analysis
- 18.4.2. Component
- 18.4.3. Deployment Mode
- 18.4.4. Organization Size
- 18.4.5. Data Type
- 18.4.6. Technology
- 18.4.7. Pricing Model
- 18.4.8. Integration Type
- 18.4.9. Analytics Type
- 18.4.10. End-use Industry
- 18.5. India Observability Platform Market
- 18.5.1. Country Segmental Analysis
- 18.5.2. Component
- 18.5.3. Deployment Mode
- 18.5.4. Organization Size
- 18.5.5. Data Type
- 18.5.6. Technology
- 18.5.7. Pricing Model
- 18.5.8. Integration Type
- 18.5.9. Analytics Type
- 18.5.10. End-use Industry
- 18.6. Japan Observability Platform Market
- 18.6.1. Country Segmental Analysis
- 18.6.2. Component
- 18.6.3. Deployment Mode
- 18.6.4. Organization Size
- 18.6.5. Data Type
- 18.6.6. Technology
- 18.6.7. Pricing Model
- 18.6.8. Integration Type
- 18.6.9. Analytics Type
- 18.6.10. End-use Industry
- 18.7. South Korea Observability Platform Market
- 18.7.1. Country Segmental Analysis
- 18.7.2. Component
- 18.7.3. Deployment Mode
- 18.7.4. Organization Size
- 18.7.5. Data Type
- 18.7.6. Technology
- 18.7.7. Pricing Model
- 18.7.8. Integration Type
- 18.7.9. Analytics Type
- 18.7.10. End-use Industry
- 18.8. Australia and New Zealand Observability Platform Market
- 18.8.1. Country Segmental Analysis
- 18.8.2. Component
- 18.8.3. Deployment Mode
- 18.8.4. Organization Size
- 18.8.5. Data Type
- 18.8.6. Technology
- 18.8.7. Pricing Model
- 18.8.8. Integration Type
- 18.8.9. Analytics Type
- 18.8.10. End-use Industry
- 18.9. Indonesia Observability Platform Market
- 18.9.1. Country Segmental Analysis
- 18.9.2. Component
- 18.9.3. Deployment Mode
- 18.9.4. Organization Size
- 18.9.5. Data Type
- 18.9.6. Technology
- 18.9.7. Pricing Model
- 18.9.8. Integration Type
- 18.9.9. Analytics Type
- 18.9.10. End-use Industry
- 18.10. Malaysia Observability Platform Market
- 18.10.1. Country Segmental Analysis
- 18.10.2. Component
- 18.10.3. Deployment Mode
- 18.10.4. Organization Size
- 18.10.5. Data Type
- 18.10.6. Technology
- 18.10.7. Pricing Model
- 18.10.8. Integration Type
- 18.10.9. Analytics Type
- 18.10.10. End-use Industry
- 18.11. Thailand Observability Platform Market
- 18.11.1. Country Segmental Analysis
- 18.11.2. Component
- 18.11.3. Deployment Mode
- 18.11.4. Organization Size
- 18.11.5. Data Type
- 18.11.6. Technology
- 18.11.7. Pricing Model
- 18.11.8. Integration Type
- 18.11.9. Analytics Type
- 18.11.10. End-use Industry
- 18.12. Vietnam Observability Platform Market
- 18.12.1. Country Segmental Analysis
- 18.12.2. Component
- 18.12.3. Deployment Mode
- 18.12.4. Organization Size
- 18.12.5. Data Type
- 18.12.6. Technology
- 18.12.7. Pricing Model
- 18.12.8. Integration Type
- 18.12.9. Analytics Type
- 18.12.10. End-use Industry
- 18.13. Rest of Asia Pacific Observability Platform Market
- 18.13.1. Country Segmental Analysis
- 18.13.2. Component
- 18.13.3. Deployment Mode
- 18.13.4. Organization Size
- 18.13.5. Data Type
- 18.13.6. Technology
- 18.13.7. Pricing Model
- 18.13.8. Integration Type
- 18.13.9. Analytics Type
- 18.13.10. End-use Industry
- 19. Middle East Observability Platform Market Analysis
- 19.1. Key Segment Analysis
- 19.2. Regional Snapshot
- 19.3. Middle East Observability Platform Market Size (Value - US$ Bn), Analysis, and Forecasts, 2021-2035
- 19.3.1. Component
- 19.3.2. Deployment Mode
- 19.3.3. Organization Size
- 19.3.4. Data Type
- 19.3.5. Technology
- 19.3.6. Pricing Model
- 19.3.7. Integration Type
- 19.3.8. Analytics Type
- 19.3.9. End-use Industry
- 19.3.10. Country
- 19.3.10.1. Turkey
- 19.3.10.2. UAE
- 19.3.10.3. Saudi Arabia
- 19.3.10.4. Israel
- 19.3.10.5. Rest of Middle East
- 19.4. Turkey Observability Platform Market
- 19.4.1. Country Segmental Analysis
- 19.4.2. Component
- 19.4.3. Deployment Mode
- 19.4.4. Organization Size
- 19.4.5. Data Type
- 19.4.6. Technology
- 19.4.7. Pricing Model
- 19.4.8. Integration Type
- 19.4.9. Analytics Type
- 19.4.10. End-use Industry
- 19.5. UAE Observability Platform Market
- 19.5.1. Country Segmental Analysis
- 19.5.2. Component
- 19.5.3. Deployment Mode
- 19.5.4. Organization Size
- 19.5.5. Data Type
- 19.5.6. Technology
- 19.5.7. Pricing Model
- 19.5.8. Integration Type
- 19.5.9. Analytics Type
- 19.5.10. End-use Industry
- 19.6. Saudi Arabia Observability Platform Market
- 19.6.1. Country Segmental Analysis
- 19.6.2. Component
- 19.6.3. Deployment Mode
- 19.6.4. Organization Size
- 19.6.5. Data Type
- 19.6.6. Technology
- 19.6.7. Pricing Model
- 19.6.8. Integration Type
- 19.6.9. Analytics Type
- 19.6.10. End-use Industry
- 19.7. Israel Observability Platform Market
- 19.7.1. Country Segmental Analysis
- 19.7.2. Component
- 19.7.3. Deployment Mode
- 19.7.4. Organization Size
- 19.7.5. Data Type
- 19.7.6. Technology
- 19.7.7. Pricing Model
- 19.7.8. Integration Type
- 19.7.9. Analytics Type
- 19.7.10. End-use Industry
- 19.8. Rest of Middle East Observability Platform Market
- 19.8.1. Country Segmental Analysis
- 19.8.2. Component
- 19.8.3. Deployment Mode
- 19.8.4. Organization Size
- 19.8.5. Data Type
- 19.8.6. Technology
- 19.8.7. Pricing Model
- 19.8.8. Integration Type
- 19.8.9. Analytics Type
- 19.8.10. End-use Industry
- 20. Africa Observability Platform Market Analysis
- 20.1. Key Segment Analysis
- 20.2. Regional Snapshot
- 20.3. Africa Observability Platform Market Size (Value - US$ Bn), Analysis, and Forecasts, 2021-2035
- 20.3.1. Component
- 20.3.2. Deployment Mode
- 20.3.3. Organization Size
- 20.3.4. Data Type
- 20.3.5. Technology
- 20.3.6. Pricing Model
- 20.3.7. Integration Type
- 20.3.8. Analytics Type
- 20.3.9. End-use Industry
- 20.3.10. Country
- 20.3.10.1. South Africa
- 20.3.10.2. Egypt
- 20.3.10.3. Nigeria
- 20.3.10.4. Algeria
- 20.3.10.5. Rest of Africa
- 20.4. South Africa Observability Platform Market
- 20.4.1. Country Segmental Analysis
- 20.4.2. Component
- 20.4.3. Deployment Mode
- 20.4.4. Organization Size
- 20.4.5. Data Type
- 20.4.6. Technology
- 20.4.7. Pricing Model
- 20.4.8. Integration Type
- 20.4.9. Analytics Type
- 20.4.10. End-use Industry
- 20.5. Egypt Observability Platform Market
- 20.5.1. Country Segmental Analysis
- 20.5.2. Component
- 20.5.3. Deployment Mode
- 20.5.4. Organization Size
- 20.5.5. Data Type
- 20.5.6. Technology
- 20.5.7. Pricing Model
- 20.5.8. Integration Type
- 20.5.9. Analytics Type
- 20.5.10. End-use Industry
- 20.6. Nigeria Observability Platform Market
- 20.6.1. Country Segmental Analysis
- 20.6.2. Component
- 20.6.3. Deployment Mode
- 20.6.4. Organization Size
- 20.6.5. Data Type
- 20.6.6. Technology
- 20.6.7. Pricing Model
- 20.6.8. Integration Type
- 20.6.9. Analytics Type
- 20.6.10. End-use Industry
- 20.7. Algeria Observability Platform Market
- 20.7.1. Country Segmental Analysis
- 20.7.2. Component
- 20.7.3. Deployment Mode
- 20.7.4. Organization Size
- 20.7.5. Data Type
- 20.7.6. Technology
- 20.7.7. Pricing Model
- 20.7.8. Integration Type
- 20.7.9. Analytics Type
- 20.7.10. End-use Industry
- 20.8. Rest of Africa Observability Platform Market
- 20.8.1. Country Segmental Analysis
- 20.8.2. Component
- 20.8.3. Deployment Mode
- 20.8.4. Organization Size
- 20.8.5. Data Type
- 20.8.6. Technology
- 20.8.7. Pricing Model
- 20.8.8. Integration Type
- 20.8.9. Analytics Type
- 20.8.10. End-use Industry
- 21. South America Observability Platform Market Analysis
- 21.1. Key Segment Analysis
- 21.2. Regional Snapshot
- 21.3. South America Observability Platform Market Size (Value - US$ Bn), Analysis, and Forecasts, 2021-2035
- 21.3.1. Component
- 21.3.2. Deployment Mode
- 21.3.3. Organization Size
- 21.3.4. Data Type
- 21.3.5. Technology
- 21.3.6. Pricing Model
- 21.3.7. Integration Type
- 21.3.8. Analytics Type
- 21.3.9. End-use Industry
- 21.3.10. Country
- 21.3.10.1. Brazil
- 21.3.10.2. Argentina
- 21.3.10.3. Rest of South America
- 21.4. Brazil Observability Platform Market
- 21.4.1. Country Segmental Analysis
- 21.4.2. Component
- 21.4.3. Deployment Mode
- 21.4.4. Organization Size
- 21.4.5. Data Type
- 21.4.6. Technology
- 21.4.7. Pricing Model
- 21.4.8. Integration Type
- 21.4.9. Analytics Type
- 21.4.10. End-use Industry
- 21.5. Argentina Observability Platform Market
- 21.5.1. Country Segmental Analysis
- 21.5.2. Component
- 21.5.3. Deployment Mode
- 21.5.4. Organization Size
- 21.5.5. Data Type
- 21.5.6. Technology
- 21.5.7. Pricing Model
- 21.5.8. Integration Type
- 21.5.9. Analytics Type
- 21.5.10. End-use Industry
- 21.6. Rest of South America Observability Platform Market
- 21.6.1. Country Segmental Analysis
- 21.6.2. Component
- 21.6.3. Deployment Mode
- 21.6.4. Organization Size
- 21.6.5. Data Type
- 21.6.6. Technology
- 21.6.7. Pricing Model
- 21.6.8. Integration Type
- 21.6.9. Analytics Type
- 21.6.10. End-use Industry
- 22. Key Players/ Company Profile
- 22.1. Amazon Web Services (AWS)
- 22.1.1. Company Details/ Overview
- 22.1.2. Company Financials
- 22.1.3. Key Customers and Competitors
- 22.1.4. Business/ Industry Portfolio
- 22.1.5. Product Portfolio/ Specification Details
- 22.1.6. Pricing Data
- 22.1.7. Strategic Overview
- 22.1.8. Recent Developments
- 22.2. BMC Software
- 22.3. Chronosphere
- 22.4. Cisco (AppDynamics)
- 22.5. Cribl
- 22.6. Datadog
- 22.7. Dynatrace
- 22.8. Google Cloud
- 22.9. Grafana Labs
- 22.10. Honeycomb
- 22.11. IBM
- 22.12. Lightstep
- 22.13. LogicMonitor
- 22.14. ManageEngine
- 22.15. Mezmo (formerly LogDNA)
- 22.16. Microsoft
- 22.17. Observe Inc.
- 22.18. Oracle
- 22.19. ServiceNow
- 22.20. SolarWinds
- 22.21. Splunk
- 22.22. Sumo Logic
- 22.23. Other Key Players
- 22.1. Amazon Web Services (AWS)
Note* - This is just tentative list of players. While providing the report, we will cover more number of players based on their revenue and share for each geography
Research Design
Our research design integrates both demand-side and supply-side analysis through a balanced combination of primary and secondary research methodologies. By utilizing both bottom-up and top-down approaches alongside rigorous data triangulation methods, we deliver robust market intelligence that supports strategic decision-making.
MarketGenics' comprehensive research design framework ensures the delivery of accurate, reliable, and actionable market intelligence. Through the integration of multiple research approaches, rigorous validation processes, and expert analysis, we provide our clients with the insights needed to make informed strategic decisions and capitalize on market opportunities.

MarketGenics leverages a dedicated industry panel of experts and a comprehensive suite of paid databases to effectively collect, consolidate, and analyze market intelligence.
Our approach has consistently proven to be reliable and effective in generating accurate market insights, identifying key industry trends, and uncovering emerging business opportunities.
Through both primary and secondary research, we capture and analyze critical company-level data such as manufacturing footprints, including technical centers, R&D facilities, sales offices, and headquarters.
Our expert panel further enhances our ability to estimate market size for specific brands based on validated field-level intelligence.
Our data mining techniques incorporate both parametric and non-parametric methods, allowing for structured data collection, sorting, processing, and cleaning.
Demand projections are derived from large-scale data sets analyzed through proprietary algorithms, culminating in robust and reliable market sizing.
Research Approach
The bottom-up approach builds market estimates by starting with the smallest addressable market units and systematically aggregating them to create comprehensive market size projections.
This method begins with specific, granular data points and builds upward to create the complete market landscape.
Customer Analysis → Segmental Analysis → Geographical Analysis
The top-down approach starts with the broadest possible market data and systematically narrows it down through a series of filters and assumptions to arrive at specific market segments or opportunities.
This method begins with the big picture and works downward to increasingly specific market slices.
TAM → SAM → SOM


Research Methods
Desk / Secondary Research
While analysing the market, we extensively study secondary sources, directories, and databases to identify and collect information useful for this technical, market-oriented, and commercial report. Secondary sources that we utilize are not only the public sources, but it is a combination of Open Source, Associations, Paid Databases, MG Repository & Knowledgebase, and others.
- Company websites, annual reports, financial reports, broker reports, and investor presentations
- National government documents, statistical databases and reports
- News articles, press releases and web-casts specific to the companies operating in the market, Magazines, reports, and others
- We gather information from commercial data sources for deriving company specific data such as segmental revenue, share for geography, product revenue, and others
- Internal and external proprietary databases (industry-specific), relevant patent, and regulatory databases
- Governing Bodies, Government Organizations
- Relevant Authorities, Country-specific Associations for Industries
We also employ the model mapping approach to estimate the product level market data through the players' product portfolio
Primary Research
Primary research/ interviews is vital in analyzing the market. Most of the cases involves paid primary interviews. Primary sources include primary interviews through e-mail interactions, telephonic interviews, surveys as well as face-to-face interviews with the different stakeholders across the value chain including several industry experts.
| Type of Respondents | Number of Primaries |
|---|---|
| Tier 2/3 Suppliers | ~20 |
| Tier 1 Suppliers | ~25 |
| End-users | ~25 |
| Industry Expert/ Panel/ Consultant | ~30 |
| Total | ~100 |
MG Knowledgebase
• Repository of industry blog, newsletter and case studies
• Online platform covering detailed market reports, and company profiles
Forecasting Factors and Models
Forecasting Factors
- Historical Trends – Past market patterns, cycles, and major events that shaped how markets behave over time. Understanding past trends helps predict future behavior.
- Industry Factors – Specific characteristics of the industry like structure, regulations, and innovation cycles that affect market dynamics.
- Macroeconomic Factors – Economic conditions like GDP growth, inflation, and employment rates that affect how much money people have to spend.
- Demographic Factors – Population characteristics like age, income, and location that determine who can buy your product.
- Technology Factors – How quickly people adopt new technology and how much technology infrastructure exists.
- Regulatory Factors – Government rules, laws, and policies that can help or restrict market growth.
- Competitive Factors – Analyzing competition structure such as degree of competition and bargaining power of buyers and suppliers.
Forecasting Models / Techniques
Multiple Regression Analysis
- Identify and quantify factors that drive market changes
- Statistical modeling to establish relationships between market drivers and outcomes
Time Series Analysis – Seasonal Patterns
- Understand regular cyclical patterns in market demand
- Advanced statistical techniques to separate trend, seasonal, and irregular components
Time Series Analysis – Trend Analysis
- Identify underlying market growth patterns and momentum
- Statistical analysis of historical data to project future trends
Expert Opinion – Expert Interviews
- Gather deep industry insights and contextual understanding
- In-depth interviews with key industry stakeholders
Multi-Scenario Development
- Prepare for uncertainty by modeling different possible futures
- Creating optimistic, pessimistic, and most likely scenarios
Time Series Analysis – Moving Averages
- Sophisticated forecasting for complex time series data
- Auto-regressive integrated moving average models with seasonal components
Econometric Models
- Apply economic theory to market forecasting
- Sophisticated economic models that account for market interactions
Expert Opinion – Delphi Method
- Harness collective wisdom of industry experts
- Structured, multi-round expert consultation process
Monte Carlo Simulation
- Quantify uncertainty and probability distributions
- Thousands of simulations with varying input parameters
Research Analysis
Our research framework is built upon the fundamental principle of validating market intelligence from both demand and supply perspectives. This dual-sided approach ensures comprehensive market understanding and reduces the risk of single-source bias.
Demand-Side Analysis: We understand end-user/application behavior, preferences, and market needs along with the penetration of the product for specific application.
Supply-Side Analysis: We estimate overall market revenue, analyze the segmental share along with industry capacity, competitive landscape, and market structure.
Validation & Evaluation
Data triangulation is a validation technique that uses multiple methods, sources, or perspectives to examine the same research question, thereby increasing the credibility and reliability of research findings. In market research, triangulation serves as a quality assurance mechanism that helps identify and minimize bias, validate assumptions, and ensure accuracy in market estimates.
- Data Source Triangulation – Using multiple data sources to examine the same phenomenon
- Methodological Triangulation – Using multiple research methods to study the same research question
- Investigator Triangulation – Using multiple researchers or analysts to examine the same data
- Theoretical Triangulation – Using multiple theoretical perspectives to interpret the same data

Custom Market Research Services
We will customise the research for you, in case the report listed above does not meet your requirements.
Get 10% Free Customisation