Parcel Delivery Vehicle Market Size, Share & Trends Analysis Report by Vehicle Type (Electric Delivery Vehicles, Internal Combustion Engine Vehicles, Autonomous Delivery Vehicles), Rated Power (kW/HP), Rated Capacity (Payload), Battery Capacity (for Electric Vehicles), Vehicle Size/Class, Technology Integration, Ownership Model, End-use Industry, Service Type, and Geography (North America, Europe, Asia Pacific, Middle East, Africa, and South America) – Global Industry Data, Trends, and Forecasts, 2026–2035
|
|
|
Segmental Data Insights |
|
|
Demand Trends |
|
|
Competitive Landscape |
|
|
Strategic Development |
|
|
Future Outlook & Opportunities |
|
Parcel Delivery Vehicle Market Size, Share, and Growth
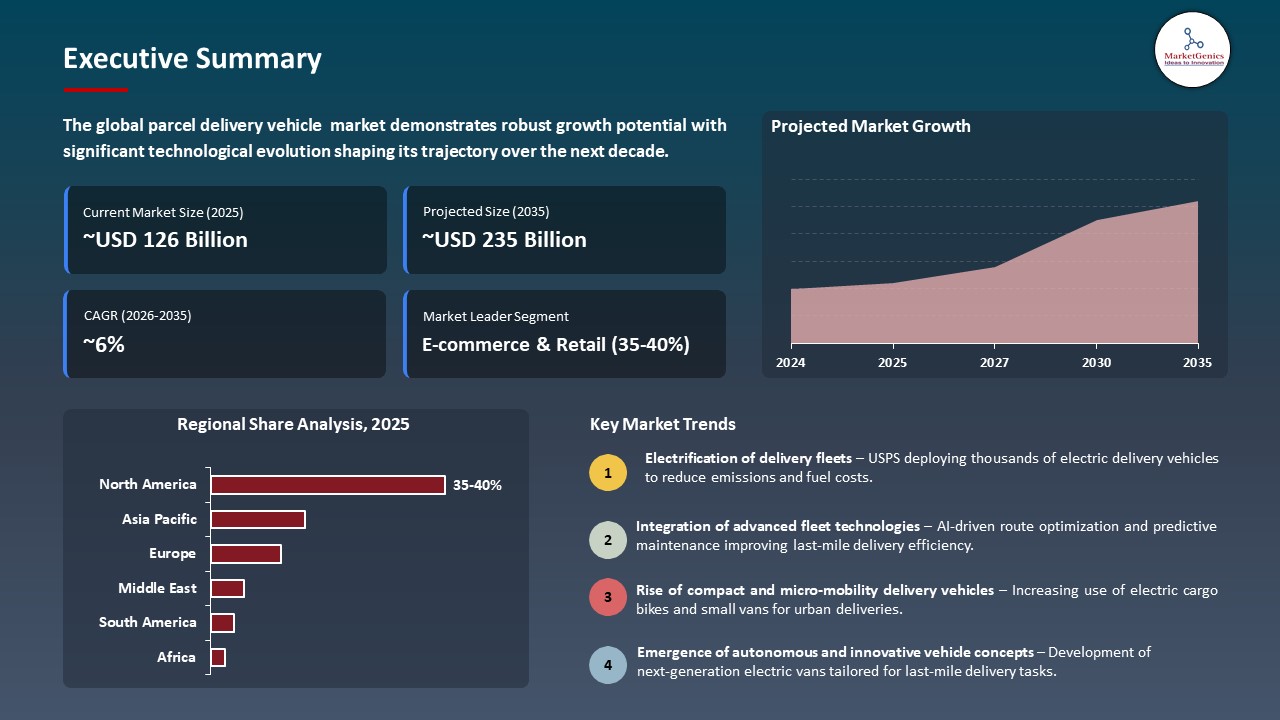
The global parcel delivery vehicle market is experiencing robust growth, with its estimated value of USD 126.4 billion in the year 2025 and USD 235.1 billion by the period 2035, registering a CAGR of 6.4%, during the forecast period. The global parcel delivery vehicle market, driven by rapid growth in e-commerce and last-mile logistics, rising urbanization requiring efficient city delivery fleets, stricter emission regulations accelerating adoption of electric vans, and increasing fleet digitalization with telematics to improve route efficiency, operating costs, and delivery speed.
Claudia Vogt, Director of Ford Pro for Germany, Austria, and Switzerland, says: "We are proud to support Deutsche Post and DHL in electrifying their fleet with Europe's most successful electric vans. This further expands our strategic partnership, which goes beyond just vehicle delivery. By providing not only our E-Transit models but also our Ford Pro ecosystem of smart software and service offerings, we increase the uptime and productivity of the DHL fleet."
The accelerating focus on sustainability and decarbonization targets is driving increased adoption of electric parcel delivery vehicles, as logistics operators transition fleets toward low-emission solutions to comply with environmental regulations and reduce total operating costs. For instance, in 2025, Ford Pro supplied 2,400 electric E-Transit and E-Transit Custom vans to Deutsche Post DHL in Germany, supporting the expansion of low-emission last-mile delivery operations and reinforcing large-scale fleet electrification initiatives. This development accelerates large-scale electrification of parcel delivery fleets and strengthens demand for electric commercial vehicles globally.
Additionally, the expansion of commercial fleet availability and broader market access is driving increased adoption of parcel delivery vehicles by enabling logistics operators of all sizes to scale operations efficiently. For instance, in February 2025, Rivian expanded market access by opening U.S. sales of its all-electric commercial van to fleets of all sizes, broadening commercial adoption beyond exclusive partnerships. This move widens market participation and accelerates demand growth for electric parcel delivery vehicles across diverse fleet operators.
Key adjacent opportunities in the global parcel delivery vehicle market include growth in last-mile logistics services, electric commercial van charging infrastructure, fleet telematics and route optimization solutions, autonomous delivery vehicle development, and lightweight vehicle components for efficiency improvements. These opportunities enable market players to diversify offerings and capture value across the evolving delivery ecosystem.
Parcel Delivery Vehicle Market Dynamics and Trends
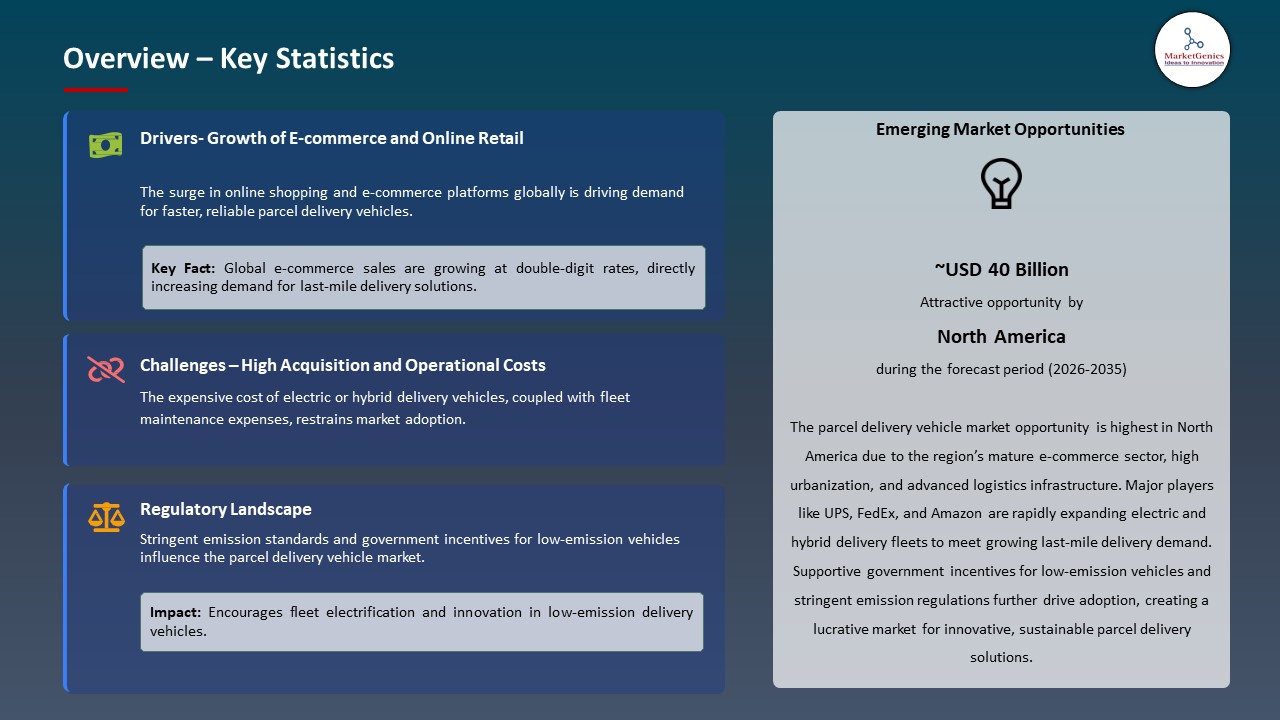
Driver: Rising E‑commerce Growth Necessitates Efficient Last‑Mile Solutions
-
The parcel delivery vehicle market, driven by the continuous and rapid expansion of global e‑commerce, compelling parcel delivery operators and logistics companies to invest in specialized vehicle fleets that not only expand delivery capacity but also improve operational efficiency, reduce transit times, and support same‑day or next‑day delivery services in densely populated urban areas.
- This trend is particularly pronounced in Europe, where the combination of high parcel volumes and strict environmental regulations is driving fleets toward low‑emission solutions. Operators are seeking vehicles that balance cargo capacity, range, and energy efficiency to meet both customer expectations and regulatory compliance.
- In June 2025, Mercedes‑Benz Vans supplied nearly 5,000 electric eSprinter and eVito vehicles to Amazon’s delivery partners across five European countries, enabling more efficient urban parcel distribution while significantly reducing carbon emissions. This deployment highlights how OEMs are leveraging technology and scale to meet rising e‑commerce demands, while enhancing fleet productivity and sustainability.
- This driver accelerates demand for high‑performance, emission‑free delivery vehicles to meet evolving consumer expectations.
Restraint: High Upfront Costs of Electrified Parcel Delivery Fleets
-
The parcel delivery vehicle market faces a significant restraint due to the high upfront costs associated with acquiring advanced electric delivery vehicles. These costs, combined with the need for specialized charging infrastructure, can be particularly challenging for small and medium-sized logistics operators, limiting their ability to adopt electric fleets quickly.
- In addition to vehicle procurement, logistics companies must invest in installing charging stations, maintaining battery health, and training personnel to operate and manage electric fleets effectively. These additional expenses further increase the overall capital requirements and can deter investment in fleet electrification.
- While electric delivery vans provide long-term operational savings and environmental benefits, the substantial initial financial outlay continues to constrain fleet expansion, especially in emerging and cost-sensitive markets.
- This restraint slows fleet electrification adoption and delays realization of total cost-of-ownership benefits for operators.
Opportunity: Expansion of Purpose‑Built Electric Commercial Vans Market
-
The parcel delivery vehicle market presents a significant growth opportunity through the expansion of purpose-built electric commercial vans, driven by the increasing electrification of last-mile logistics and rising demand for sustainable delivery solutions. Vehicle manufacturers can capitalize on this trend by developing and offering electric vans specifically designed for parcel delivery, with optimized cargo capacity, energy-efficient battery systems, and features that enhance operational efficiency.
- Additionally, by leveraging technology and tailoring vehicles to market needs, manufacturers can expand market share while helping logistics companies improve efficiency and reduce emissions. For instance, in 2025, BYD launched the E‑Vali light commercial van in Europe, engineered for high cargo volume and reliable performance in urban delivery routes. This launch highlights region-specific electric vans that meet operational needs and reduce emissions.
- This opportunity enables manufacturers to grow market share by offering versatile, region‑specific electric delivery vehicles.
Key Trend: Strategic Fleet Partnerships with Major Logistics Players
-
The parcel delivery vehicle market, shaped by strategic partnerships between original equipment manufacturers (OEMs) and leading parcel and logistics companies, aimed at co-developing and deploying electric delivery fleets that enhance operational efficiency and sustainability.
- These collaborations enable OEMs to align vehicle design, technology integration, and fleet management solutions with the specific needs of large-scale logistics operations, ensuring optimal performance, reliability, and cost-effectiveness.
- In July 2025, Ford Pro delivered 2,400 electric E‑Transit and E‑Transit Custom vans to Deutsche Post DHL’s Post & Parcel Germany division, significantly expanding one of Europe’s largest electric delivery fleets. This deployment demonstrates how coordinated efforts can accelerate large-scale fleet electrification.
- Additionally, the partnership also strengthened operational coordination, driver training, and maintenance support, creating a replicable model for collaborative electrification initiatives in international markets. Such alliances drive innovation, efficiency, and sustainability in last-mile logistics.
- These partnerships strengthen manufacturer‑fleet integration and accelerate electrified last‑mile deployment globally.
Parcel-Delivery-Vehicle-Market Analysis and Segmental Data
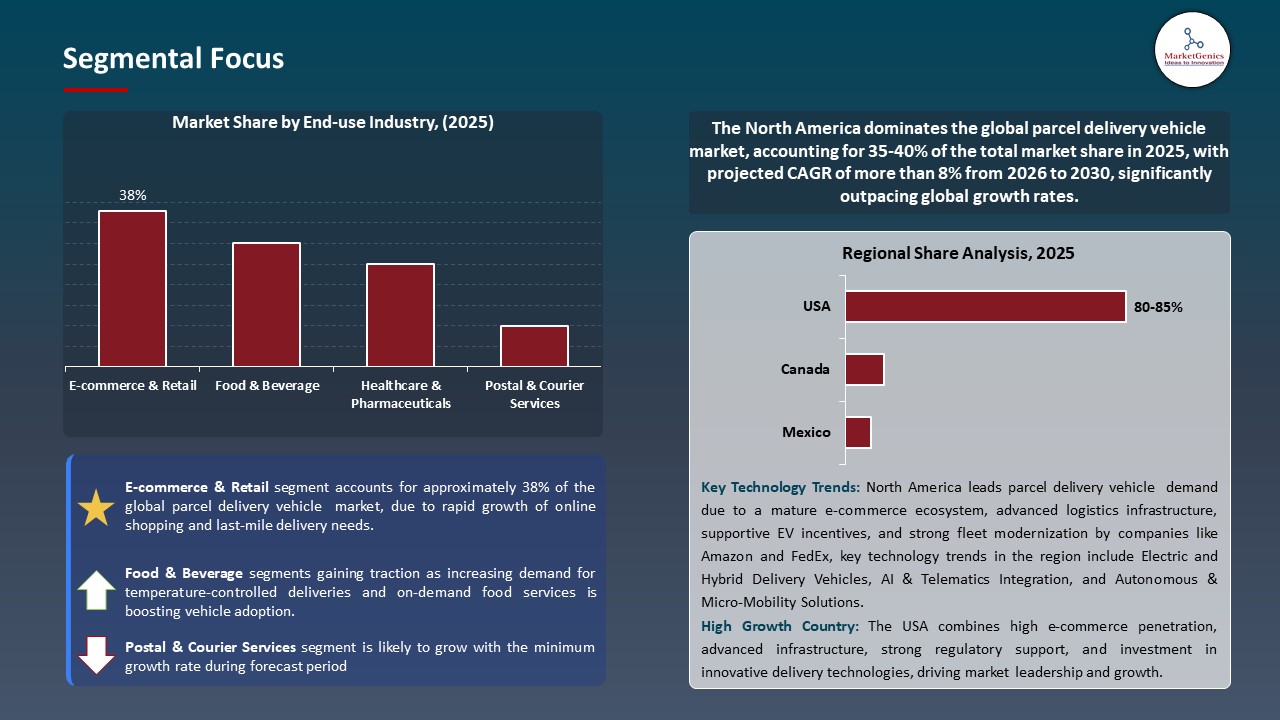
E-commerce & Retail Dominate Global Parcel Delivery Vehicle Market
-
The parcel delivery vehicle market continues to be dominated by e-commerce & retail, which generate substantial demand for efficient last-mile delivery solutions. Rising online shopping volumes and shorter delivery windows are increasing pressure on logistics providers to enhance fleet capacity and reliability.
- Consumer expectations for same-day or next-day delivery further compel companies to adopt advanced delivery vehicles that can navigate urban areas efficiently while handling high parcel volumes.
- In 2025, Amazon’s European delivery partners incorporated nearly 5,000 Mercedes‑Benz electric eSprinter and eVito vans, demonstrating the critical role of parcel delivery vehicles in supporting large-scale e-commerce operations while meeting sustainability targets.
- This trend highlights how retail and e-commerce companies are reshaping fleet requirements, driving OEMs to innovate and supply purpose-built electric and high-capacity delivery vehicles capable of meeting urban distribution challenges efficiently.
- E-commerce and retail growth are intensifying demand for versatile, high-efficiency parcel delivery vehicles globally.
North America Leads Global Parcel Delivery Vehicle Market Demand
-
North America leads the parcel delivery vehicle market, due to supportive policies and emission regulations in the U.S. are encouraging logistics operators to transition to low-emission vehicles. For instance, in 2025, Ford Pro expanded its E-Transit electric fleet in multiple U.S. cities, leveraging federal and state incentives to promote sustainable urban deliveries and accelerate fleet electrification. These drivers reinforce North America’s position as the leading market for innovative, sustainable parcel delivery vehicle solutions.
- Additionally, major logistics and courier companies in North America are actively investing in modern, high-efficiency delivery vehicles to optimize operations and reduce operating costs. In 2025, UPS expanded its electric delivery van fleet in major U.S. cities, integrating advanced telematics and energy-efficient designs to enhance last-mile delivery performance and support sustainability goals. This driver accelerates fleet modernization and strengthens demand for advanced, eco-friendly parcel delivery vehicles in North America.
- These factors collectively accelerate the adoption of electric and high-efficiency parcel delivery vehicles, driving fleet modernization, reducing carbon emissions, and reinforcing North America’s leadership in sustainable last-mile logistics solutions.
Parcel-Delivery-Vehicle-Market Ecosystem
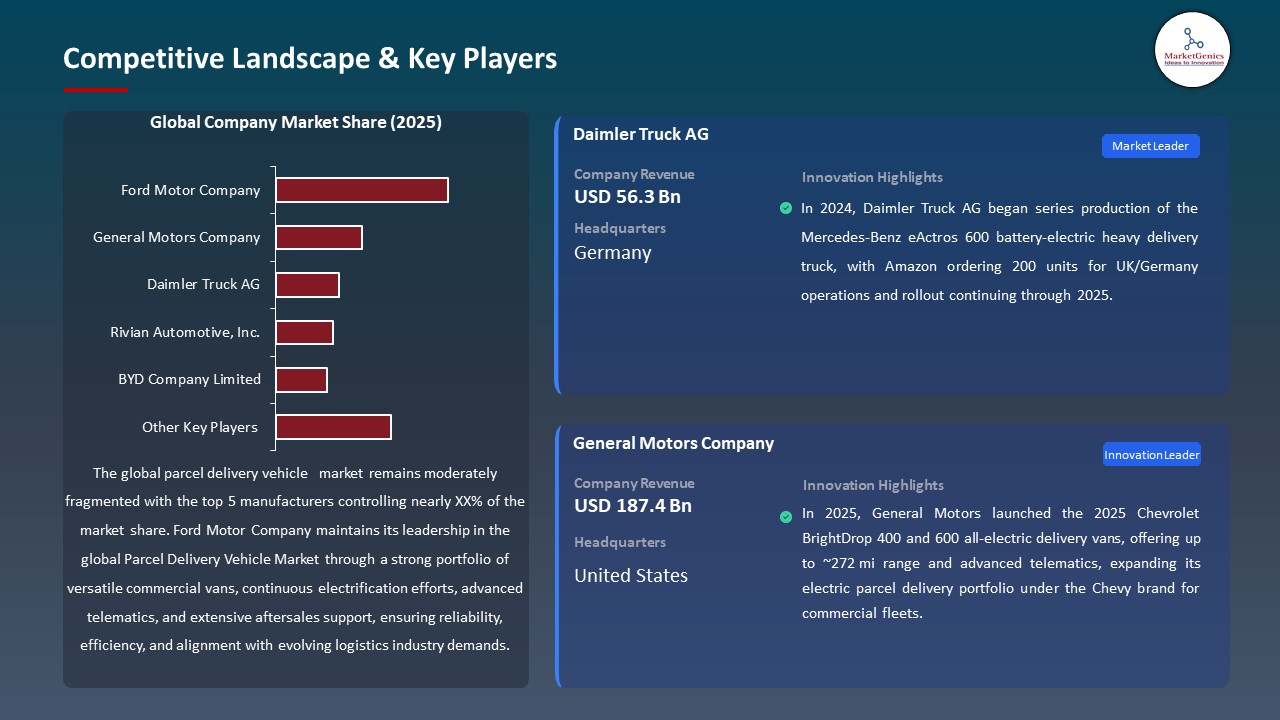
The global parcel delivery vehicle market is moderately fragmented, with high concentration among key players such as Ford Motor Company, General Motors Company, Daimler Truck AG, Rivian Automotive, Inc., and BYD Company Limited, who dominate through extensive product portfolios, strategic partnerships with logistics providers, large-scale fleet deployments, and investments in electrification and advanced vehicle technologies, enabling them to meet rising global demand for efficient and sustainable last-mile delivery solutions.
Their focus on innovation, regional market expansion, and compliance with evolving environmental regulations further strengthens their competitive position, while smaller manufacturers and new entrants continue to explore niche opportunities in electric and autonomous delivery solutions.
The dominance of established OEMs shapes market dynamics, drives technological advancement, and accelerates the adoption of electric and high-efficiency parcel delivery vehicles worldwide.
Recent Development and Strategic Overview:
-
In November 2025, Daimler Truck’s battery‑electric eActros 600 heavy delivery trucks began rolling out for Amazon operations in the UK and Germany, following the company’s largest order (~200 units), advancing large‑scale electrified parcel transport.
- In February 2025, Rivian announced it is officially selling its all‑electric Rivian Commercial Van to fleets of all sizes across the U.S., expanding beyond its previous Amazon‑exclusive arrangement and targeting broad commercial parcel use.
Report Scope
|
Detail |
|
|
Market Size in 2025 |
USD 126.4 Bn |
|
Market Forecast Value in 2035 |
USD 235.1 Bn |
|
Growth Rate (CAGR) |
6.4% |
|
Forecast Period |
2026 – 2035 |
|
Historical Data Available for |
2021 – 2024 |
|
Market Size Units |
US$ Billion for Value Million Units for Volume |
|
Report Format |
Electronic (PDF) + Excel |
|
North America |
Europe |
Asia Pacific |
Middle East |
Africa |
South America |
|
|
|
|
|
|
|
Companies Covered |
|||||
|
|
|
|
|
|
Parcel-Delivery-Vehicle-Market Segmentation and Highlights
|
Segment |
Sub-segment |
|
Parcel Delivery Vehicle Market, By Vehicle Type |
|
|
Parcel Delivery Vehicle Market, By Rated Power (kW/HP) |
|
|
Parcel Delivery Vehicle Market, By Rated Capacity (Payload) |
|
|
Parcel Delivery Vehicle Market, By Battery Capacity (for Electric Vehicles) |
|
|
Parcel Delivery Vehicle Market, By Vehicle Size/Class
|
|
|
Parcel Delivery Vehicle Market, By Technology Integration
|
|
|
Parcel Delivery Vehicle Market, By Ownership Model |
|
|
Parcel Delivery Vehicle Market, By End-use Industry |
|
|
Parcel Delivery Vehicle Market, By Service Type |
|
Frequently Asked Questions
Table of Contents
- 1. Research Methodology and Assumptions
- 1.1. Definitions
- 1.2. Research Design and Approach
- 1.3. Data Collection Methods
- 1.4. Base Estimates and Calculations
- 1.5. Forecasting Models
- 1.5.1. Key Forecast Factors & Impact Analysis
- 1.6. Secondary Research
- 1.6.1. Open Sources
- 1.6.2. Paid Databases
- 1.6.3. Associations
- 1.7. Primary Research
- 1.7.1. Primary Sources
- 1.7.2. Primary Interviews with Stakeholders across Ecosystem
- 2. Executive Summary
- 2.1. Global Parcel Delivery Vehicle Market Outlook
- 2.1.1. Parcel Delivery Vehicle Market Size (Volume – Million Units and Value – US$ Bn), and Forecasts, 2021-2035
- 2.1.2. Compounded Annual Growth Rate Analysis
- 2.1.3. Growth Opportunity Analysis
- 2.1.4. Segmental Share Analysis
- 2.1.5. Geographical Share Analysis
- 2.2. Market Analysis and Facts
- 2.3. Supply-Demand Analysis
- 2.4. Competitive Benchmarking
- 2.5. Go-to- Market Strategy
- 2.5.1. Customer/ End-use Industry Assessment
- 2.5.2. Growth Opportunity Data, 2026-2035
- 2.5.2.1. Regional Data
- 2.5.2.2. Country Data
- 2.5.2.3. Segmental Data
- 2.5.3. Identification of Potential Market Spaces
- 2.5.4. GAP Analysis
- 2.5.5. Potential Attractive Price Points
- 2.5.6. Prevailing Market Risks & Challenges
- 2.5.7. Preferred Sales & Marketing Strategies
- 2.5.8. Key Recommendations and Analysis
- 2.5.9. A Way Forward
- 2.1. Global Parcel Delivery Vehicle Market Outlook
- 3. Industry Data and Premium Insights
- 3.1. Global Automotive & Transportation Industry Overview, 2025
- 3.1.1. Automotive & Transportation Ecosystem Analysis
- 3.1.2. Key Trends for Automotive & Transportation Industry
- 3.1.3. Regional Distribution for Automotive & Transportation Industry
- 3.2. Supplier Customer Data
- 3.3. Technology Roadmap and Developments
- 3.4. Trade Analysis
- 3.4.1. Import & Export Analysis, 2025
- 3.4.2. Top Importing Countries
- 3.4.3. Top Exporting Countries
- 3.5. Trump Tariff Impact Analysis
- 3.5.1. Manufacturer
- 3.5.1.1. Based on the component & Raw material
- 3.5.2. Supply Chain
- 3.5.3. End Consumer
- 3.5.1. Manufacturer
- 3.6. Raw Material Analysis
- 3.1. Global Automotive & Transportation Industry Overview, 2025
- 4. Market Overview
- 4.1. Market Dynamics
- 4.1.1. Drivers
- Rising e4.1.1.1. ‑commerce penetration and online shopping demand
- Adoption of electric and alternative4.1.1.2. ‑fuel delivery vehicles due to sustainability goals
- 4.1.1.3. Technological advancements like telematics, route optimization, and improved battery tech
- 4.1.2. Restraints
- 4.1.2.1. High acquisition and operational costs of vehicles and infrastructure
- 4.1.2.2. Limited charging infrastructure and range constraints in emerging markets
- 4.1.1. Drivers
- 4.2. Key Trend Analysis
- 4.3. Regulatory Framework
- 4.3.1. Key Regulations, Norms, and Subsidies, by Key Countries
- 4.3.2. Tariffs and Standards
- 4.3.3. Impact Analysis of Regulations on the Market
- 4.4. Value Chain Analysis
- 4.4.1. Component & Parts Suppliers
- 4.4.2. Vehicle Manufacturers/ OEMs
- 4.4.3. Distribution & Wholesale Marketers
- 4.4.4. End Consumers / E-Commerce Businesses
- 4.5. Cost Structure Analysis
- 4.5.1. Parameter’s Share for Cost Associated
- 4.5.2. COGP vs COGS
- 4.5.3. Profit Margin Analysis
- 4.6. Pricing Analysis
- 4.6.1. Regional Pricing Analysis
- 4.6.2. Segmental Pricing Trends
- 4.6.3. Factors Influencing Pricing
- 4.7. Porter’s Five Forces Analysis
- 4.8. PESTEL Analysis
- 4.9. Global Parcel Delivery Vehicle Market Demand
- 4.9.1. Historical Market Size – Volume (Million Units) and Value (US$ Bn), 2020-2024
- 4.9.2. Current and Future Market Size – Volume (Million Units) and Value (US$ Bn), 2026–2035
- 4.9.2.1. Y-o-Y Growth Trends
- 4.9.2.2. Absolute $ Opportunity Assessment
- 4.1. Market Dynamics
- 5. Competition Landscape
- 5.1. Competition structure
- 5.1.1. Fragmented v/s consolidated
- 5.2. Company Share Analysis, 2025
- 5.2.1. Global Company Market Share
- 5.2.2. By Region
- 5.2.2.1. North America
- 5.2.2.2. Europe
- 5.2.2.3. Asia Pacific
- 5.2.2.4. Middle East
- 5.2.2.5. Africa
- 5.2.2.6. South America
- 5.3. Product Comparison Matrix
- 5.3.1. Specifications
- 5.3.2. Market Positioning
- 5.3.3. Pricing
- 5.1. Competition structure
- 6. Global Parcel Delivery Vehicle Market Analysis, by Vehicle Type
- 6.1. Key Segment Analysis
- 6.2. Parcel Delivery Vehicle Market Size (Volume – Million Units and Value – US$ Bn), Analysis, and Forecasts, by Vehicle Type, 2021-2035
- 6.2.1. Electric Delivery Vehicles
- 6.2.1.1. Battery Electric Vehicles (BEV)
- 6.2.1.2. Hybrid Electric Vehicles (HEV)
- 6.2.1.3. Plug-in Hybrid Electric Vehicles (PHEV)
- 6.2.2. Internal Combustion Engine Vehicles
- 6.2.2.1. Gasoline-powered
- 6.2.2.2. Diesel-powered
- 6.2.2.3. CNG/LNG-powered
- 6.2.3. Autonomous Delivery Vehicles
- 6.2.3.1. Level 3 Automation
- 6.2.3.2. Level 4 Automation
- 6.2.3.3. Level 5 Automation
- 6.2.1. Electric Delivery Vehicles
- 7. Global Parcel Delivery Vehicle Market Analysis, by Rated Power (kW/HP)
- 7.1. Key Segment Analysis
- 7.2. Parcel Delivery Vehicle Market Size (Volume – Million Units and Value – US$ Bn), Analysis, and Forecasts, by Rated Power (kW/HP), 2021-2035
- 7.2.1. Up to 50 kW (Up to 67 HP)
- 7.2.2. 51-100 kW (68-134 HP)
- 7.2.3. 101-150 kW (135-201 HP)
- 7.2.4. 151-200 kW (202-268 HP)
- 7.2.5. Above 200 kW (Above 268 HP)
- 8. Global Parcel Delivery Vehicle Market Analysis, by Rated Capacity (Payload)
- 8.1. Key Segment Analysis
- 8.2. Parcel Delivery Vehicle Market Size (Volume – Million Units and Value – US$ Bn), Analysis, and Forecasts, by Rated Capacity (Payload), 2021-2035
- 8.2.1. Light-duty (Up to 1.5 tons)
- 8.2.2. Medium-duty (1.5-3.5 tons)
- 8.2.3. Heavy-duty (3.5-7.5 tons)
- 8.2.4. Extra Heavy-duty (Above 7.5 tons)
- 9. Global Parcel Delivery Vehicle Market Analysis, by Battery Capacity (for Electric Vehicles)
- 9.1. Key Segment Analysis
- 9.2. Parcel Delivery Vehicle Market Size (Volume – Million Units and Value – US$ Bn), Analysis, and Forecasts, by Battery Capacity (for Electric Vehicles), 2021-2035
- 9.2.1. Below 50 kWh
- 9.2.2. 50-100 kWh
- 9.2.3. 100-150 kWh
- 9.2.4. 150-200 kWh
- 9.2.5. Above 200 kWh
- 10. Global Parcel Delivery Vehicle Market Analysis, by Vehicle Size/Class
- 10.1. Key Segment Analysis
- 10.2. Parcel Delivery Vehicle Market Size (Volume – Million Units and Value – US$ Bn), Analysis, and Forecasts, by Vehicle Size/Class, 2021-2035
- 10.2.1. Cargo Bikes and E-bikes
- 10.2.2. Compact Vans (Class 1-2)
- 10.2.3. Mid-size Vans (Class 3-4)
- 10.2.4. Large Vans (Class 5-6)
- 10.2.5. Light Trucks (Class 7)
- 10.2.6. Medium to Heavy Trucks (Class 8)
- 11. Global Parcel Delivery Vehicle Market Analysis, by Technology Integration
- 11.1. Key Segment Analysis
- 11.2. Parcel Delivery Vehicle Market Size (Volume – Million Units and Value – US$ Bn), Analysis, and Forecasts, by Technology Integration, 2021-2035
- 11.2.1. Telematics-enabled Vehicles
- 11.2.1.1. GPS Tracking
- 11.2.1.2. Fleet Management Systems
- 11.2.1.3. Route Optimization
- 11.2.1.4. Others
- 11.2.2. IoT-connected Vehicles
- 11.2.2.1. Real-time Monitoring
- 11.2.2.2. Predictive Maintenance
- 11.2.2.3. Temperature Control Systems
- 11.2.2.4. Others
- 11.2.3. AI-powered Vehicles
- 11.2.3.1. Automated Routing
- 11.2.3.2. Driver Assistance Systems
- 11.2.3.3. Smart Loading Systems
- 11.2.3.4. Others
- 11.2.4. Standard Vehicles (Basic Technology)
- 11.2.1. Telematics-enabled Vehicles
- 12. Global Parcel Delivery Vehicle Market Analysis, by Ownership Model
- 12.1. Key Segment Analysis
- 12.2. Parcel Delivery Vehicle Market Size (Volume – Million Units and Value – US$ Bn), Analysis, and Forecasts, by Ownership Model, 2021-2035
- 12.2.1. Owned Fleet
- 12.2.2. Leased/Rental Fleet
- 12.2.3. Subscription-based Fleet
- 12.2.4. Shared/Pooled Fleet
- 13. Global Parcel Delivery Vehicle Market Analysis, by End-use Industry
- 13.1. Key Segment Analysis
- 13.2. Parcel Delivery Vehicle Market Size (Volume – Million Units and Value – US$ Bn), Analysis, and Forecasts, by End-use Industry, 2021-2035
- 13.2.1. E-commerce & Retail
- 13.2.2. Food & Beverage
- 13.2.3. Healthcare & Pharmaceuticals
- 13.2.4. Postal & Courier Services
- 13.2.5. Fashion & Apparel
- 13.2.6. Electronics & Consumer Goods
- 13.2.7. Publishing & Media
- 13.2.8. Furniture & Home Goods
- 13.2.9. Agricultural Products
- 13.2.10. Industrial & B2B
- 14. Global Parcel Delivery Vehicle Market Analysis, by Service Type
- 14.1. Key Segment Analysis
- 14.2. Parcel Delivery Vehicle Market Size (Volume – Million Units and Value – US$ Bn), Analysis, and Forecasts, by Service Type, 2021-2035
- 14.2.1. Business-to-Consumer (B2C)
- 14.2.2. Business-to-Business (B2B)
- 14.2.3. Consumer-to-Consumer (C2C)
- 14.2.4. Peer-to-Peer (P2P)
- 15. Global Parcel Delivery Vehicle Market Analysis and Forecasts, by Region
- 15.1. Key Findings
- 15.2. Parcel Delivery Vehicle Market Size (Volume – Million Units and Value – US$ Bn), Analysis, and Forecasts, by Region, 2021-2035
- 15.2.1. North America
- 15.2.2. Europe
- 15.2.3. Asia Pacific
- 15.2.4. Middle East
- 15.2.5. Africa
- 15.2.6. South America
- 16. North America Parcel Delivery Vehicle Market Analysis
- 16.1. Key Segment Analysis
- 16.2. Regional Snapshot
- 16.3. North America Parcel Delivery Vehicle Market Size (Volume – Million Units and Value – US$ Bn), Analysis, and Forecasts, 2021-2035
- 16.3.1. Vehicle Type
- 16.3.2. Rated Power (kW/HP)
- 16.3.3. Rated Capacity (Payload)
- 16.3.4. Battery Capacity (for Electric Vehicles)
- 16.3.5. Vehicle Size/Class
- 16.3.6. Technology Integration
- 16.3.7. Ownership Model
- 16.3.8. End-use Industry
- 16.3.9. Service Type
- 16.3.10. Country
- 16.3.10.1. USA
- 16.3.10.2. Canada
- 16.3.10.3. Mexico
- 16.4. USA Parcel Delivery Vehicle Market
- 16.4.1. Country Segmental Analysis
- 16.4.2. Vehicle Type
- 16.4.3. Rated Power (kW/HP)
- 16.4.4. Rated Capacity (Payload)
- 16.4.5. Battery Capacity (for Electric Vehicles)
- 16.4.6. Vehicle Size/Class
- 16.4.7. Technology Integration
- 16.4.8. Ownership Model
- 16.4.9. End-use Industry
- 16.4.10. Service Type
- 16.5. Canada Parcel Delivery Vehicle Market
- 16.5.1. Country Segmental Analysis
- 16.5.2. Vehicle Type
- 16.5.3. Rated Power (kW/HP)
- 16.5.4. Rated Capacity (Payload)
- 16.5.5. Battery Capacity (for Electric Vehicles)
- 16.5.6. Vehicle Size/Class
- 16.5.7. Technology Integration
- 16.5.8. Ownership Model
- 16.5.9. End-use Industry
- 16.5.10. Service Type
- 16.6. Mexico Parcel Delivery Vehicle Market
- 16.6.1. Country Segmental Analysis
- 16.6.2. Vehicle Type
- 16.6.3. Rated Power (kW/HP)
- 16.6.4. Rated Capacity (Payload)
- 16.6.5. Battery Capacity (for Electric Vehicles)
- 16.6.6. Vehicle Size/Class
- 16.6.7. Technology Integration
- 16.6.8. Ownership Model
- 16.6.9. End-use Industry
- 16.6.10. Service Type
- 17. Europe Parcel Delivery Vehicle Market Analysis
- 17.1. Key Segment Analysis
- 17.2. Regional Snapshot
- 17.3. Europe Parcel Delivery Vehicle Market Size (Volume – Million Units and Value – US$ Bn), Analysis, and Forecasts, 2021-2035
- 17.3.1. Vehicle Type
- 17.3.2. Rated Power (kW/HP)
- 17.3.3. Rated Capacity (Payload)
- 17.3.4. Battery Capacity (for Electric Vehicles)
- 17.3.5. Vehicle Size/Class
- 17.3.6. Technology Integration
- 17.3.7. Ownership Model
- 17.3.8. End-use Industry
- 17.3.9. Service Type
- 17.3.10. Country
- 17.3.10.1. Germany
- 17.3.10.2. United Kingdom
- 17.3.10.3. France
- 17.3.10.4. Italy
- 17.3.10.5. Spain
- 17.3.10.6. Netherlands
- 17.3.10.7. Nordic Countries
- 17.3.10.8. Poland
- 17.3.10.9. Russia & CIS
- 17.3.10.10. Rest of Europe
- 17.4. Germany Parcel Delivery Vehicle Market
- 17.4.1. Country Segmental Analysis
- 17.4.2. Vehicle Type
- 17.4.3. Rated Power (kW/HP)
- 17.4.4. Rated Capacity (Payload)
- 17.4.5. Battery Capacity (for Electric Vehicles)
- 17.4.6. Vehicle Size/Class
- 17.4.7. Technology Integration
- 17.4.8. Ownership Model
- 17.4.9. End-use Industry
- 17.4.10. Service Type
- 17.5. United Kingdom Parcel Delivery Vehicle Market
- 17.5.1. Country Segmental Analysis
- 17.5.2. Vehicle Type
- 17.5.3. Rated Power (kW/HP)
- 17.5.4. Rated Capacity (Payload)
- 17.5.5. Battery Capacity (for Electric Vehicles)
- 17.5.6. Vehicle Size/Class
- 17.5.7. Technology Integration
- 17.5.8. Ownership Model
- 17.5.9. End-use Industry
- 17.5.10. Service Type
- 17.6. France Parcel Delivery Vehicle Market
- 17.6.1. Country Segmental Analysis
- 17.6.2. Vehicle Type
- 17.6.3. Rated Power (kW/HP)
- 17.6.4. Rated Capacity (Payload)
- 17.6.5. Battery Capacity (for Electric Vehicles)
- 17.6.6. Vehicle Size/Class
- 17.6.7. Technology Integration
- 17.6.8. Ownership Model
- 17.6.9. End-use Industry
- 17.6.10. Service Type
- 17.7. Italy Parcel Delivery Vehicle Market
- 17.7.1. Country Segmental Analysis
- 17.7.2. Vehicle Type
- 17.7.3. Rated Power (kW/HP)
- 17.7.4. Rated Capacity (Payload)
- 17.7.5. Battery Capacity (for Electric Vehicles)
- 17.7.6. Vehicle Size/Class
- 17.7.7. Technology Integration
- 17.7.8. Ownership Model
- 17.7.9. End-use Industry
- 17.7.10. Service Type
- 17.8. Spain Parcel Delivery Vehicle Market
- 17.8.1. Country Segmental Analysis
- 17.8.2. Vehicle Type
- 17.8.3. Rated Power (kW/HP)
- 17.8.4. Rated Capacity (Payload)
- 17.8.5. Battery Capacity (for Electric Vehicles)
- 17.8.6. Vehicle Size/Class
- 17.8.7. Technology Integration
- 17.8.8. Ownership Model
- 17.8.9. End-use Industry
- 17.8.10. Service Type
- 17.9. Netherlands Parcel Delivery Vehicle Market
- 17.9.1. Country Segmental Analysis
- 17.9.2. Vehicle Type
- 17.9.3. Rated Power (kW/HP)
- 17.9.4. Rated Capacity (Payload)
- 17.9.5. Battery Capacity (for Electric Vehicles)
- 17.9.6. Vehicle Size/Class
- 17.9.7. Technology Integration
- 17.9.8. Ownership Model
- 17.9.9. End-use Industry
- 17.9.10. Service Type
- 17.10. Nordic Countries Parcel Delivery Vehicle Market
- 17.10.1. Country Segmental Analysis
- 17.10.2. Vehicle Type
- 17.10.3. Rated Power (kW/HP)
- 17.10.4. Rated Capacity (Payload)
- 17.10.5. Battery Capacity (for Electric Vehicles)
- 17.10.6. Vehicle Size/Class
- 17.10.7. Technology Integration
- 17.10.8. Ownership Model
- 17.10.9. End-use Industry
- 17.10.10. Service Type
- 17.11. Poland Parcel Delivery Vehicle Market
- 17.11.1. Country Segmental Analysis
- 17.11.2. Vehicle Type
- 17.11.3. Rated Power (kW/HP)
- 17.11.4. Rated Capacity (Payload)
- 17.11.5. Battery Capacity (for Electric Vehicles)
- 17.11.6. Vehicle Size/Class
- 17.11.7. Technology Integration
- 17.11.8. Ownership Model
- 17.11.9. End-use Industry
- 17.11.10. Service Type
- 17.12. Russia & CIS Parcel Delivery Vehicle Market
- 17.12.1. Country Segmental Analysis
- 17.12.2. Vehicle Type
- 17.12.3. Rated Power (kW/HP)
- 17.12.4. Rated Capacity (Payload)
- 17.12.5. Battery Capacity (for Electric Vehicles)
- 17.12.6. Vehicle Size/Class
- 17.12.7. Technology Integration
- 17.12.8. Ownership Model
- 17.12.9. End-use Industry
- 17.12.10. Service Type
- 17.13. Rest of Europe Parcel Delivery Vehicle Market
- 17.13.1. Country Segmental Analysis
- 17.13.2. Vehicle Type
- 17.13.3. Rated Power (kW/HP)
- 17.13.4. Rated Capacity (Payload)
- 17.13.5. Battery Capacity (for Electric Vehicles)
- 17.13.6. Vehicle Size/Class
- 17.13.7. Technology Integration
- 17.13.8. Ownership Model
- 17.13.9. End-use Industry
- 17.13.10. Service Type
- 18. Asia Pacific Parcel Delivery Vehicle Market Analysis
- 18.1. Key Segment Analysis
- 18.2. Regional Snapshot
- 18.3. Asia Pacific Parcel Delivery Vehicle Market Size (Volume – Million Units and Value – US$ Bn), Analysis, and Forecasts, 2021-2035
- 18.3.1. Vehicle Type
- 18.3.2. Rated Power (kW/HP)
- 18.3.3. Rated Capacity (Payload)
- 18.3.4. Battery Capacity (for Electric Vehicles)
- 18.3.5. Vehicle Size/Class
- 18.3.6. Technology Integration
- 18.3.7. Ownership Model
- 18.3.8. End-use Industry
- 18.3.9. Service Type
- 18.3.10. Country
- 18.3.10.1. China
- 18.3.10.2. India
- 18.3.10.3. Japan
- 18.3.10.4. South Korea
- 18.3.10.5. Australia and New Zealand
- 18.3.10.6. Indonesia
- 18.3.10.7. Malaysia
- 18.3.10.8. Thailand
- 18.3.10.9. Vietnam
- 18.3.10.10. Rest of Asia Pacific
- 18.4. China Parcel Delivery Vehicle Market
- 18.4.1. Country Segmental Analysis
- 18.4.2. Vehicle Type
- 18.4.3. Rated Power (kW/HP)
- 18.4.4. Rated Capacity (Payload)
- 18.4.5. Battery Capacity (for Electric Vehicles)
- 18.4.6. Vehicle Size/Class
- 18.4.7. Technology Integration
- 18.4.8. Ownership Model
- 18.4.9. End-use Industry
- 18.4.10. Service Type
- 18.5. India Parcel Delivery Vehicle Market
- 18.5.1. Country Segmental Analysis
- 18.5.2. Vehicle Type
- 18.5.3. Rated Power (kW/HP)
- 18.5.4. Rated Capacity (Payload)
- 18.5.5. Battery Capacity (for Electric Vehicles)
- 18.5.6. Vehicle Size/Class
- 18.5.7. Technology Integration
- 18.5.8. Ownership Model
- 18.5.9. End-use Industry
- 18.5.10. Service Type
- 18.6. Japan Parcel Delivery Vehicle Market
- 18.6.1. Country Segmental Analysis
- 18.6.2. Vehicle Type
- 18.6.3. Rated Power (kW/HP)
- 18.6.4. Rated Capacity (Payload)
- 18.6.5. Battery Capacity (for Electric Vehicles)
- 18.6.6. Vehicle Size/Class
- 18.6.7. Technology Integration
- 18.6.8. Ownership Model
- 18.6.9. End-use Industry
- 18.6.10. Service Type
- 18.7. South Korea Parcel Delivery Vehicle Market
- 18.7.1. Country Segmental Analysis
- 18.7.2. Vehicle Type
- 18.7.3. Rated Power (kW/HP)
- 18.7.4. Rated Capacity (Payload)
- 18.7.5. Battery Capacity (for Electric Vehicles)
- 18.7.6. Vehicle Size/Class
- 18.7.7. Technology Integration
- 18.7.8. Ownership Model
- 18.7.9. End-use Industry
- 18.7.10. Service Type
- 18.8. Australia and New Zealand Parcel Delivery Vehicle Market
- 18.8.1. Country Segmental Analysis
- 18.8.2. Vehicle Type
- 18.8.3. Rated Power (kW/HP)
- 18.8.4. Rated Capacity (Payload)
- 18.8.5. Battery Capacity (for Electric Vehicles)
- 18.8.6. Vehicle Size/Class
- 18.8.7. Technology Integration
- 18.8.8. Ownership Model
- 18.8.9. End-use Industry
- 18.8.10. Service Type
- 18.9. Indonesia Parcel Delivery Vehicle Market
- 18.9.1. Country Segmental Analysis
- 18.9.2. Vehicle Type
- 18.9.3. Rated Power (kW/HP)
- 18.9.4. Rated Capacity (Payload)
- 18.9.5. Battery Capacity (for Electric Vehicles)
- 18.9.6. Vehicle Size/Class
- 18.9.7. Technology Integration
- 18.9.8. Ownership Model
- 18.9.9. End-use Industry
- 18.9.10. Service Type
- 18.10. Malaysia Parcel Delivery Vehicle Market
- 18.10.1. Country Segmental Analysis
- 18.10.2. Vehicle Type
- 18.10.3. Rated Power (kW/HP)
- 18.10.4. Rated Capacity (Payload)
- 18.10.5. Battery Capacity (for Electric Vehicles)
- 18.10.6. Vehicle Size/Class
- 18.10.7. Technology Integration
- 18.10.8. Ownership Model
- 18.10.9. End-use Industry
- 18.10.10. Service Type
- 18.11. Thailand Parcel Delivery Vehicle Market
- 18.11.1. Country Segmental Analysis
- 18.11.2. Vehicle Type
- 18.11.3. Rated Power (kW/HP)
- 18.11.4. Rated Capacity (Payload)
- 18.11.5. Battery Capacity (for Electric Vehicles)
- 18.11.6. Vehicle Size/Class
- 18.11.7. Technology Integration
- 18.11.8. Ownership Model
- 18.11.9. End-use Industry
- 18.11.10. Service Type
- 18.12. Vietnam Parcel Delivery Vehicle Market
- 18.12.1. Country Segmental Analysis
- 18.12.2. Vehicle Type
- 18.12.3. Rated Power (kW/HP)
- 18.12.4. Rated Capacity (Payload)
- 18.12.5. Battery Capacity (for Electric Vehicles)
- 18.12.6. Vehicle Size/Class
- 18.12.7. Technology Integration
- 18.12.8. Ownership Model
- 18.12.9. End-use Industry
- 18.12.10. Service Type
- 18.13. Rest of Asia Pacific Parcel Delivery Vehicle Market
- 18.13.1. Country Segmental Analysis
- 18.13.2. Vehicle Type
- 18.13.3. Rated Power (kW/HP)
- 18.13.4. Rated Capacity (Payload)
- 18.13.5. Battery Capacity (for Electric Vehicles)
- 18.13.6. Vehicle Size/Class
- 18.13.7. Technology Integration
- 18.13.8. Ownership Model
- 18.13.9. End-use Industry
- 18.13.10. Service Type
- 19. Middle East Parcel Delivery Vehicle Market Analysis
- 19.1. Key Segment Analysis
- 19.2. Regional Snapshot
- 19.3. Middle East Parcel Delivery Vehicle Market Size (Volume – Million Units and Value – US$ Bn), Analysis, and Forecasts, 2021-2035
- 19.3.1. Vehicle Type
- 19.3.2. Rated Power (kW/HP)
- 19.3.3. Rated Capacity (Payload)
- 19.3.4. Battery Capacity (for Electric Vehicles)
- 19.3.5. Vehicle Size/Class
- 19.3.6. Technology Integration
- 19.3.7. Ownership Model
- 19.3.8. End-use Industry
- 19.3.9. Service Type
- 19.3.10. Country
- 19.3.10.1. Turkey
- 19.3.10.2. UAE
- 19.3.10.3. Saudi Arabia
- 19.3.10.4. Israel
- 19.3.10.5. Rest of Middle East
- 19.4. Turkey Parcel Delivery Vehicle Market
- 19.4.1. Country Segmental Analysis
- 19.4.2. Vehicle Type
- 19.4.3. Rated Power (kW/HP)
- 19.4.4. Rated Capacity (Payload)
- 19.4.5. Battery Capacity (for Electric Vehicles)
- 19.4.6. Vehicle Size/Class
- 19.4.7. Technology Integration
- 19.4.8. Ownership Model
- 19.4.9. End-use Industry
- 19.4.10. Service Type
- 19.5. UAE Parcel Delivery Vehicle Market
- 19.5.1. Country Segmental Analysis
- 19.5.2. Vehicle Type
- 19.5.3. Rated Power (kW/HP)
- 19.5.4. Rated Capacity (Payload)
- 19.5.5. Battery Capacity (for Electric Vehicles)
- 19.5.6. Vehicle Size/Class
- 19.5.7. Technology Integration
- 19.5.8. Ownership Model
- 19.5.9. End-use Industry
- 19.5.10. Service Type
- 19.6. Saudi Arabia Parcel Delivery Vehicle Market
- 19.6.1. Country Segmental Analysis
- 19.6.2. Vehicle Type
- 19.6.3. Rated Power (kW/HP)
- 19.6.4. Rated Capacity (Payload)
- 19.6.5. Battery Capacity (for Electric Vehicles)
- 19.6.6. Vehicle Size/Class
- 19.6.7. Technology Integration
- 19.6.8. Ownership Model
- 19.6.9. End-use Industry
- 19.6.10. Service Type
- 19.7. Israel Parcel Delivery Vehicle Market
- 19.7.1. Country Segmental Analysis
- 19.7.2. Vehicle Type
- 19.7.3. Rated Power (kW/HP)
- 19.7.4. Rated Capacity (Payload)
- 19.7.5. Battery Capacity (for Electric Vehicles)
- 19.7.6. Vehicle Size/Class
- 19.7.7. Technology Integration
- 19.7.8. Ownership Model
- 19.7.9. End-use Industry
- 19.7.10. Service Type
- 19.8. Rest of Middle East Parcel Delivery Vehicle Market
- 19.8.1. Country Segmental Analysis
- 19.8.2. Vehicle Type
- 19.8.3. Rated Power (kW/HP)
- 19.8.4. Rated Capacity (Payload)
- 19.8.5. Battery Capacity (for Electric Vehicles)
- 19.8.6. Vehicle Size/Class
- 19.8.7. Technology Integration
- 19.8.8. Ownership Model
- 19.8.9. End-use Industry
- 19.8.10. Service Type
- 20. Africa Parcel Delivery Vehicle Market Analysis
- 20.1. Key Segment Analysis
- 20.2. Regional Snapshot
- 20.3. Africa Parcel Delivery Vehicle Market Size (Volume – Million Units and Value – US$ Bn), Analysis, and Forecasts, 2021-2035
- 20.3.1. Vehicle Type
- 20.3.2. Rated Power (kW/HP)
- 20.3.3. Rated Capacity (Payload)
- 20.3.4. Battery Capacity (for Electric Vehicles)
- 20.3.5. Vehicle Size/Class
- 20.3.6. Technology Integration
- 20.3.7. Ownership Model
- 20.3.8. End-use Industry
- 20.3.9. Service Type
- 20.3.10. Country
- 20.3.10.1. South Africa
- 20.3.10.2. Egypt
- 20.3.10.3. Nigeria
- 20.3.10.4. Algeria
- 20.3.10.5. Rest of Africa
- 20.4. South Africa Parcel Delivery Vehicle Market
- 20.4.1. Country Segmental Analysis
- 20.4.2. Vehicle Type
- 20.4.3. Rated Power (kW/HP)
- 20.4.4. Rated Capacity (Payload)
- 20.4.5. Battery Capacity (for Electric Vehicles)
- 20.4.6. Vehicle Size/Class
- 20.4.7. Technology Integration
- 20.4.8. Ownership Model
- 20.4.9. End-use Industry
- 20.4.10. Service Type
- 20.5. Egypt Parcel Delivery Vehicle Market
- 20.5.1. Country Segmental Analysis
- 20.5.2. Vehicle Type
- 20.5.3. Rated Power (kW/HP)
- 20.5.4. Rated Capacity (Payload)
- 20.5.5. Battery Capacity (for Electric Vehicles)
- 20.5.6. Vehicle Size/Class
- 20.5.7. Technology Integration
- 20.5.8. Ownership Model
- 20.5.9. End-use Industry
- 20.5.10. Service Type
- 20.6. Nigeria Parcel Delivery Vehicle Market
- 20.6.1. Country Segmental Analysis
- 20.6.2. Vehicle Type
- 20.6.3. Rated Power (kW/HP)
- 20.6.4. Rated Capacity (Payload)
- 20.6.5. Battery Capacity (for Electric Vehicles)
- 20.6.6. Vehicle Size/Class
- 20.6.7. Technology Integration
- 20.6.8. Ownership Model
- 20.6.9. End-use Industry
- 20.6.10. Service Type
- 20.7. Algeria Parcel Delivery Vehicle Market
- 20.7.1. Country Segmental Analysis
- 20.7.2. Vehicle Type
- 20.7.3. Rated Power (kW/HP)
- 20.7.4. Rated Capacity (Payload)
- 20.7.5. Battery Capacity (for Electric Vehicles)
- 20.7.6. Vehicle Size/Class
- 20.7.7. Technology Integration
- 20.7.8. Ownership Model
- 20.7.9. End-use Industry
- 20.7.10. Service Type
- 20.8. Rest of Africa Parcel Delivery Vehicle Market
- 20.8.1. Country Segmental Analysis
- 20.8.2. Vehicle Type
- 20.8.3. Rated Power (kW/HP)
- 20.8.4. Rated Capacity (Payload)
- 20.8.5. Battery Capacity (for Electric Vehicles)
- 20.8.6. Vehicle Size/Class
- 20.8.7. Technology Integration
- 20.8.8. Ownership Model
- 20.8.9. End-use Industry
- 20.8.10. Service Type
- 21. South America Parcel Delivery Vehicle Market Analysis
- 21.1. Key Segment Analysis
- 21.2. Regional Snapshot
- 21.3. South America Parcel Delivery Vehicle Market Size (Volume – Million Units and Value – US$ Bn), Analysis, and Forecasts, 2021-2035
- 21.3.1. Vehicle Type
- 21.3.2. Rated Power (kW/HP)
- 21.3.3. Rated Capacity (Payload)
- 21.3.4. Battery Capacity (for Electric Vehicles)
- 21.3.5. Vehicle Size/Class
- 21.3.6. Technology Integration
- 21.3.7. Ownership Model
- 21.3.8. End-use Industry
- 21.3.9. Service Type
- 21.3.10. Country
- 21.3.10.1. Brazil
- 21.3.10.2. Argentina
- 21.3.10.3. Rest of South America
- 21.4. Brazil Parcel Delivery Vehicle Market
- 21.4.1. Country Segmental Analysis
- 21.4.2. Vehicle Type
- 21.4.3. Rated Power (kW/HP)
- 21.4.4. Rated Capacity (Payload)
- 21.4.5. Battery Capacity (for Electric Vehicles)
- 21.4.6. Vehicle Size/Class
- 21.4.7. Technology Integration
- 21.4.8. Ownership Model
- 21.4.9. End-use Industry
- 21.4.10. Service Type
- 21.5. Argentina Parcel Delivery Vehicle Market
- 21.5.1. Country Segmental Analysis
- 21.5.2. Vehicle Type
- 21.5.3. Rated Power (kW/HP)
- 21.5.4. Rated Capacity (Payload)
- 21.5.5. Battery Capacity (for Electric Vehicles)
- 21.5.6. Vehicle Size/Class
- 21.5.7. Technology Integration
- 21.5.8. Ownership Model
- 21.5.9. End-use Industry
- 21.5.10. Service Type
- 21.6. Rest of South America Parcel Delivery Vehicle Market
- 21.6.1. Country Segmental Analysis
- 21.6.2. Vehicle Type
- 21.6.3. Rated Power (kW/HP)
- 21.6.4. Rated Capacity (Payload)
- 21.6.5. Battery Capacity (for Electric Vehicles)
- 21.6.6. Vehicle Size/Class
- 21.6.7. Technology Integration
- 21.6.8. Ownership Model
- 21.6.9. End-use Industry
- 21.6.10. Service Type
- 22. Key Players/ Company Profile
- 22.1. Arrival Ltd.
- 22.1.1. Company Details/ Overview
- 22.1.2. Company Financials
- 22.1.3. Key Customers and Competitors
- 22.1.4. Business/ Industry Portfolio
- 22.1.5. Product Portfolio/ Specification Details
- 22.1.6. Pricing Data
- 22.1.7. Strategic Overview
- 22.1.8. Recent Developments
- 22.2. BYD Company Limited
- 22.3. Daimler Truck AG
- 22.4. Dongfeng Motor Corporation
- 22.5. Ford Motor Company
- 22.6. General Motors Company
- 22.7. Hino Motors, Ltd.
- 22.8. Isuzu Motors Limited
- 22.9. JAC Motors
- 22.10. Lion Electric Company
- 22.11. Mercedes-Benz Group AG
- 22.12. Mitsubishi Fuso Truck and Bus Corporation
- 22.13. Motiv Power Systems
- 22.14. Nikola Corporation
- 22.15. Phoenix Motorcars
- 22.16. Rivian Automotive, Inc.
- 22.17. SAIC Motor Corporation Limited
- 22.18. Stellantis N.V.
- 22.19. Volvo Group
- 22.20. Workhorse Group Inc
- 22.21. Zenith Motors
- 22.22. Other Key Players
- 22.1. Arrival Ltd.
Note* - This is just tentative list of players. While providing the report, we will cover more number of players based on their revenue and share for each geography
Research Design
Our research design integrates both demand-side and supply-side analysis through a balanced combination of primary and secondary research methodologies. By utilizing both bottom-up and top-down approaches alongside rigorous data triangulation methods, we deliver robust market intelligence that supports strategic decision-making.
MarketGenics' comprehensive research design framework ensures the delivery of accurate, reliable, and actionable market intelligence. Through the integration of multiple research approaches, rigorous validation processes, and expert analysis, we provide our clients with the insights needed to make informed strategic decisions and capitalize on market opportunities.

MarketGenics leverages a dedicated industry panel of experts and a comprehensive suite of paid databases to effectively collect, consolidate, and analyze market intelligence.
Our approach has consistently proven to be reliable and effective in generating accurate market insights, identifying key industry trends, and uncovering emerging business opportunities.
Through both primary and secondary research, we capture and analyze critical company-level data such as manufacturing footprints, including technical centers, R&D facilities, sales offices, and headquarters.
Our expert panel further enhances our ability to estimate market size for specific brands based on validated field-level intelligence.
Our data mining techniques incorporate both parametric and non-parametric methods, allowing for structured data collection, sorting, processing, and cleaning.
Demand projections are derived from large-scale data sets analyzed through proprietary algorithms, culminating in robust and reliable market sizing.
Research Approach
The bottom-up approach builds market estimates by starting with the smallest addressable market units and systematically aggregating them to create comprehensive market size projections.
This method begins with specific, granular data points and builds upward to create the complete market landscape.
Customer Analysis → Segmental Analysis → Geographical Analysis
The top-down approach starts with the broadest possible market data and systematically narrows it down through a series of filters and assumptions to arrive at specific market segments or opportunities.
This method begins with the big picture and works downward to increasingly specific market slices.
TAM → SAM → SOM


Research Methods
Desk / Secondary Research
While analysing the market, we extensively study secondary sources, directories, and databases to identify and collect information useful for this technical, market-oriented, and commercial report. Secondary sources that we utilize are not only the public sources, but it is a combination of Open Source, Associations, Paid Databases, MG Repository & Knowledgebase, and others.
- Company websites, annual reports, financial reports, broker reports, and investor presentations
- National government documents, statistical databases and reports
- News articles, press releases and web-casts specific to the companies operating in the market, Magazines, reports, and others
- We gather information from commercial data sources for deriving company specific data such as segmental revenue, share for geography, product revenue, and others
- Internal and external proprietary databases (industry-specific), relevant patent, and regulatory databases
- Governing Bodies, Government Organizations
- Relevant Authorities, Country-specific Associations for Industries
We also employ the model mapping approach to estimate the product level market data through the players' product portfolio
Primary Research
Primary research/ interviews is vital in analyzing the market. Most of the cases involves paid primary interviews. Primary sources include primary interviews through e-mail interactions, telephonic interviews, surveys as well as face-to-face interviews with the different stakeholders across the value chain including several industry experts.
| Type of Respondents | Number of Primaries |
|---|---|
| Tier 2/3 Suppliers | ~20 |
| Tier 1 Suppliers | ~25 |
| End-users | ~25 |
| Industry Expert/ Panel/ Consultant | ~30 |
| Total | ~100 |
MG Knowledgebase
• Repository of industry blog, newsletter and case studies
• Online platform covering detailed market reports, and company profiles
Forecasting Factors and Models
Forecasting Factors
- Historical Trends – Past market patterns, cycles, and major events that shaped how markets behave over time. Understanding past trends helps predict future behavior.
- Industry Factors – Specific characteristics of the industry like structure, regulations, and innovation cycles that affect market dynamics.
- Macroeconomic Factors – Economic conditions like GDP growth, inflation, and employment rates that affect how much money people have to spend.
- Demographic Factors – Population characteristics like age, income, and location that determine who can buy your product.
- Technology Factors – How quickly people adopt new technology and how much technology infrastructure exists.
- Regulatory Factors – Government rules, laws, and policies that can help or restrict market growth.
- Competitive Factors – Analyzing competition structure such as degree of competition and bargaining power of buyers and suppliers.
Forecasting Models / Techniques
Multiple Regression Analysis
- Identify and quantify factors that drive market changes
- Statistical modeling to establish relationships between market drivers and outcomes
Time Series Analysis – Seasonal Patterns
- Understand regular cyclical patterns in market demand
- Advanced statistical techniques to separate trend, seasonal, and irregular components
Time Series Analysis – Trend Analysis
- Identify underlying market growth patterns and momentum
- Statistical analysis of historical data to project future trends
Expert Opinion – Expert Interviews
- Gather deep industry insights and contextual understanding
- In-depth interviews with key industry stakeholders
Multi-Scenario Development
- Prepare for uncertainty by modeling different possible futures
- Creating optimistic, pessimistic, and most likely scenarios
Time Series Analysis – Moving Averages
- Sophisticated forecasting for complex time series data
- Auto-regressive integrated moving average models with seasonal components
Econometric Models
- Apply economic theory to market forecasting
- Sophisticated economic models that account for market interactions
Expert Opinion – Delphi Method
- Harness collective wisdom of industry experts
- Structured, multi-round expert consultation process
Monte Carlo Simulation
- Quantify uncertainty and probability distributions
- Thousands of simulations with varying input parameters
Research Analysis
Our research framework is built upon the fundamental principle of validating market intelligence from both demand and supply perspectives. This dual-sided approach ensures comprehensive market understanding and reduces the risk of single-source bias.
Demand-Side Analysis: We understand end-user/application behavior, preferences, and market needs along with the penetration of the product for specific application.
Supply-Side Analysis: We estimate overall market revenue, analyze the segmental share along with industry capacity, competitive landscape, and market structure.
Validation & Evaluation
Data triangulation is a validation technique that uses multiple methods, sources, or perspectives to examine the same research question, thereby increasing the credibility and reliability of research findings. In market research, triangulation serves as a quality assurance mechanism that helps identify and minimize bias, validate assumptions, and ensure accuracy in market estimates.
- Data Source Triangulation – Using multiple data sources to examine the same phenomenon
- Methodological Triangulation – Using multiple research methods to study the same research question
- Investigator Triangulation – Using multiple researchers or analysts to examine the same data
- Theoretical Triangulation – Using multiple theoretical perspectives to interpret the same data

Custom Market Research Services
We will customise the research for you, in case the report listed above does not meet your requirements.
Get 10% Free Customisation