Quantum RFID Tags Market Size, Share & Trends Analysis Report by Technology Type (Passive Quantum RFID Tags, Active Quantum RFID Tags, Semi-passive Quantum RFID Tags, Battery-assisted Passive (BAP) Quantum RFID Tags), Frequency Range, Rated Power, Form Factor, Read Range, Material Type, End-users, and Geography (North America, Europe, Asia Pacific, Middle East, Africa, and South America) – Global Industry Data, Trends, and Forecasts, 2026–2035
|
|
|
Segmental Data Insights |
|
|
Demand Trends |
|
|
Competitive Landscape |
|
|
Strategic Development |
|
|
Future Outlook & Opportunities |
|
Quantum RFID Tags Market Size, Share, and Growth
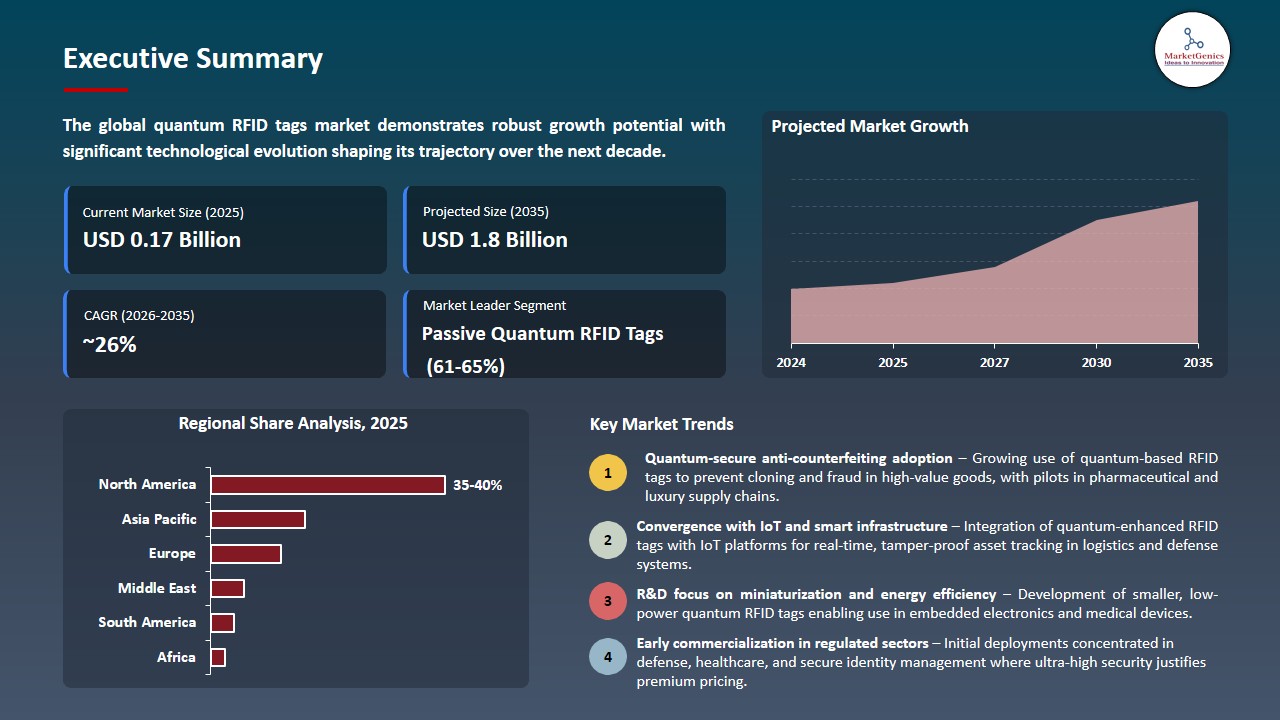
The global quantum RFID tags market is experiencing robust growth, with its estimated value of USD 0.17 billion in the year 2025 and USD 1.8 billion by the period 2035, registering a CAGR of 26.3%, during the forecast period. The global quantum RFID tags market, driven by the need for enhanced security, faster data processing, and improved inventory tracking across sectors like retail, healthcare, and logistics, along with increasing adoption of IoT and smart supply chain solutions.
Dr. Manfred Mueller, Chief Strategy Officer at Identiv said, “The ID-Brain product family addresses key challenges businesses face today – inefficiencies in inventory tracking, ineffective loss prevention, and limited consumer engagement – by integrating NFC and RAIN UHF RFID into a single, dual-frequency tag. With ID-Brain, businesses can streamline operations, reduce costs, and enhance both security and customer engagement with a smarter, more scalable RFID solution that’s built to last.”
The quantum RFID Tags market, driven by the growing number of organizations that apply the IoT-based solutions to the enterprise level with the aim to ensure the real-time tracking of assets and the improvement of the end-to-end supply chain visibility. For instance, in November 2025, Impinj expanded its Gen2X RAIN RFID platform to support broader enterprise-level applications that can provide real-time item and asset data connection in logistics, retail, and other supply chain processes, which highlights the role of RFID in the passage of IoT-based tracking and visibility in business applications. This enhances accuracy of inventory and minimizes the cycle times making the global supply chain more responsive.
Moreover, the increasing regulatory demand on mandatory traceability at item level, global standards of item identification and compliance-based digital labeling systems in various segments are becoming a major market driver that requires organizations to consider adopting superior Quantum RFID tagging systems in order to increase transparency, certification and operational responsibility at the end-to-end. For instance, in 2025, Tageos opened its Innovation Center of Excellence to meet the changing RFID products requirements and regulatory compliance requirements in the highly regulated industry like healthcare and aviation. This improves the authenticity and safety of products, and it increases market coverage of regulated industries.
Key adjacent opportunities in the global quantum RFID tags market include quantum-secure supply chain solutions, smart logistics and inventory management, contactless payment systems, IoT-enabled asset tracking, and defense/security authentication platforms. The utilization of these adjacent markets will help speed up adoption, diversification in application and revenue opportunities in industries that need high-security RFID solutions.
Quantum RFID Tags Market Dynamics and Trends
Driver: Increasing Integration of Next‑Generation RFID Technologies by Leading Manufacturers
-
The quantum RFID tags market, which has been propelled by the producers of next-generation RFID technologies that go much further than mere identification to provide enterprise-level functionality, enhanced security capabilities, and real-time operational visibility.
- For instance, latest implementation of the Impinj Gen2X chips in its entire RFID inlay and label line, which improves inventory management, makes operations against counterfeiting and offers accurate real-time monitoring of key operations of major retail, logistics and supply chain operations, all over the world by Avery Dennison.
- This advancement reflects a greater industry trend of smart and flexible tagging systems that can be utilized to help support complex supply chains, monitor high-value assets and automate inventory. The incorporation of more sophisticated chip functionality is allowing manufacturers to facilitate predictive analytics, easy harmony with IoT eco-system and greater efficiency in operation.
- These disruptive technologies enhance the accuracy and privacy of data, contributing to a higher adoption rate of the enterprise and expanding the market faster in various high-growth industries.
Restraint: Cost and Complexity of Deploying Quantum‑Ready RFID Solutions at Scale
-
The implementation of quantum-ready and advanced RFID systems are still under major challenges on the basis of high expenses and technicalities related to large deployment. Although other manufacturers like Impinj and NXP Semiconductors are leaders in high-performance Gen2X and post-quantum capable RFID chip development, their high prices restrict accessibility to the mid-sized enterprises and low-cost markets.
- Additionally, the need to upgrade both the infrastructure and software infrastructure to support the implementation of these advanced tags, the implementation of such tags in already deployed legacy systems can often demand significant upgrades of existing infrastructure, including supporting readers, software platforms, and network infrastructure, which further complicates the implementation. The requirement of technical specialization in handling installation, configuration, and maintenance also makes it more of a challenge.
- These economic and operational challenges especially in the emerging markets of restricted financial and infrastructural bases decelerate mass adoption and hinder wide market penetration hence the constrain of growth potential of in the global quantum-ready RFID solutions markets.
Opportunity: Expansion into Adjacent Secure IoT and Asset Tracking Ecosystems
-
The quantum RFID tags market presents a significant opportunity as RFID technologies expand into secure Internet of Things (IoT) and enterprise asset tracking ecosystems, driven by increasing demand for integrated, real-time monitoring and visibility across complex infrastructures.
- The trends indicate that RFID is emerging as a fundamental unit of connected asset systems, which use IoT, analytics, and automation to improve efficiency, minimize losses, and enhance security. As an example, the extended Gen2X platform of Impinj put an emphasis on this trend by improving the performance of RAIN RFID and allowing wider uses in logistics, manufacturing, healthcare, and smart pharmaceutical cabinets, supporting secure IoT-linked tracking and authentication when that is compared to the traditional inventory control.
- The technology, as more and more businesses install RFID as a part of IoT infrastructures, forms the basis of complete tracking systems coupled with cloud-based services, predictive maintenance applications, and ERP solutions, broadening applications and rapidly growing deployments in various high-growth industries.
Key Trend: Shift Toward Eco‑Friendly and Sustainable RFID Materials and Designs
-
The growing number of concerns regarding the sustainability and the use of environmentally friendly materials and manufacturing techniques is one of the major trends defining the quantum RFID tag industry. With the increased restrictions on environmental regulation and corporate social responsibility to the environment, RFID manufacturers have taken more focus on greener solutions that lower the electronic waste without affecting performance or life cycle.
- For instance, several industry leaders announced initiatives to incorporate biodegradable substrates and recycled silicon content into RFID tag production, aiming to lower environmental impact while maintaining reliability and lifecycle performance for enterprise applications. Such innovations are in line with the new regulatory demands of reducing electronic waste and sustainable production of electronics, which is part of the wider trends of industry and corporate responsibility.
- The transition to the green RFID solution will increase the brand image, guarantee the adherence to the regulations, and increase the interest of the environmentally friendly buyers, enlarging the market scope of all industries focused on sustainability and value-creation in the long run.
Quantum-RFID-Tags-Market Analysis and Segmental Data
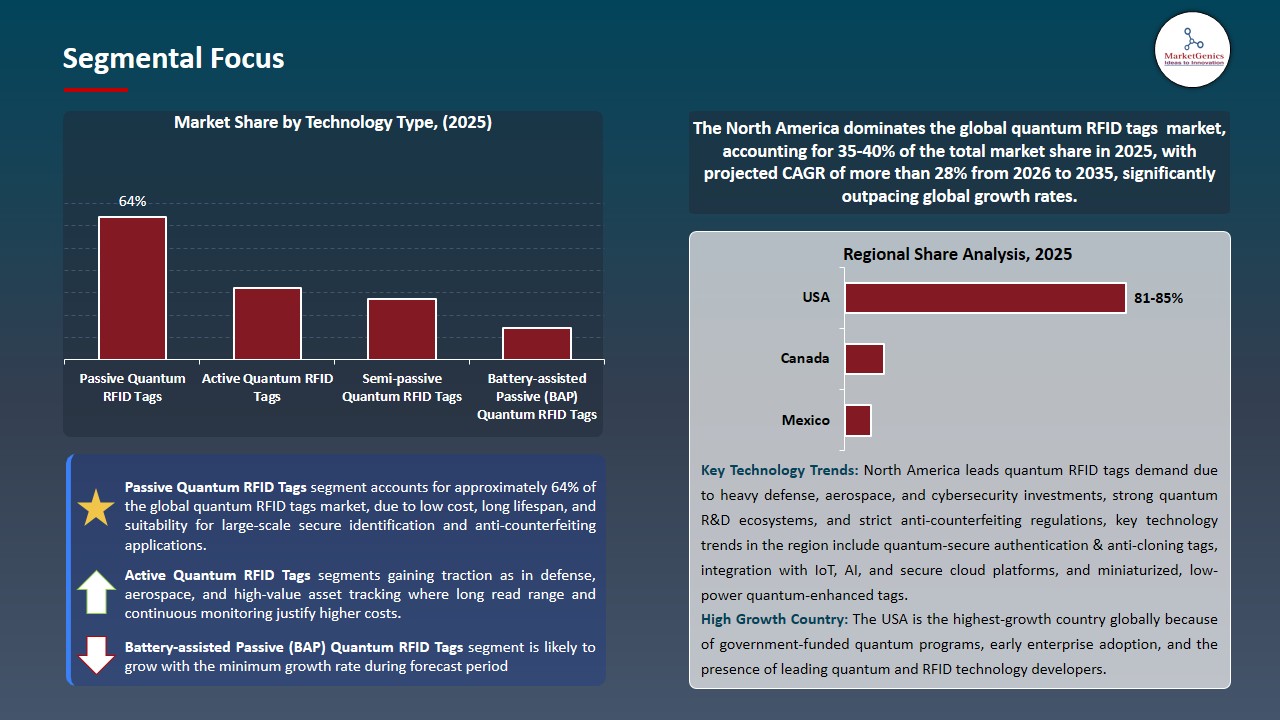
Passive Quantum RFID Tags Dominate Global Quantum RFID Tags Market
-
The quantum RFID tags market continues to be dominated by passive quantum RFID tags, owing to the fact that they are cost-effective, simple and can function in large scale applications. These battery-free tags use reader signals as power sources, meaning that no power is required on the device, and this reduces unit cost and overall cost of ownership by a large margin in comparison to active versions.
- Major manufacturers such as Avery Dennison and Alien Technology have focused on scaling passive UHF RFID tag production optimized for retail inventory, supply chain logistics, and item-level tracking, reinforcing their widespread adoption.
- The widespread adoption of passive RFID solutions has allowed businesses to create large-scale tagging systems, particularly in the apparel and retail sectors, leading to enhanced inventory accuracy and operational efficiency.
- This enduring market preference supports extensive penetration into cost-sensitive and high-volume applications, thereby solidifying the passive RFID strategic position for large-scale enterprise operations.
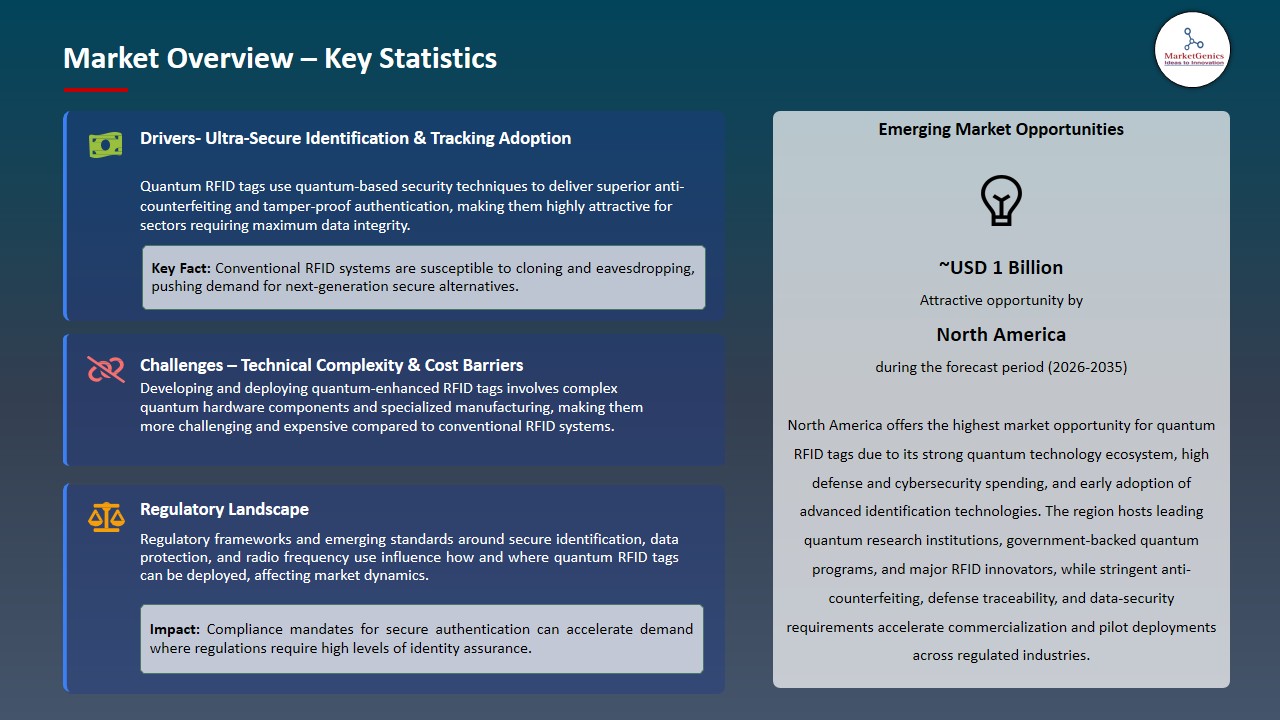
North America Leads Global Quantum RFID Tags Market Demand
-
North America leads the quantum RFID tags market, due to the high rate of adoption of the advanced supply chain and retail management solutions. As an example, in 2024, Avery Dennison created a larger passive and Gen2X RFID inlay portfolio in the U.S. retail and logistics chains to provide real time inventory visibility, anti-counterfeiting and increased operational efficiency. This large-scale implementation increases the efficiency of operations and boosts the technological dominance of North America in the international market of quantum RFID tags.
- Additionally, the leadership in the region is also driven by strategic investments in quantum resilient and RFID secure solutions. For instance, in 2025, NXP Semiconductors introduced RFID chips based on post-quantum cryptography to be used in defense and critical infrastructure, allowing the use of RFID in high-value asset management to protect against identification and authentication. The investments increase the level of security and fuel faster quantum RFID solutions adoption in the North American critical sectors.
- The supply chain's intensive adoption of new technologies and deliberate investment in quantum-resilient RFID solutions will bolster North America's market leadership, promote the spread of quantum RFID tags in business and critical infrastructure, and enhance their security and rapid growth.
Quantum-RFID-Tags-Market Ecosystem
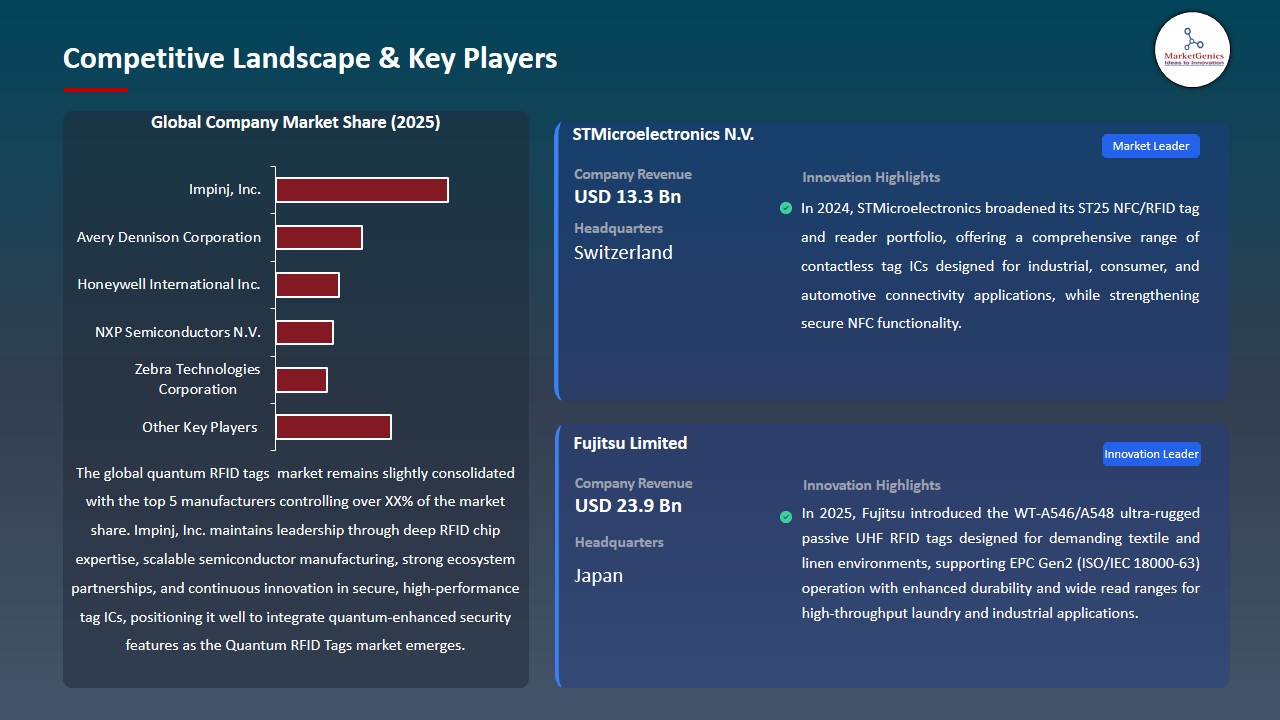
The global quantum RFID tags market is slightly consolidated, with high concentration among key players such as Impinj, Inc., Avery Dennison Corporation, Honeywell International Inc., NXP Semiconductors N.V., and Zebra Technologies Corporation, who dominate through with massive product portfolio, technological advancement, strategic alliance, and international distribution systems, thereby being able to control strong market presence and ability to influence pricing, standards, and adoption of RFID in various sectors. The presence of a large number of players in the market allows market stability, innovation, and the rapid implementation of quantum RFID solutions in the leading sectors of the world market.
Recent Development and Strategic Overview:
-
In September 2025, Nedap has announced the implementation of its cloud-based RFID inventory solutions across more than 450 Kiabi stores, aimed at enhancing omnichannel inventory visibility and ensuring a secure, seamless customer experience.
- In June 2025, Siemens Digital Industries Software extended certification support for advanced semiconductor node processes with Samsung Foundry, indirectly strengthening RFID/IoT chip design capabilities across next‑gen ICs.
Report Scope
|
Detail |
|
|
Market Size in 2025 |
USD 0.17 Bn |
|
Market Forecast Value in 2035 |
USD 1.8 Bn |
|
Growth Rate (CAGR) |
26.3% |
|
Forecast Period |
2026 – 2035 |
|
Historical Data Available for |
2021 – 2024 |
|
Market Size Units |
US$ Billion for Value Thousand Units for Volume |
|
Report Format |
Electronic (PDF) + Excel |
|
North America |
Europe |
Asia Pacific |
Middle East |
Africa |
South America |
|
|
|
|
|
|
|
Companies Covered |
|||||
|
|
|
|
|
|
Quantum-RFID-Tags-Market Segmentation and Highlights
|
Segment |
Sub-segment |
|
Quantum RFID Tags Market, By Technology Type |
|
|
Quantum RFID Tags Market, By Frequency Range |
|
|
Quantum RFID Tags Market, By Rated Power |
|
|
Quantum RFID Tags Market, By Form Factor |
|
|
Quantum RFID Tags Market, By Read Range
|
|
|
Quantum RFID Tags Market, By Material Type
|
|
|
Quantum RFID Tags Market, By End-users |
|
Frequently Asked Questions
Table of Contents
- 1. Research Methodology and Assumptions
- 1.1. Definitions
- 1.2. Research Design and Approach
- 1.3. Data Collection Methods
- 1.4. Base Estimates and Calculations
- 1.5. Forecasting Models
- 1.5.1. Key Forecast Factors & Impact Analysis
- 1.6. Secondary Research
- 1.6.1. Open Sources
- 1.6.2. Paid Databases
- 1.6.3. Associations
- 1.7. Primary Research
- 1.7.1. Primary Sources
- 1.7.2. Primary Interviews with Stakeholders across Ecosystem
- 2. Executive Summary
- 2.1. Global Quantum RFID Tags Market Outlook
- 2.1.1. Quantum RFID Tags Market Size (Volume – Thousand Units and Value – US$ Bn), and Forecasts, 2021-2035
- 2.1.2. Compounded Annual Growth Rate Analysis
- 2.1.3. Growth Opportunity Analysis
- 2.1.4. Segmental Share Analysis
- 2.1.5. Geographical Share Analysis
- 2.2. Market Analysis and Facts
- 2.3. Supply-Demand Analysis
- 2.4. Competitive Benchmarking
- 2.5. Go-to- Market Strategy
- 2.5.1. Customer/ End-use Industry Assessment
- 2.5.2. Growth Opportunity Data, 2026-2035
- 2.5.2.1. Regional Data
- 2.5.2.2. Country Data
- 2.5.2.3. Segmental Data
- 2.5.3. Identification of Potential Market Spaces
- 2.5.4. GAP Analysis
- 2.5.5. Potential Attractive Price Points
- 2.5.6. Prevailing Market Risks & Challenges
- 2.5.7. Preferred Sales & Marketing Strategies
- 2.5.8. Key Recommendations and Analysis
- 2.5.9. A Way Forward
- 2.1. Global Quantum RFID Tags Market Outlook
- 3. Industry Data and Premium Insights
- 3.1. Global Semiconductors & Electronics Industry Overview, 2025
- 3.1.1. Semiconductors & Electronics Ecosystem Analysis
- 3.1.2. Key Trends for Semiconductors & Electronics Industry
- 3.1.3. Regional Distribution for Semiconductors & Electronics Industry
- 3.2. Supplier Customer Data
- 3.3. Technology Roadmap and Developments
- 3.4. Trade Analysis
- 3.4.1. Import & Export Analysis, 2025
- 3.4.2. Top Importing Countries
- 3.4.3. Top Exporting Countries
- 3.5. Trump Tariff Impact Analysis
- 3.5.1. Manufacturer
- 3.5.1.1. Based on the component & Raw material
- 3.5.2. Supply Chain
- 3.5.3. End Consumer
- 3.5.1. Manufacturer
- 3.6. Raw Material Analysis
- 3.1. Global Semiconductors & Electronics Industry Overview, 2025
- 4. Market Overview
- 4.1. Market Dynamics
- 4.1.1. Drivers
- 4.1.1.1. Rising demand for ultra-secure identification and anti-counterfeiting using quantum-enhanced RFID technologies
- 4.1.1.2. Increasing adoption of advanced RFID in high-value sectors such as defense, healthcare, and semiconductor manufacturing
- 4.1.1.3. Growing investment in quantum technologies and next-generation sensing for secure IoT and smart infrastructure
- 4.1.2. Restraints
- 4.1.2.1. High cost and technical complexity of developing and integrating quantum-based RFID systems
- 4.1.2.2. Limited commercialization, standardization, and scalable manufacturing compared to conventional RFID tags
- 4.1.1. Drivers
- 4.2. Key Trend Analysis
- 4.3. Regulatory Framework
- 4.3.1. Key Regulations, Norms, and Subsidies, by Key Countries
- 4.3.2. Tariffs and Standards
- 4.3.3. Impact Analysis of Regulations on the Market
- 4.4. Value Chain Analysis
- 4.4.1. Raw Materials & Component Sourcing
- 4.4.2. Manufacturing & Assembly
- 4.4.3. Distribution & Logistics
- 4.4.4. Marketing & Sales
- 4.4.5. After-Sales Support & Services
- 4.5. Cost Structure Analysis
- 4.5.1. Parameter’s Share for Cost Associated
- 4.5.2. COGP vs COGS
- 4.5.3. Profit Margin Analysis
- 4.6. Pricing Analysis
- 4.6.1. Regional Pricing Analysis
- 4.6.2. Segmental Pricing Trends
- 4.6.3. Factors Influencing Pricing
- 4.7. Porter’s Five Forces Analysis
- 4.8. PESTEL Analysis
- 4.9. Global Quantum RFID Tags Market Demand
- 4.9.1. Historical Market Size – Volume (Thousand Units) and Value (US$ Bn), 2020-2024
- 4.9.2. Current and Future Market Size – Volume (Thousand Units) and Value (US$ Bn), 2026–2035
- 4.9.2.1. Y-o-Y Growth Trends
- 4.9.2.2. Absolute $ Opportunity Assessment
- 4.1. Market Dynamics
- 5. Competition Landscape
- 5.1. Competition structure
- 5.1.1. Fragmented v/s consolidated
- 5.2. Company Share Analysis, 2025
- 5.2.1. Global Company Market Share
- 5.2.2. By Region
- 5.2.2.1. North America
- 5.2.2.2. Europe
- 5.2.2.3. Asia Pacific
- 5.2.2.4. Middle East
- 5.2.2.5. Africa
- 5.2.2.6. South America
- 5.3. Product Comparison Matrix
- 5.3.1. Specifications
- 5.3.2. Market Positioning
- 5.3.3. Pricing
- 5.1. Competition structure
- 6. Global Quantum RFID Tags Market Analysis, by Technology Type
- 6.1. Key Segment Analysis
- 6.2. Quantum RFID Tags Market Size (Volume – Thousand Units and Value – US$ Bn), Analysis, and Forecasts, by Technology Type, 2021-2035
- 6.2.1. Passive Quantum RFID Tags
- 6.2.2. Active Quantum RFID Tags
- 6.2.3. Semi-passive Quantum RFID Tags
- 6.2.4. Battery-assisted Passive (BAP) Quantum RFID Tags
- 7. Global Quantum RFID Tags Market Analysis, by Frequency Range
- 7.1. Key Segment Analysis
- 7.2. Quantum RFID Tags Market Size (Volume – Thousand Units and Value – US$ Bn), Analysis, and Forecasts, by Frequency Range, 2021-2035
- 7.2.1. Low Frequency (LF) - 125-134 kHz
- 7.2.2. High Frequency (HF) - 13.56 MHz
- 7.2.3. Ultra-High Frequency (UHF) - 860-960 MHz
- 7.2.4. Microwave Frequency - 2.45 GHz and above
- 8. Global Quantum RFID Tags Market Analysis, by Rated Power
- 8.1. Key Segment Analysis
- 8.2. Quantum RFID Tags Market Size (Volume – Thousand Units and Value – US$ Bn), Analysis, and Forecasts, by Rated Power, 2021-2035
- 8.2.1. Up to 10 mW
- 8.2.2. 10-100 mW
- 8.2.3. Above 100 mW
- 9. Global Quantum RFID Tags Market Analysis, by Form Factor
- 9.1. Key Segment Analysis
- 9.2. Quantum RFID Tags Market Size (Volume – Thousand Units and Value – US$ Bn), Analysis, and Forecasts, by Form Factor, 2021-2035
- 9.2.1. Label/Sticker Tags
- 9.2.2. Card Tags
- 9.2.3. Key Fob Tags
- 9.2.4. Implantable Tags
- 9.2.5. Hard Tags (Encased)
- 9.2.6. Flexible Tags
- 9.2.7. Wearable Tags
- 9.2.8. Others
- 10. Global Quantum RFID Tags Market Analysis, by Read Range
- 10.1. Key Segment Analysis
- 10.2. Quantum RFID Tags Market Size (Volume – Thousand Units and Value – US$ Bn), Analysis, and Forecasts, by Read Range, 2021-2035
- 10.2.1. Short Range (<1 meter)
- 10.2.2. Medium Range (1-10 meters)
- 10.2.3. Long Range (10-30 meters)
- 10.2.4. Extended Range (>30 meters)
- 11. Global Quantum RFID Tags Market Analysis, by Material Type
- 11.1. Key Segment Analysis
- 11.2. Quantum RFID Tags Market Size (Volume – Thousand Units and Value – US$ Bn), Analysis, and Forecasts, by Material Type, 2021-2035
- 11.2.1. Paper-Based Tags
- 11.2.2. Polymer-Based Tags
- 11.2.3. Ceramic-Based Tags
- 11.2.4. Metal-Mount Tags
- 11.2.5. Hybrid Material Tags
- 12. Global Quantum RFID Tags Market Analysis, by End-users
- 12.1. Key Segment Analysis
- 12.2. Quantum RFID Tags Market Size (Volume – Thousand Units and Value – US$ Bn), Analysis, and Forecasts, by End-users, 2021-2035
- 12.2.1. Healthcare & Pharmaceuticals
- 12.2.2. Retail & Consumer Goods
- 12.2.3. Logistics & Transportation
- 12.2.4. Manufacturing & Industrial
- 12.2.5. Aerospace & Defense
- 12.2.6. Food & Beverages
- 12.2.7. Automotive
- 12.2.8. Government & Public Sector
- 12.2.9. Banking & Financial Services
- 12.2.10. Other End-users
- 13. Global Quantum RFID Tags Market Analysis and Forecasts, by Region
- 13.1. Key Findings
- 13.2. Quantum RFID Tags Market Size (Volume – Thousand Units and Value – US$ Bn), Analysis, and Forecasts, by Region, 2021-2035
- 13.2.1. North America
- 13.2.2. Europe
- 13.2.3. Asia Pacific
- 13.2.4. Middle East
- 13.2.5. Africa
- 13.2.6. South America
- 14. North America Quantum RFID Tags Market Analysis
- 14.1. Key Segment Analysis
- 14.2. Regional Snapshot
- 14.3. North America Quantum RFID Tags Market Size (Volume – Thousand Units and Value – US$ Bn), Analysis, and Forecasts, 2021-2035
- 14.3.1. Technology Type
- 14.3.2. Frequency Range
- 14.3.3. Rated Power
- 14.3.4. Form Factor
- 14.3.5. Read Range
- 14.3.6. Material Type
- 14.3.7. End-users
- 14.3.8. Country
- 14.3.8.1. USA
- 14.3.8.2. Canada
- 14.3.8.3. Mexico
- 14.4. USA Quantum RFID Tags Market
- 14.4.1. Country Segmental Analysis
- 14.4.2. Technology Type
- 14.4.3. Frequency Range
- 14.4.4. Rated Power
- 14.4.5. Form Factor
- 14.4.6. Read Range
- 14.4.7. Material Type
- 14.4.8. End-users
- 14.5. Canada Quantum RFID Tags Market
- 14.5.1. Country Segmental Analysis
- 14.5.2. Technology Type
- 14.5.3. Frequency Range
- 14.5.4. Rated Power
- 14.5.5. Form Factor
- 14.5.6. Read Range
- 14.5.7. Material Type
- 14.5.8. End-users
- 14.6. Mexico Quantum RFID Tags Market
- 14.6.1. Country Segmental Analysis
- 14.6.2. Technology Type
- 14.6.3. Frequency Range
- 14.6.4. Rated Power
- 14.6.5. Form Factor
- 14.6.6. Read Range
- 14.6.7. Material Type
- 14.6.8. End-users
- 15. Europe Quantum RFID Tags Market Analysis
- 15.1. Key Segment Analysis
- 15.2. Regional Snapshot
- 15.3. Europe Quantum RFID Tags Market Size (Volume – Thousand Units and Value – US$ Bn), Analysis, and Forecasts, 2021-2035
- 15.3.1. Technology Type
- 15.3.2. Frequency Range
- 15.3.3. Rated Power
- 15.3.4. Form Factor
- 15.3.5. Read Range
- 15.3.6. Material Type
- 15.3.7. End-users
- 15.3.8. Country
- 15.3.8.1. Germany
- 15.3.8.2. United Kingdom
- 15.3.8.3. France
- 15.3.8.4. Italy
- 15.3.8.5. Spain
- 15.3.8.6. Netherlands
- 15.3.8.7. Nordic Countries
- 15.3.8.8. Poland
- 15.3.8.9. Russia & CIS
- 15.3.8.10. Rest of Europe
- 15.4. Germany Quantum RFID Tags Market
- 15.4.1. Country Segmental Analysis
- 15.4.2. Technology Type
- 15.4.3. Frequency Range
- 15.4.4. Rated Power
- 15.4.5. Form Factor
- 15.4.6. Read Range
- 15.4.7. Material Type
- 15.4.8. End-users
- 15.5. United Kingdom Quantum RFID Tags Market
- 15.5.1. Country Segmental Analysis
- 15.5.2. Technology Type
- 15.5.3. Frequency Range
- 15.5.4. Rated Power
- 15.5.5. Form Factor
- 15.5.6. Read Range
- 15.5.7. Material Type
- 15.5.8. End-users
- 15.6. France Quantum RFID Tags Market
- 15.6.1. Country Segmental Analysis
- 15.6.2. Technology Type
- 15.6.3. Frequency Range
- 15.6.4. Rated Power
- 15.6.5. Form Factor
- 15.6.6. Read Range
- 15.6.7. Material Type
- 15.6.8. End-users
- 15.7. Italy Quantum RFID Tags Market
- 15.7.1. Country Segmental Analysis
- 15.7.2. Technology Type
- 15.7.3. Frequency Range
- 15.7.4. Rated Power
- 15.7.5. Form Factor
- 15.7.6. Read Range
- 15.7.7. Material Type
- 15.7.8. End-users
- 15.8. Spain Quantum RFID Tags Market
- 15.8.1. Country Segmental Analysis
- 15.8.2. Technology Type
- 15.8.3. Frequency Range
- 15.8.4. Rated Power
- 15.8.5. Form Factor
- 15.8.6. Read Range
- 15.8.7. Material Type
- 15.8.8. End-users
- 15.9. Netherlands Quantum RFID Tags Market
- 15.9.1. Country Segmental Analysis
- 15.9.2. Technology Type
- 15.9.3. Frequency Range
- 15.9.4. Rated Power
- 15.9.5. Form Factor
- 15.9.6. Read Range
- 15.9.7. Material Type
- 15.9.8. End-users
- 15.10. Nordic Countries Quantum RFID Tags Market
- 15.10.1. Country Segmental Analysis
- 15.10.2. Technology Type
- 15.10.3. Frequency Range
- 15.10.4. Rated Power
- 15.10.5. Form Factor
- 15.10.6. Read Range
- 15.10.7. Material Type
- 15.10.8. End-users
- 15.11. Poland Quantum RFID Tags Market
- 15.11.1. Country Segmental Analysis
- 15.11.2. Technology Type
- 15.11.3. Frequency Range
- 15.11.4. Rated Power
- 15.11.5. Form Factor
- 15.11.6. Read Range
- 15.11.7. Material Type
- 15.11.8. End-users
- 15.12. Russia & CIS Quantum RFID Tags Market
- 15.12.1. Country Segmental Analysis
- 15.12.2. Technology Type
- 15.12.3. Frequency Range
- 15.12.4. Rated Power
- 15.12.5. Form Factor
- 15.12.6. Read Range
- 15.12.7. Material Type
- 15.12.8. End-users
- 15.13. Rest of Europe Quantum RFID Tags Market
- 15.13.1. Country Segmental Analysis
- 15.13.2. Technology Type
- 15.13.3. Frequency Range
- 15.13.4. Rated Power
- 15.13.5. Form Factor
- 15.13.6. Read Range
- 15.13.7. Material Type
- 15.13.8. End-users
- 16. Asia Pacific Quantum RFID Tags Market Analysis
- 16.1. Key Segment Analysis
- 16.2. Regional Snapshot
- 16.3. Asia Pacific Quantum RFID Tags Market Size (Volume – Thousand Units and Value – US$ Bn), Analysis, and Forecasts, 2021-2035
- 16.3.1. Technology Type
- 16.3.2. Frequency Range
- 16.3.3. Rated Power
- 16.3.4. Form Factor
- 16.3.5. Read Range
- 16.3.6. Material Type
- 16.3.7. End-users
- 16.3.8. Country
- 16.3.8.1. China
- 16.3.8.2. India
- 16.3.8.3. Japan
- 16.3.8.4. South Korea
- 16.3.8.5. Australia and New Zealand
- 16.3.8.6. Indonesia
- 16.3.8.7. Malaysia
- 16.3.8.8. Thailand
- 16.3.8.9. Vietnam
- 16.3.8.10. Rest of Asia Pacific
- 16.4. China Quantum RFID Tags Market
- 16.4.1. Country Segmental Analysis
- 16.4.2. Technology Type
- 16.4.3. Frequency Range
- 16.4.4. Rated Power
- 16.4.5. Form Factor
- 16.4.6. Read Range
- 16.4.7. Material Type
- 16.4.8. End-users
- 16.5. India Quantum RFID Tags Market
- 16.5.1. Country Segmental Analysis
- 16.5.2. Technology Type
- 16.5.3. Frequency Range
- 16.5.4. Rated Power
- 16.5.5. Form Factor
- 16.5.6. Read Range
- 16.5.7. Material Type
- 16.5.8. End-users
- 16.6. Japan Quantum RFID Tags Market
- 16.6.1. Country Segmental Analysis
- 16.6.2. Technology Type
- 16.6.3. Frequency Range
- 16.6.4. Rated Power
- 16.6.5. Form Factor
- 16.6.6. Read Range
- 16.6.7. Material Type
- 16.6.8. End-users
- 16.7. South Korea Quantum RFID Tags Market
- 16.7.1. Country Segmental Analysis
- 16.7.2. Technology Type
- 16.7.3. Frequency Range
- 16.7.4. Rated Power
- 16.7.5. Form Factor
- 16.7.6. Read Range
- 16.7.7. Material Type
- 16.7.8. End-users
- 16.8. Australia and New Zealand Quantum RFID Tags Market
- 16.8.1. Country Segmental Analysis
- 16.8.2. Technology Type
- 16.8.3. Frequency Range
- 16.8.4. Rated Power
- 16.8.5. Form Factor
- 16.8.6. Read Range
- 16.8.7. Material Type
- 16.8.8. End-users
- 16.9. Indonesia Quantum RFID Tags Market
- 16.9.1. Country Segmental Analysis
- 16.9.2. Technology Type
- 16.9.3. Frequency Range
- 16.9.4. Rated Power
- 16.9.5. Form Factor
- 16.9.6. Read Range
- 16.9.7. Material Type
- 16.9.8. End-users
- 16.10. Malaysia Quantum RFID Tags Market
- 16.10.1. Country Segmental Analysis
- 16.10.2. Technology Type
- 16.10.3. Frequency Range
- 16.10.4. Rated Power
- 16.10.5. Form Factor
- 16.10.6. Read Range
- 16.10.7. Material Type
- 16.10.8. End-users
- 16.11. Thailand Quantum RFID Tags Market
- 16.11.1. Country Segmental Analysis
- 16.11.2. Technology Type
- 16.11.3. Frequency Range
- 16.11.4. Rated Power
- 16.11.5. Form Factor
- 16.11.6. Read Range
- 16.11.7. Material Type
- 16.11.8. End-users
- 16.12. Vietnam Quantum RFID Tags Market
- 16.12.1. Country Segmental Analysis
- 16.12.2. Technology Type
- 16.12.3. Frequency Range
- 16.12.4. Rated Power
- 16.12.5. Form Factor
- 16.12.6. Read Range
- 16.12.7. Material Type
- 16.12.8. End-users
- 16.13. Rest of Asia Pacific Quantum RFID Tags Market
- 16.13.1. Country Segmental Analysis
- 16.13.2. Technology Type
- 16.13.3. Frequency Range
- 16.13.4. Rated Power
- 16.13.5. Form Factor
- 16.13.6. Read Range
- 16.13.7. Material Type
- 16.13.8. End-users
- 17. Middle East Quantum RFID Tags Market Analysis
- 17.1. Key Segment Analysis
- 17.2. Regional Snapshot
- 17.3. Middle East Quantum RFID Tags Market Size (Volume – Thousand Units and Value – US$ Bn), Analysis, and Forecasts, 2021-2035
- 17.3.1. Technology Type
- 17.3.2. Frequency Range
- 17.3.3. Rated Power
- 17.3.4. Form Factor
- 17.3.5. Read Range
- 17.3.6. Material Type
- 17.3.7. End-users
- 17.3.8. Country
- 17.3.8.1. Turkey
- 17.3.8.2. UAE
- 17.3.8.3. Saudi Arabia
- 17.3.8.4. Israel
- 17.3.8.5. Rest of Middle East
- 17.4. Turkey Quantum RFID Tags Market
- 17.4.1. Country Segmental Analysis
- 17.4.2. Technology Type
- 17.4.3. Frequency Range
- 17.4.4. Rated Power
- 17.4.5. Form Factor
- 17.4.6. Read Range
- 17.4.7. Material Type
- 17.4.8. End-users
- 17.5. UAE Quantum RFID Tags Market
- 17.5.1. Country Segmental Analysis
- 17.5.2. Technology Type
- 17.5.3. Frequency Range
- 17.5.4. Rated Power
- 17.5.5. Form Factor
- 17.5.6. Read Range
- 17.5.7. Material Type
- 17.5.8. End-users
- 17.6. Saudi Arabia Quantum RFID Tags Market
- 17.6.1. Country Segmental Analysis
- 17.6.2. Technology Type
- 17.6.3. Frequency Range
- 17.6.4. Rated Power
- 17.6.5. Form Factor
- 17.6.6. Read Range
- 17.6.7. Material Type
- 17.6.8. End-users
- 17.7. Israel Quantum RFID Tags Market
- 17.7.1. Country Segmental Analysis
- 17.7.2. Technology Type
- 17.7.3. Frequency Range
- 17.7.4. Rated Power
- 17.7.5. Form Factor
- 17.7.6. Read Range
- 17.7.7. Material Type
- 17.7.8. End-users
- 17.8. Rest of Middle East Quantum RFID Tags Market
- 17.8.1. Country Segmental Analysis
- 17.8.2. Technology Type
- 17.8.3. Frequency Range
- 17.8.4. Rated Power
- 17.8.5. Form Factor
- 17.8.6. Read Range
- 17.8.7. Material Type
- 17.8.8. End-users
- 18. Africa Quantum RFID Tags Market Analysis
- 18.1. Key Segment Analysis
- 18.2. Regional Snapshot
- 18.3. Africa Quantum RFID Tags Market Size (Volume – Thousand Units and Value – US$ Bn), Analysis, and Forecasts, 2021-2035
- 18.3.1. Technology Type
- 18.3.2. Frequency Range
- 18.3.3. Rated Power
- 18.3.4. Form Factor
- 18.3.5. Read Range
- 18.3.6. Material Type
- 18.3.7. End-users
- 18.3.8. Country
- 18.3.8.1. South Africa
- 18.3.8.2. Egypt
- 18.3.8.3. Nigeria
- 18.3.8.4. Algeria
- 18.3.8.5. Rest of Africa
- 18.4. South Africa Quantum RFID Tags Market
- 18.4.1. Country Segmental Analysis
- 18.4.2. Technology Type
- 18.4.3. Frequency Range
- 18.4.4. Rated Power
- 18.4.5. Form Factor
- 18.4.6. Read Range
- 18.4.7. Material Type
- 18.4.8. End-users
- 18.5. Egypt Quantum RFID Tags Market
- 18.5.1. Country Segmental Analysis
- 18.5.2. Technology Type
- 18.5.3. Frequency Range
- 18.5.4. Rated Power
- 18.5.5. Form Factor
- 18.5.6. Read Range
- 18.5.7. Material Type
- 18.5.8. End-users
- 18.6. Nigeria Quantum RFID Tags Market
- 18.6.1. Country Segmental Analysis
- 18.6.2. Technology Type
- 18.6.3. Frequency Range
- 18.6.4. Rated Power
- 18.6.5. Form Factor
- 18.6.6. Read Range
- 18.6.7. Material Type
- 18.6.8. End-users
- 18.7. Algeria Quantum RFID Tags Market
- 18.7.1. Country Segmental Analysis
- 18.7.2. Technology Type
- 18.7.3. Frequency Range
- 18.7.4. Rated Power
- 18.7.5. Form Factor
- 18.7.6. Read Range
- 18.7.7. Material Type
- 18.7.8. End-users
- 18.8. Rest of Africa Quantum RFID Tags Market
- 18.8.1. Country Segmental Analysis
- 18.8.2. Technology Type
- 18.8.3. Frequency Range
- 18.8.4. Rated Power
- 18.8.5. Form Factor
- 18.8.6. Read Range
- 18.8.7. Material Type
- 18.8.8. End-users
- 19. South America Quantum RFID Tags Market Analysis
- 19.1. Key Segment Analysis
- 19.2. Regional Snapshot
- 19.3. South America Quantum RFID Tags Market Size (Volume – Thousand Units and Value – US$ Bn), Analysis, and Forecasts, 2021-2035
- 19.3.1. Technology Type
- 19.3.2. Frequency Range
- 19.3.3. Rated Power
- 19.3.4. Form Factor
- 19.3.5. Read Range
- 19.3.6. Material Type
- 19.3.7. End-users
- 19.3.8. Country
- 19.3.8.1. Brazil
- 19.3.8.2. Argentina
- 19.3.8.3. Rest of South America
- 19.4. Brazil Quantum RFID Tags Market
- 19.4.1. Country Segmental Analysis
- 19.4.2. Technology Type
- 19.4.3. Frequency Range
- 19.4.4. Rated Power
- 19.4.5. Form Factor
- 19.4.6. Read Range
- 19.4.7. Material Type
- 19.4.8. End-users
- 19.5. Argentina Quantum RFID Tags Market
- 19.5.1. Country Segmental Analysis
- 19.5.2. Technology Type
- 19.5.3. Frequency Range
- 19.5.4. Rated Power
- 19.5.5. Form Factor
- 19.5.6. Read Range
- 19.5.7. Material Type
- 19.5.8. End-users
- 19.6. Rest of South America Quantum RFID Tags Market
- 19.6.1. Country Segmental Analysis
- 19.6.2. Technology Type
- 19.6.3. Frequency Range
- 19.6.4. Rated Power
- 19.6.5. Form Factor
- 19.6.6. Read Range
- 19.6.7. Material Type
- 19.6.8. End-users
- 20. Key Players/ Company Profile
- 20.1. Avery Dennison Corporation
- 20.1.1. Company Details/ Overview
- 20.1.2. Company Financials
- 20.1.3. Key Customers and Competitors
- 20.1.4. Business/ Industry Portfolio
- 20.1.5. Product Portfolio/ Specification Details
- 20.1.6. Pricing Data
- 20.1.7. Strategic Overview
- 20.1.8. Recent Developments
- 20.2. CAEN RFID S.r.l.
- 20.3. CoreRFID Ltd.
- 20.4. FEIG Electronics GmbH
- 20.5. Fujitsu Limited
- 20.6. GAO RFID Inc.
- 20.7. Honeywell International Inc.
- 20.8. Impinj Inc.
- 20.9. Nedap N.V.
- 20.10. NXP Semiconductors N.V.
- 20.11. Omni-ID Ltd.
- 20.12. Rohde & Schwarz GmbH & Co KG
- 20.13. Samsung Electronics Co. Ltd.
- 20.14. Siemens AG
- 20.15. Smartrac N.V.
- 20.16. STMicroelectronics N.V.
- 20.17. Technology Solutions (UK) Ltd.
- 20.18. Texas Instruments Incorporated
- 20.19. Times-7 Research Ltd.
- 20.20. Other Key Players
- 20.1. Avery Dennison Corporation
Note* - This is just tentative list of players. While providing the report, we will cover more number of players based on their revenue and share for each geography
Research Design
Our research design integrates both demand-side and supply-side analysis through a balanced combination of primary and secondary research methodologies. By utilizing both bottom-up and top-down approaches alongside rigorous data triangulation methods, we deliver robust market intelligence that supports strategic decision-making.
MarketGenics' comprehensive research design framework ensures the delivery of accurate, reliable, and actionable market intelligence. Through the integration of multiple research approaches, rigorous validation processes, and expert analysis, we provide our clients with the insights needed to make informed strategic decisions and capitalize on market opportunities.

MarketGenics leverages a dedicated industry panel of experts and a comprehensive suite of paid databases to effectively collect, consolidate, and analyze market intelligence.
Our approach has consistently proven to be reliable and effective in generating accurate market insights, identifying key industry trends, and uncovering emerging business opportunities.
Through both primary and secondary research, we capture and analyze critical company-level data such as manufacturing footprints, including technical centers, R&D facilities, sales offices, and headquarters.
Our expert panel further enhances our ability to estimate market size for specific brands based on validated field-level intelligence.
Our data mining techniques incorporate both parametric and non-parametric methods, allowing for structured data collection, sorting, processing, and cleaning.
Demand projections are derived from large-scale data sets analyzed through proprietary algorithms, culminating in robust and reliable market sizing.
Research Approach
The bottom-up approach builds market estimates by starting with the smallest addressable market units and systematically aggregating them to create comprehensive market size projections.
This method begins with specific, granular data points and builds upward to create the complete market landscape.
Customer Analysis → Segmental Analysis → Geographical Analysis
The top-down approach starts with the broadest possible market data and systematically narrows it down through a series of filters and assumptions to arrive at specific market segments or opportunities.
This method begins with the big picture and works downward to increasingly specific market slices.
TAM → SAM → SOM


Research Methods
Desk / Secondary Research
While analysing the market, we extensively study secondary sources, directories, and databases to identify and collect information useful for this technical, market-oriented, and commercial report. Secondary sources that we utilize are not only the public sources, but it is a combination of Open Source, Associations, Paid Databases, MG Repository & Knowledgebase, and others.
- Company websites, annual reports, financial reports, broker reports, and investor presentations
- National government documents, statistical databases and reports
- News articles, press releases and web-casts specific to the companies operating in the market, Magazines, reports, and others
- We gather information from commercial data sources for deriving company specific data such as segmental revenue, share for geography, product revenue, and others
- Internal and external proprietary databases (industry-specific), relevant patent, and regulatory databases
- Governing Bodies, Government Organizations
- Relevant Authorities, Country-specific Associations for Industries
We also employ the model mapping approach to estimate the product level market data through the players' product portfolio
Primary Research
Primary research/ interviews is vital in analyzing the market. Most of the cases involves paid primary interviews. Primary sources include primary interviews through e-mail interactions, telephonic interviews, surveys as well as face-to-face interviews with the different stakeholders across the value chain including several industry experts.
| Type of Respondents | Number of Primaries |
|---|---|
| Tier 2/3 Suppliers | ~20 |
| Tier 1 Suppliers | ~25 |
| End-users | ~25 |
| Industry Expert/ Panel/ Consultant | ~30 |
| Total | ~100 |
MG Knowledgebase
• Repository of industry blog, newsletter and case studies
• Online platform covering detailed market reports, and company profiles
Forecasting Factors and Models
Forecasting Factors
- Historical Trends – Past market patterns, cycles, and major events that shaped how markets behave over time. Understanding past trends helps predict future behavior.
- Industry Factors – Specific characteristics of the industry like structure, regulations, and innovation cycles that affect market dynamics.
- Macroeconomic Factors – Economic conditions like GDP growth, inflation, and employment rates that affect how much money people have to spend.
- Demographic Factors – Population characteristics like age, income, and location that determine who can buy your product.
- Technology Factors – How quickly people adopt new technology and how much technology infrastructure exists.
- Regulatory Factors – Government rules, laws, and policies that can help or restrict market growth.
- Competitive Factors – Analyzing competition structure such as degree of competition and bargaining power of buyers and suppliers.
Forecasting Models / Techniques
Multiple Regression Analysis
- Identify and quantify factors that drive market changes
- Statistical modeling to establish relationships between market drivers and outcomes
Time Series Analysis – Seasonal Patterns
- Understand regular cyclical patterns in market demand
- Advanced statistical techniques to separate trend, seasonal, and irregular components
Time Series Analysis – Trend Analysis
- Identify underlying market growth patterns and momentum
- Statistical analysis of historical data to project future trends
Expert Opinion – Expert Interviews
- Gather deep industry insights and contextual understanding
- In-depth interviews with key industry stakeholders
Multi-Scenario Development
- Prepare for uncertainty by modeling different possible futures
- Creating optimistic, pessimistic, and most likely scenarios
Time Series Analysis – Moving Averages
- Sophisticated forecasting for complex time series data
- Auto-regressive integrated moving average models with seasonal components
Econometric Models
- Apply economic theory to market forecasting
- Sophisticated economic models that account for market interactions
Expert Opinion – Delphi Method
- Harness collective wisdom of industry experts
- Structured, multi-round expert consultation process
Monte Carlo Simulation
- Quantify uncertainty and probability distributions
- Thousands of simulations with varying input parameters
Research Analysis
Our research framework is built upon the fundamental principle of validating market intelligence from both demand and supply perspectives. This dual-sided approach ensures comprehensive market understanding and reduces the risk of single-source bias.
Demand-Side Analysis: We understand end-user/application behavior, preferences, and market needs along with the penetration of the product for specific application.
Supply-Side Analysis: We estimate overall market revenue, analyze the segmental share along with industry capacity, competitive landscape, and market structure.
Validation & Evaluation
Data triangulation is a validation technique that uses multiple methods, sources, or perspectives to examine the same research question, thereby increasing the credibility and reliability of research findings. In market research, triangulation serves as a quality assurance mechanism that helps identify and minimize bias, validate assumptions, and ensure accuracy in market estimates.
- Data Source Triangulation – Using multiple data sources to examine the same phenomenon
- Methodological Triangulation – Using multiple research methods to study the same research question
- Investigator Triangulation – Using multiple researchers or analysts to examine the same data
- Theoretical Triangulation – Using multiple theoretical perspectives to interpret the same data

Custom Market Research Services
We will customise the research for you, in case the report listed above does not meet your requirements.
Get 10% Free Customisation