Server Market Size, Share & Trends Analysis Report by Server Type (Rack Servers, Blade Servers, Tower Servers, Micro Servers, Mission-Critical Servers, Mainframe Servers), Operating System, Processor Type, Enterprise Size, Deployment Model, Virtualization, Storage Capacity, Form Factor, Workload Type, End-Use Industry, Sales Channel, and Geography (North America, Europe, Asia Pacific, Middle East, Africa, and South America) – Global Industry Data, Trends, and Forecasts, 2026–2035
Market Overview:
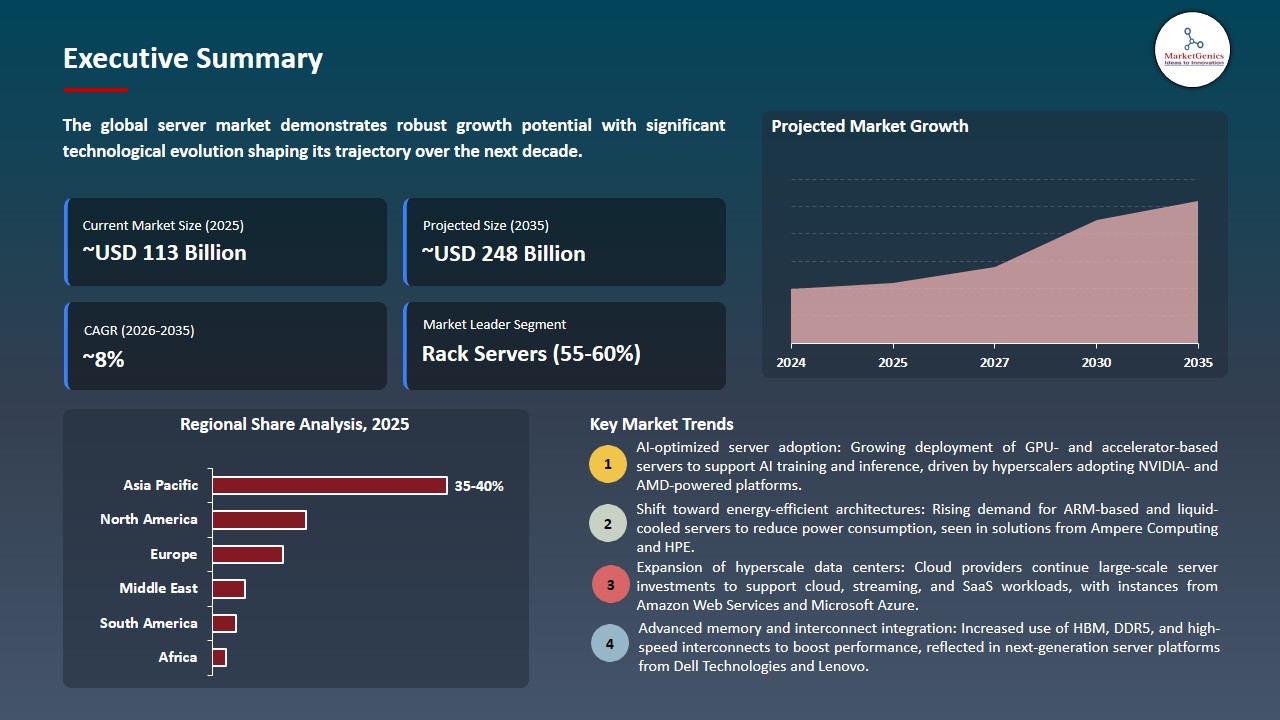
As per MarketGenics, the global Server Market is projected to grow from USD 112.6 billion in 2025 to USD 247.6 billion by 2035, expanding at a CAGR of 8.2% during the forecast period.
|
|
|
Segmental Data Insights |
|
|
Demand Trends |
|
|
Competitive Landscape |
|
|
Strategic Development |
|
|
Future Outlook & Opportunities |
|
Server Market Size, Share, and Growth
High-performance optimized presence of compute architectures and low-energy consumption multi-core processors in the global server market Size are being experienced to provide quantifiable benefits in processing speed, throughput and latency reduction.
Mohammad Alrehaili, Managing Director for Middle East, HPE, said: We’re delighted to celebrate this major milestone together with our partners AMD and alfanar as we further expand our portfolio of ‘Saudi Made’ servers. We’ve seen an unprecedented demand for robust digital infrastructure and compute capabilities in the Middle East, driven by key strategic investments and frameworks such as Saudi Vision 2030 and technological advancements like AI. This new server offering, leveraging the latest AMD EPYC processors, directly addresses this demand, delivering predictable high performance at scale while helping ensure rock-solid data security at every level.
The growing need of extreme bandwidth, small sizes, and energy-efficient data transfer in AI, HPC, and cloud applications, server is rapidly turning into a performance-based and premium memory technology of the compute infrastructure. As the industry moves towards the use of massive parallelism in compute architectures, HBM is making its way to be indispensable to sustain throughput in systems using GPUs and accelerators that are present in hyperscale data centers, high-end analytics systems and scientific applications.
New approaches to wafer-level stacking and complex packaging and 2.5D/3D integration are enabling increased scalability and manufacturability of next-generation server components, keeping them in step with the newest logic nodes. For instance, in August 2025, is the adoption of the RTX CAM, where NVIDIA RTX is used by enterprises like Disney, Foxconn, Hyundai, Lilly, and SAP to run AI reasoning and business workloads through the use of Blackwell based architectures, which have been put into reality and utilized in practice.
The server market is becoming a highly valued, innovation-based market segment, with good ecosystem partnerships, barrier to entry, and strategic long-term importance. In August 2025 ,HPE added to its Saudi Made server offering with new HPE ProLiant DL365 and DL385 Gen11 servers with 5 th Gen AMD EPYC processors, announced at the alfanar plant in Riyadh to improve data analytics, operational flexibility, and regional infrastructure. The technology of servers is currently regarded as a key facilitator of the next-generation digital infrastructure on the global scale.
Server Market Dynamics and Trends
Driver: Rapid Growth of E‑Commerce and Consumer Demand for Fast Delivery
-
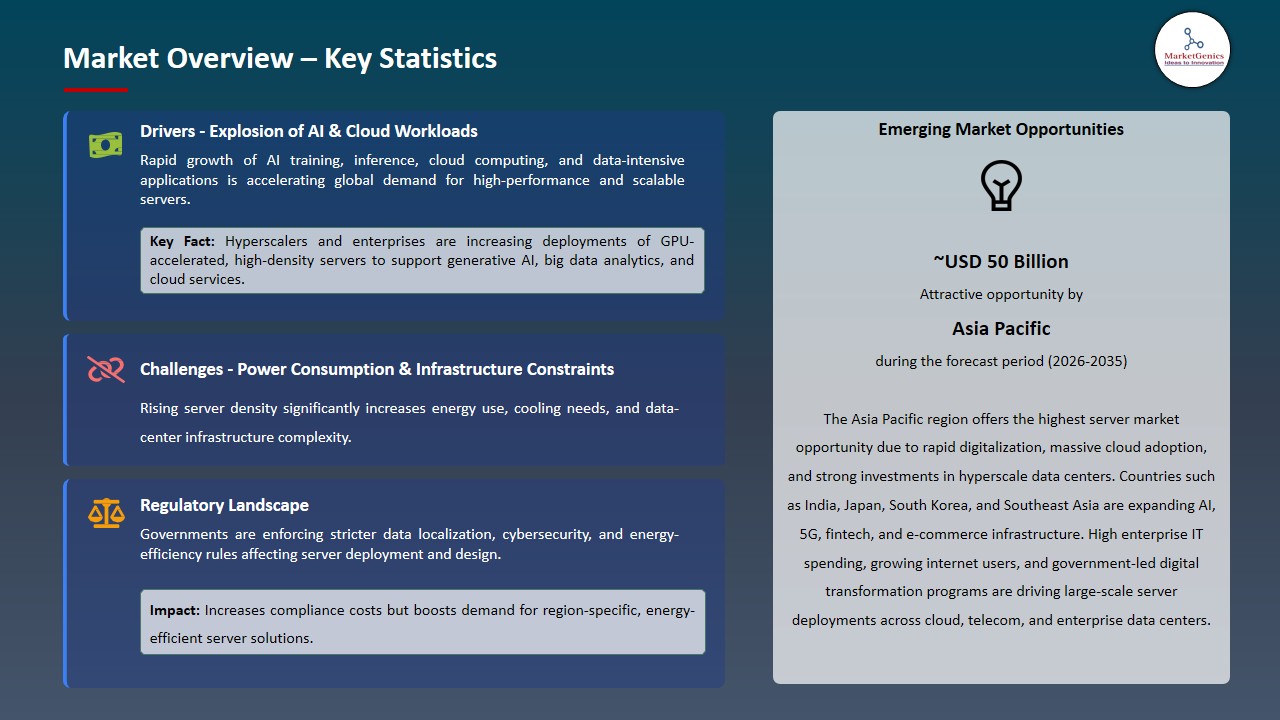
A growing number of e-commerce companies, artificial intelligence-based order fulfillment, and high-performance logistics businesses are driving the global server market, in which low-latency, high-throughput, and scalable compute resources are essential to support quick delivery and real-time inventory management.
- Technology makers and server vendors are also developing AI-capable, high-density server solutions to be able to balance processing, storage, and network needs to be able to integrate easily with cloud solutions, warehouse management systems, and last-mile delivery solutions. For instance, in May 2025, Shiprocket became the first enterprise in India to deploy an AI-based MCP server to facilitate autonomous e-commerce activities and optimize fulfillment operations, which represents the implementation of high-end server solutions that can help companies improve the work of their delivery.
- This is because the expansion of cloud platforms, autonomous systems, and real-time analytics is reinforcing the status of high-performance servers as a core enabler of current e-commerce, logistics and customer satisfaction.
Restraint: Rising Operational Costs and Infrastructure Challenges
-
The expensive nature of capital and complexity of operation of the modern server deployment remains a limiting factor of market growth. State-of-the-art rack level servers, AI optimized accelerators, and liquid-cooled HPC systems will be costly in terms of energy-efficient power distribution, high precision cooling, and space-efficient infrastructure.
- Long research and development times, multi-level integration of CPUs, GPUs, and memory modules, as well as compliance with high reliability and uptime levels raise the cost of design and deployment. Minor automation of server assembly, reliance on specialized plants and facilities, and lack of experienced data center engineers are even further increasing the cost of operations, and are impediments to new market entrants.
- Continuing expenses of testing, certification, and life cycle maintenance limit its adoption in cost sensitive segments delaying universal deployment of high-performance server’s worldwide.
Opportunity: Integration of Automation, AI, and Sustainability Solutions
-
The increased need of high-speed, energy-efficient servers is fueling the prospects of automated, artificial intelligence, and sustainable solution integration into cloud, high-performance computing, and enterprise computing infrastructure. Mission-critical applications affinity Hyperscalers, telecom operators, and cloud providers will be able to use AI-optimized servers to deliver ultra-low latency, high bandwidth, and less power consumption.
- These are being built into the next generation AI accelerators, networking systems and high-performance computing clusters. For instance, in May 2025, an integrated server and rack-level AI platform developed by MiTAC Computing released at COMPUTEX 2025 with features such as advanced liquid-cooling, with GPU resource management and real-time data mobility, and positioning innovation in sustainable, high-performance server infrastructure in data centers with cloud and AI applications.
- The implementation of AI, sustainable, and automated server solutions will make it possible to achieve increased efficiency in operations, decreased energy expenses, and scalable deployment, promoting the overall growth of the server market over the long term and increasing the global reach of the server market.
Key Trend: Expansion of Smart Parcel Locker Networks and Self‑Service Solutions
-
The global server market is turning towards modular, scalable, and interoperable server architectures that dissolve the seamless integration across AI, cloud, and high-performance computing platforms to ensure consistent performance and less complex deployment.
- Recent trends focus on high-density compute, environmentally friendly cooling, and AI-friendly setups. For instance, in February 2025, Eviden will introduce its next-generation BullSequana SH enterprise servers with up to 1.5 times performance and 1.7 times memory bandwidth enhancements to AI and key business applications, and Direct Liquid Cooling (DLC) to lower power usage and rack density.
- This modularity, sustainability, and high-performance infrastructure is set to result in mass deployments of next-generation servers in cloud, edge and enterprise settings across the globe.
Server Market Analysis and Segmental Data
Rack Servers Dominate Global Server Market
-
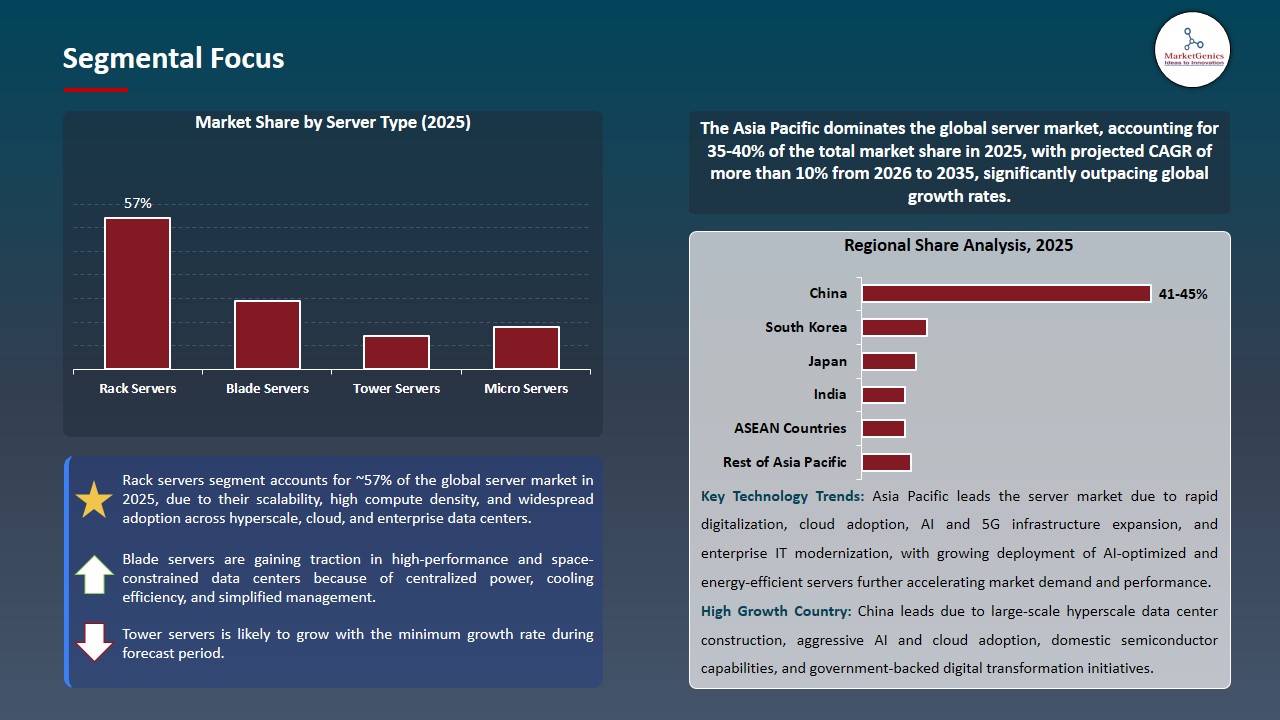
Rack servers leads the server market because of the dense format, modularity, and the capability of supporting AI, high-performance computing (HPC) and cloud loads at the power-efficient performance and latency of work at the hyperscale and enterprise data centers.
- Other technologies that have led to market growth are liquid cooling, high performance integration of graphics cards, and modular server chassis with flexibility in deployment. For instance, in June 2025, HPE and NVIDIA deepened their strategic partnership to provide next-generation AI compute infrastructure, turnkey AI factory solutions and AI-optimized ProLiant rack servers based on NVIDIA accelerated computing, to scale the number of deployable AI workloads in enterprise and hyperscale environments.
- Rack servers have stayed dominant because of their importance in cloud, enterprise, and AI workloads and increased usage in the new markets.
Asia Pacific Leads Global Server Market Demand
-
Asia Pacific is dominating the server market with increasing count of hyperscale servers and regional cloud data centers, speedy deployment of AI and HPC frameworks, and the growing digitization of enterprises in China, Japan, South Korea, India, and Southeast Asia, growing demand on high-density, energy-efficient, and AI-optimized servers is supporting increasingly data-intensive workloads.
- The regional development is getting stronger due to the strong server ecosystem partnership. For instance, in April 2025, Fujitsu broadened its strategic partnership with Super Micro Computer, Inc. to introduce the PRIMERGY GX2570 M8s AI-optimized server and integrated use of GPUs in the form of an entire platform with full management and support offerings, to advance generative AI and high-performance computing infrastructure in Asia Pacific.
- Strong manufacturing foundation, government-supported digitalization programs and continuing cloud and AI investments have solidified the dominance of Asia Pacific in the global Server market demand.
Server Market Ecosystem
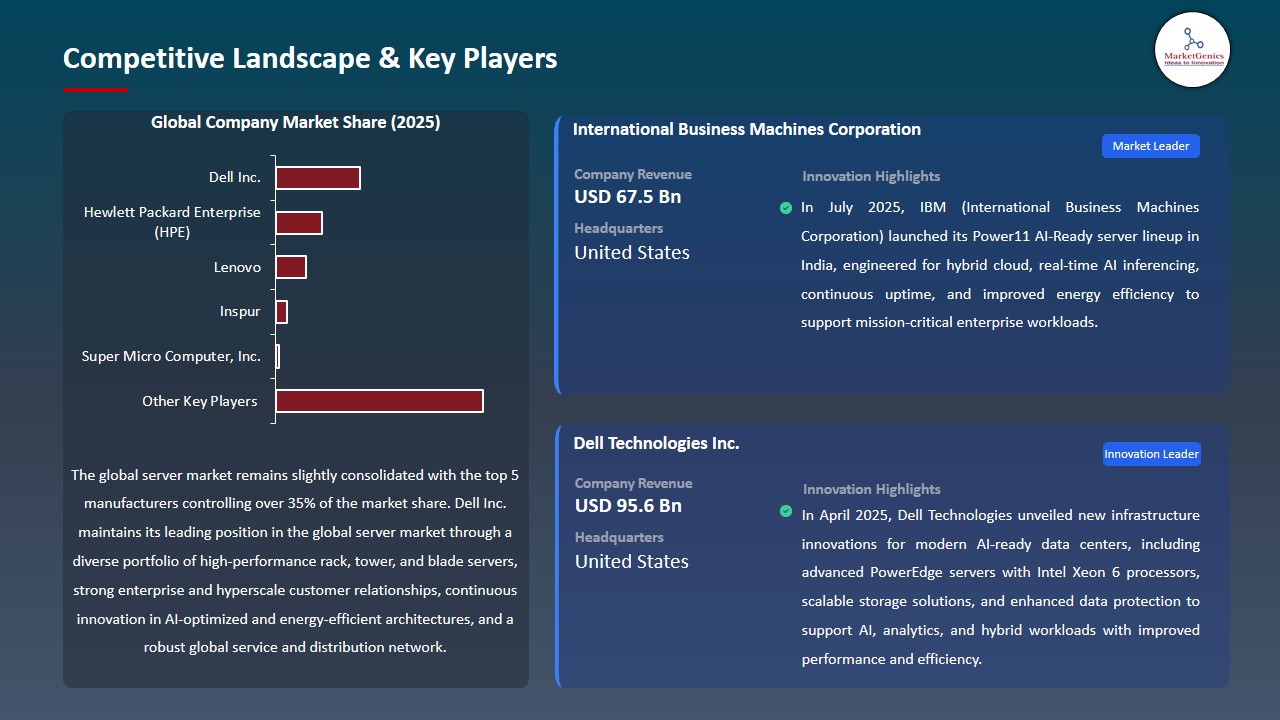
The global server market is moderately consolidated with the existence of Tier-1 multinational original equipment manufacturers (OEMs) that possess robust R&D capabilities, have control over their supply-chain, and have expansive worldwide clientele. Market concentration is medium-high, with the main players controlling a large market share due to the economies of scale, vertical integration of the manufacturing processes, and the technological advantage in the energy-efficient and high-density server architecture as well as the AI-optimized one.
Key companies in the Tier-1 segment are Dell Inc., Hewlett Packard Enterprise (HPE), Lenovo, Inspur, and Super Micro Computer, which control the market as full-server portfolio providers of enterprise IT, cloud data center, hyperscale deployments, and AI/HPC workloads. To maintain leadership, these firms use custom server designs, tight relationships with processor vendors, accelerator vendors, and memory vendors and close relationships with hyperscale cloud providers as well as enterprise customers.
Tier-2 players target regional markets and workload-specific servers, Tier-3 players, such as start-ups and white-box manufacturers, consider cost-effective designs, open-compute platforms, and niche server configurations, and encourage cross-tier competition and constant innovation in the entire global server ecosystem.
Recent Development and Strategic Overview
-
In July 2025, IBM introduced its Power11 AI-ready server series in India, which is tailored with always-on enterprise settings. The servers accommodate the hybrid cloud deployments, real time AI inferencing and high workload. High energy efficiency and scaling capabilities allow the businesses to optimize the compute capacity and operational cost.
- In April 2025, Dell Technologies announced infrastructure innovations to its server and data center portfolio including the PowerEdge R470, R570, R670 and R770 servers which have Intel Xeon 6 processors and improved performance, energy efficiency and scalability. The upgrades assist with the contemporary AI and conventional workloads, enhance the management and minimize energy consumption and data center footprints.
Report Scope
|
Detail |
|
|
Market Size in 2025 |
USD 112.6 Bn |
|
Market Forecast Value in 2035 |
USD 247.6 Bn |
|
Growth Rate (CAGR) |
8.2% |
|
Forecast Period |
2026 – 2035 |
|
Historical Data Available for |
2021 – 2024 |
|
Market Size Units |
US$ Billion for Value |
|
Report Format |
Electronic (PDF) + Excel |
|
North America |
Europe |
Asia Pacific |
Middle East |
Africa |
South America |
|
|
|
|
|
|
|
Companies Covered |
|||||
|
|
|
|
|
|
Server Market Segmentation and Highlights
|
Segment |
Sub-segment |
|
Server Market, By Server Type |
|
|
Server Market, By Operating System |
|
|
Server Market, By Processor Type |
|
|
Server Market, By Enterprise Size |
|
|
Server Market, By Deployment Model |
|
|
Server Market, By Virtualization |
|
|
Server Market, By Storage Capacity |
|
|
Server Market, By Form Factor |
|
|
Server Market, By Workload Type |
|
|
Server Market, By End-Use Industry |
|
|
Server Market, By Sales Channel |
|
Frequently Asked Questions
Table of Contents
- 1. Research Methodology and Assumptions
- 1.1. Definitions
- 1.2. Research Design and Approach
- 1.3. Data Collection Methods
- 1.4. Base Estimates and Calculations
- 1.5. Forecasting Models
- 1.5.1. Key Forecast Factors & Impact Analysis
- 1.6. Secondary Research
- 1.6.1. Open Sources
- 1.6.2. Paid Databases
- 1.6.3. Associations
- 1.7. Primary Research
- 1.7.1. Primary Sources
- 1.7.2. Primary Interviews with Stakeholders across Ecosystem
- 2. Executive Summary
- 2.1. Global Server Market Outlook
- 2.1.1. Server Market Size (Value - US$ Bn), and Forecasts, 2021-2035
- 2.1.2. Compounded Annual Growth Rate Analysis
- 2.1.3. Growth Opportunity Analysis
- 2.1.4. Segmental Share Analysis
- 2.1.5. Geographical Share Analysis
- 2.2. Market Analysis and Facts
- 2.3. Supply-Demand Analysis
- 2.4. Competitive Benchmarking
- 2.5. Go-to- Market Strategy
- 2.5.1. Customer/ End-use Industry Assessment
- 2.5.2. Growth Opportunity Data, 2026-2035
- 2.5.2.1. Regional Data
- 2.5.2.2. Country Data
- 2.5.2.3. Segmental Data
- 2.5.3. Identification of Potential Market Spaces
- 2.5.4. GAP Analysis
- 2.5.5. Potential Attractive Price Points
- 2.5.6. Prevailing Market Risks & Challenges
- 2.5.7. Preferred Sales & Marketing Strategies
- 2.5.8. Key Recommendations and Analysis
- 2.5.9. A Way Forward
- 2.1. Global Server Market Outlook
- 3. Industry Data and Premium Insights
- 3.1. Global IT & Media Industry Overview, 2025
- 3.1.1. IT & Media Industry Ecosystem Analysis
- 3.1.2. Key Trends for IT & Media Industry
- 3.1.3. Regional Distribution for IT & Media Industry
- 3.2. Supplier Customer Data
- 3.3. Technology Roadmap and Developments
- 3.4. Trade Analysis
- 3.4.1. Import & Export Analysis, 2025
- 3.4.2. Top Importing Countries
- 3.4.3. Top Exporting Countries
- 3.5. Trump Tariff Impact Analysis
- 3.5.1. Manufacturer
- 3.5.1.1. Based on the component & Raw material
- 3.5.2. Supply Chain
- 3.5.3. End Consumer
- 3.5.1. Manufacturer
- 3.6. Raw Material Analysis
- 3.1. Global IT & Media Industry Overview, 2025
- 4. Market Overview
- 4.1. Market Dynamics
- 4.1.1. Drivers
- 4.1.1.1. Growth in cloud computing, data centers, and enterprise IT infrastructure.
- 4.1.1.2. Rising adoption of AI, big data, and high-performance computing workloads.
- 4.1.1.3. Increasing demand for edge computing and virtualization technologies.
- 4.1.2. Restraints
- 4.1.2.1. Supply chain disruptions and component shortages (e.g., semiconductors).
- 4.1.2.2. High capital expenditure for server acquisition and deployment.
- 4.1.1. Drivers
- 4.2. Key Trend Analysis
- 4.3. Regulatory Framework
- 4.3.1. Key Regulations, Norms, and Subsidies, by Key Countries
- 4.3.2. Tariffs and Standards
- 4.3.3. Impact Analysis of Regulations on the Market
- 4.4. Value Chain Analysis
- 4.4.1. Component Suppliers
- 4.4.2. Manufacturers
- 4.4.3. Dealers/ Distributors
- 4.4.4. End-Users/ Customers
- 4.5. Porter’s Five Forces Analysis
- 4.6. PESTEL Analysis
- 4.7. Global Server Market Demand
- 4.7.1. Historical Market Size – Value (US$ Bn), 2020-2024
- 4.7.2. Current and Future Market Size – Value (US$ Bn), 2026–2035
- 4.7.2.1. Y-o-Y Growth Trends
- 4.7.2.2. Absolute $ Opportunity Assessment
- 4.1. Market Dynamics
- 5. Competition Landscape
- 5.1. Competition structure
- 5.1.1. Fragmented v/s consolidated
- 5.2. Company Share Analysis, 2025
- 5.2.1. Global Company Market Share
- 5.2.2. By Region
- 5.2.2.1. North America
- 5.2.2.2. Europe
- 5.2.2.3. Asia Pacific
- 5.2.2.4. Middle East
- 5.2.2.5. Africa
- 5.2.2.6. South America
- 5.3. Product Comparison Matrix
- 5.3.1. Specifications
- 5.3.2. Market Positioning
- 5.3.3. Pricing
- 5.1. Competition structure
- 6. Global Server Market Analysis, by Server Type
- 6.1. Key Segment Analysis
- 6.2. Server Market Size (Value - US$ Bn), Analysis, and Forecasts, by Product Type, 2021-2035
- 6.2.1. Rack Servers
- 6.2.2. Blade Servers
- 6.2.3. Tower Servers
- 6.2.4. Micro Servers
- 6.2.5. Mission-Critical Servers
- 6.2.6. Mainframe Servers
- 7. Global Server Market Analysis, by Operating System
- 7.1. Key Segment Analysis
- 7.2. Server Market Size (Value - US$ Bn), Analysis, and Forecasts, by Operating System, 2021-2035
- 7.2.1. Windows Server
- 7.2.2. Linux/Unix
- 7.2.3. IBM i (AS/400)
- 7.2.4. z/OS
- 7.2.5. VMware
- 7.2.6. Other Proprietary OS
- 8. Global Server Market Analysis, by Processor Type
- 8.1. Key Segment Analysis
- 8.2. Server Market Size (Value - US$ Bn), Analysis, and Forecasts, by Processor Type, 2021-2035
- 8.2.1. x86 Processors
- 8.2.1.1. Intel Xeon
- 8.2.1.2. AMD EPYC
- 8.2.2. ARM-based Processors
- 8.2.3. RISC Processors
- 8.2.4. Power Architecture
- 8.2.5. SPARC Processors
- 8.2.6. Others
- 8.2.1. x86 Processors
- 9. Global Server Market Analysis, by Enterprise Size
- 9.1. Key Segment Analysis
- 9.2. Server Market Size (Value - US$ Bn), Analysis, and Forecasts, by Enterprise Size, 2021-2035
- 9.2.1. Small and Medium Enterprises (SMEs)
- 9.2.2. Large Enterprises
- 9.2.3. Government and Public Sector
- 10. Global Server Market Analysis, by Deployment Model
- 10.1. Key Segment Analysis
- 10.2. Server Market Size (Value - US$ Bn), Analysis, and Forecasts, by Deployment Model, 2021-2035
- 10.2.1. On-Premises
- 10.2.2. Cloud-Based
- 10.2.3. Colocation
- 11. Global Server Market Analysis, by Virtualization
- 11.1. Key Segment Analysis
- 11.2. Server Market Size (Value - US$ Bn), Analysis, and Forecasts, by Virtualization, 2021-2035
- 11.2.1. Virtualized Servers
- 11.2.2. Non-Virtualized Servers
- 11.2.3. Containerized Infrastructure
- 12. Global Server Market Analysis, by Storage Capacity
- 12.1. Key Segment Analysis
- 12.2. Server Market Size (Value - US$ Bn), Analysis, and Forecasts, by Storage Capacity, 2021-2035
- 12.2.1. Up to 2TB
- 12.2.2. 2TB to 10TB
- 12.2.3. 10TB to 50TB
- 12.2.4. Above 50TB
- 13. Global Server Market Analysis, by Form Factor
- 13.1. Key Segment Analysis
- 13.2. Server Market Size (Value - US$ Bn), Analysis, and Forecasts, by Form Factor, 2021-2035
- 13.2.1. 1U Servers
- 13.2.2. 2U Servers
- 13.2.3. 4U Servers
- 13.2.4. Multi-Node Servers
- 13.2.5. Modular Servers
- 14. Global Server Market Analysis, by Workload Type
- 14.1. Key Segment Analysis
- 14.2. Server Market Size (Value - US$ Bn), Analysis, and Forecasts, by Workload Type, 2021-2035
- 14.2.1. General Purpose Workloads
- 14.2.2. High-Performance Computing (HPC)
- 14.2.3. Database Management
- 14.2.4. Web Hosting and Content Delivery
- 14.2.5. AI/ML Workloads
- 14.2.6. Edge Computing Workloads
- 14.2.7. Others
- 15. Global Server Market Analysis, by End-Use Industry
- 15.1. Key Segment Analysis
- 15.2. Server Market Size (Value - US$ Bn), Analysis, and Forecasts, by End-Use Industry, 2021-2035
- 15.2.1. BFSI
- 15.2.2. IT & Telecommunications
- 15.2.3. Healthcare & Life Sciences
- 15.2.4. Retail & E-commerce
- 15.2.5. Manufacturing
- 15.2.6. Government & Defense
- 15.2.7. Education & Research
- 15.2.8. Media & Entertainment
- 15.2.9. Energy & Utilities
- 15.2.10. Transportation & Logistics
- 15.2.11. Hospitality & Travel
- 15.2.12. Professional Services
- 15.2.13. Others
- 16. Global Server Market Analysis, by Sales Channel
- 16.1. Key Segment Analysis
- 16.2. Server Market Size (Value - US$ Bn), Analysis, and Forecasts, by Sales Channel, 2021-2035
- 16.2.1. Direct Sales
- 16.2.2. Distributors
- 16.2.3. Value-Added Resellers (VARs)
- 16.2.4. Online Channels
- 17. Global Server Market Analysis and Forecasts, by Region
- 17.1. Key Findings
- 17.2. Server Market Size (Value - US$ Bn), Analysis, and Forecasts, by Region, 2021-2035
- 17.2.1. North America
- 17.2.2. Europe
- 17.2.3. Asia Pacific
- 17.2.4. Middle East
- 17.2.5. Africa
- 17.2.6. South America
- 18. North America Server Market Analysis
- 18.1. Key Segment Analysis
- 18.2. Regional Snapshot
- 18.3. North America Server Market Size (Value - US$ Bn), Analysis, and Forecasts, 2021-2035
- 18.3.1. Server Type
- 18.3.2. Operating System
- 18.3.3. Processor Type
- 18.3.4. Enterprise Size
- 18.3.5. Deployment Model
- 18.3.6. Virtualization
- 18.3.7. Storage Capacity
- 18.3.8. Form Factor
- 18.3.9. Workload Type
- 18.3.10. End-Use Industry
- 18.3.11. Sales Channel
- 18.3.12. Country
- 18.3.12.1. USA
- 18.3.12.2. Canada
- 18.3.12.3. Mexico
- 18.4. USA Server Market
- 18.4.1. Country Segmental Analysis
- 18.4.2. Server Type
- 18.4.3. Operating System
- 18.4.4. Processor Type
- 18.4.5. Enterprise Size
- 18.4.6. Deployment Model
- 18.4.7. Virtualization
- 18.4.8. Storage Capacity
- 18.4.9. Form Factor
- 18.4.10. Workload Type
- 18.4.11. End-Use Industry
- 18.4.12. Sales Channel
- 18.5. Canada Server Market
- 18.5.1. Country Segmental Analysis
- 18.5.2. Server Type
- 18.5.3. Operating System
- 18.5.4. Processor Type
- 18.5.5. Enterprise Size
- 18.5.6. Deployment Model
- 18.5.7. Virtualization
- 18.5.8. Storage Capacity
- 18.5.9. Form Factor
- 18.5.10. Workload Type
- 18.5.11. End-Use Industry
- 18.5.12. Sales Channel
- 18.6. Mexico Server Market
- 18.6.1. Country Segmental Analysis
- 18.6.2. Server Type
- 18.6.3. Operating System
- 18.6.4. Processor Type
- 18.6.5. Enterprise Size
- 18.6.6. Deployment Model
- 18.6.7. Virtualization
- 18.6.8. Storage Capacity
- 18.6.9. Form Factor
- 18.6.10. Workload Type
- 18.6.11. End-Use Industry
- 18.6.12. Sales Channel
- 19. Europe Server Market Analysis
- 19.1. Key Segment Analysis
- 19.2. Regional Snapshot
- 19.3. Europe Server Market Size (Value - US$ Bn), Analysis, and Forecasts, 2021-2035
- 19.3.1. Server Type
- 19.3.2. Operating System
- 19.3.3. Processor Type
- 19.3.4. Enterprise Size
- 19.3.5. Deployment Model
- 19.3.6. Virtualization
- 19.3.7. Storage Capacity
- 19.3.8. Form Factor
- 19.3.9. Workload Type
- 19.3.10. End-Use Industry
- 19.3.11. Sales Channel
- 19.3.12. Country
- 19.3.12.1. Germany
- 19.3.12.2. United Kingdom
- 19.3.12.3. France
- 19.3.12.4. Italy
- 19.3.12.5. Spain
- 19.3.12.6. Netherlands
- 19.3.12.7. Nordic Countries
- 19.3.12.8. Poland
- 19.3.12.9. Russia & CIS
- 19.3.12.10. Rest of Europe
- 19.4. Germany Server Market
- 19.4.1. Country Segmental Analysis
- 19.4.2. Server Type
- 19.4.3. Operating System
- 19.4.4. Processor Type
- 19.4.5. Enterprise Size
- 19.4.6. Deployment Model
- 19.4.7. Virtualization
- 19.4.8. Storage Capacity
- 19.4.9. Form Factor
- 19.4.10. Workload Type
- 19.4.11. End-Use Industry
- 19.4.12. Sales Channel
- 19.5. United Kingdom Server Market
- 19.5.1. Country Segmental Analysis
- 19.5.2. Server Type
- 19.5.3. Operating System
- 19.5.4. Processor Type
- 19.5.5. Enterprise Size
- 19.5.6. Deployment Model
- 19.5.7. Virtualization
- 19.5.8. Storage Capacity
- 19.5.9. Form Factor
- 19.5.10. Workload Type
- 19.5.11. End-Use Industry
- 19.5.12. Sales Channel
- 19.6. France Server Market
- 19.6.1. Country Segmental Analysis
- 19.6.2. Server Type
- 19.6.3. Operating System
- 19.6.4. Processor Type
- 19.6.5. Enterprise Size
- 19.6.6. Deployment Model
- 19.6.7. Virtualization
- 19.6.8. Storage Capacity
- 19.6.9. Form Factor
- 19.6.10. Workload Type
- 19.6.11. End-Use Industry
- 19.6.12. Sales Channel
- 19.7. Italy Server Market
- 19.7.1. Country Segmental Analysis
- 19.7.2. Server Type
- 19.7.3. Operating System
- 19.7.4. Processor Type
- 19.7.5. Enterprise Size
- 19.7.6. Deployment Model
- 19.7.7. Virtualization
- 19.7.8. Storage Capacity
- 19.7.9. Form Factor
- 19.7.10. Workload Type
- 19.7.11. End-Use Industry
- 19.7.12. Sales Channel
- 19.8. Spain Server Market
- 19.8.1. Country Segmental Analysis
- 19.8.2. Server Type
- 19.8.3. Operating System
- 19.8.4. Processor Type
- 19.8.5. Enterprise Size
- 19.8.6. Deployment Model
- 19.8.7. Virtualization
- 19.8.8. Storage Capacity
- 19.8.9. Form Factor
- 19.8.10. Workload Type
- 19.8.11. End-Use Industry
- 19.8.12. Sales Channel
- 19.9. Netherlands Server Market
- 19.9.1. Country Segmental Analysis
- 19.9.2. Server Type
- 19.9.3. Operating System
- 19.9.4. Processor Type
- 19.9.5. Enterprise Size
- 19.9.6. Deployment Model
- 19.9.7. Virtualization
- 19.9.8. Storage Capacity
- 19.9.9. Form Factor
- 19.9.10. Workload Type
- 19.9.11. End-Use Industry
- 19.9.12. Sales Channel
- 19.10. Nordic Countries Server Market
- 19.10.1. Country Segmental Analysis
- 19.10.2. Server Type
- 19.10.3. Operating System
- 19.10.4. Processor Type
- 19.10.5. Enterprise Size
- 19.10.6. Deployment Model
- 19.10.7. Virtualization
- 19.10.8. Storage Capacity
- 19.10.9. Form Factor
- 19.10.10. Workload Type
- 19.10.11. End-Use Industry
- 19.10.12. Sales Channel
- 19.11. Poland Server Market
- 19.11.1. Country Segmental Analysis
- 19.11.2. Server Type
- 19.11.3. Operating System
- 19.11.4. Processor Type
- 19.11.5. Enterprise Size
- 19.11.6. Deployment Model
- 19.11.7. Virtualization
- 19.11.8. Storage Capacity
- 19.11.9. Form Factor
- 19.11.10. Workload Type
- 19.11.11. End-Use Industry
- 19.11.12. Sales Channel
- 19.12. Russia & CIS Server Market
- 19.12.1. Country Segmental Analysis
- 19.12.2. Server Type
- 19.12.3. Operating System
- 19.12.4. Processor Type
- 19.12.5. Enterprise Size
- 19.12.6. Deployment Model
- 19.12.7. Virtualization
- 19.12.8. Storage Capacity
- 19.12.9. Form Factor
- 19.12.10. Workload Type
- 19.12.11. End-Use Industry
- 19.12.12. Sales Channel
- 19.13. Rest of Europe Server Market
- 19.13.1. Country Segmental Analysis
- 19.13.2. Server Type
- 19.13.3. Operating System
- 19.13.4. Processor Type
- 19.13.5. Enterprise Size
- 19.13.6. Deployment Model
- 19.13.7. Virtualization
- 19.13.8. Storage Capacity
- 19.13.9. Form Factor
- 19.13.10. Workload Type
- 19.13.11. End-Use Industry
- 19.13.12. Sales Channel
- 20. Asia Pacific Server Market Analysis
- 20.1. Key Segment Analysis
- 20.2. Regional Snapshot
- 20.3. Asia Pacific Server Market Size (Value - US$ Bn), Analysis, and Forecasts, 2021-2035
- 20.3.1. Server Type
- 20.3.2. Operating System
- 20.3.3. Processor Type
- 20.3.4. Enterprise Size
- 20.3.5. Deployment Model
- 20.3.6. Virtualization
- 20.3.7. Storage Capacity
- 20.3.8. Form Factor
- 20.3.9. Workload Type
- 20.3.10. End-Use Industry
- 20.3.11. Sales Channel
- 20.3.12. Country
- 20.3.12.1. China
- 20.3.12.2. India
- 20.3.12.3. Japan
- 20.3.12.4. South Korea
- 20.3.12.5. Australia and New Zealand
- 20.3.12.6. Indonesia
- 20.3.12.7. Malaysia
- 20.3.12.8. Thailand
- 20.3.12.9. Vietnam
- 20.3.12.10. Rest of Asia Pacific
- 20.4. China Server Market
- 20.4.1. Country Segmental Analysis
- 20.4.2. Server Type
- 20.4.3. Operating System
- 20.4.4. Processor Type
- 20.4.5. Enterprise Size
- 20.4.6. Deployment Model
- 20.4.7. Virtualization
- 20.4.8. Storage Capacity
- 20.4.9. Form Factor
- 20.4.10. Workload Type
- 20.4.11. End-Use Industry
- 20.4.12. Sales Channel
- 20.5. India Server Market
- 20.5.1. Country Segmental Analysis
- 20.5.2. Server Type
- 20.5.3. Operating System
- 20.5.4. Processor Type
- 20.5.5. Enterprise Size
- 20.5.6. Deployment Model
- 20.5.7. Virtualization
- 20.5.8. Storage Capacity
- 20.5.9. Form Factor
- 20.5.10. Workload Type
- 20.5.11. End-Use Industry
- 20.5.12. Sales Channel
- 20.6. Japan Server Market
- 20.6.1. Country Segmental Analysis
- 20.6.2. Server Type
- 20.6.3. Operating System
- 20.6.4. Processor Type
- 20.6.5. Enterprise Size
- 20.6.6. Deployment Model
- 20.6.7. Virtualization
- 20.6.8. Storage Capacity
- 20.6.9. Form Factor
- 20.6.10. Workload Type
- 20.6.11. End-Use Industry
- 20.6.12. Sales Channel
- 20.7. South Korea Server Market
- 20.7.1. Country Segmental Analysis
- 20.7.2. Server Type
- 20.7.3. Operating System
- 20.7.4. Processor Type
- 20.7.5. Enterprise Size
- 20.7.6. Deployment Model
- 20.7.7. Virtualization
- 20.7.8. Storage Capacity
- 20.7.9. Form Factor
- 20.7.10. Workload Type
- 20.7.11. End-Use Industry
- 20.7.12. Sales Channel
- 20.8. Australia and New Zealand Server Market
- 20.8.1. Country Segmental Analysis
- 20.8.2. Server Type
- 20.8.3. Operating System
- 20.8.4. Processor Type
- 20.8.5. Enterprise Size
- 20.8.6. Deployment Model
- 20.8.7. Virtualization
- 20.8.8. Storage Capacity
- 20.8.9. Form Factor
- 20.8.10. Workload Type
- 20.8.11. End-Use Industry
- 20.8.12. Sales Channel
- 20.9. Indonesia Server Market
- 20.9.1. Country Segmental Analysis
- 20.9.2. Server Type
- 20.9.3. Operating System
- 20.9.4. Processor Type
- 20.9.5. Enterprise Size
- 20.9.6. Deployment Model
- 20.9.7. Virtualization
- 20.9.8. Storage Capacity
- 20.9.9. Form Factor
- 20.9.10. Workload Type
- 20.9.11. End-Use Industry
- 20.9.12. Sales Channel
- 20.10. Malaysia Server Market
- 20.10.1. Country Segmental Analysis
- 20.10.2. Server Type
- 20.10.3. Operating System
- 20.10.4. Processor Type
- 20.10.5. Enterprise Size
- 20.10.6. Deployment Model
- 20.10.7. Virtualization
- 20.10.8. Storage Capacity
- 20.10.9. Form Factor
- 20.10.10. Workload Type
- 20.10.11. End-Use Industry
- 20.10.12. Sales Channel
- 20.11. Thailand Server Market
- 20.11.1. Country Segmental Analysis
- 20.11.2. Server Type
- 20.11.3. Operating System
- 20.11.4. Processor Type
- 20.11.5. Enterprise Size
- 20.11.6. Deployment Model
- 20.11.7. Virtualization
- 20.11.8. Storage Capacity
- 20.11.9. Form Factor
- 20.11.10. Workload Type
- 20.11.11. End-Use Industry
- 20.11.12. Sales Channel
- 20.12. Vietnam Server Market
- 20.12.1. Country Segmental Analysis
- 20.12.2. Server Type
- 20.12.3. Operating System
- 20.12.4. Processor Type
- 20.12.5. Enterprise Size
- 20.12.6. Deployment Model
- 20.12.7. Virtualization
- 20.12.8. Storage Capacity
- 20.12.9. Form Factor
- 20.12.10. Workload Type
- 20.12.11. End-Use Industry
- 20.12.12. Sales Channel
- 20.13. Rest of Asia Pacific Server Market
- 20.13.1. Country Segmental Analysis
- 20.13.2. Server Type
- 20.13.3. Operating System
- 20.13.4. Processor Type
- 20.13.5. Enterprise Size
- 20.13.6. Deployment Model
- 20.13.7. Virtualization
- 20.13.8. Storage Capacity
- 20.13.9. Form Factor
- 20.13.10. Workload Type
- 20.13.11. End-Use Industry
- 20.13.12. Sales Channel
- 21. Middle East Server Market Analysis
- 21.1. Key Segment Analysis
- 21.2. Regional Snapshot
- 21.3. Middle East Server Market Size (Value - US$ Bn), Analysis, and Forecasts, 2021-2035
- 21.3.1. Server Type
- 21.3.2. Operating System
- 21.3.3. Processor Type
- 21.3.4. Enterprise Size
- 21.3.5. Deployment Model
- 21.3.6. Virtualization
- 21.3.7. Storage Capacity
- 21.3.8. Form Factor
- 21.3.9. Workload Type
- 21.3.10. End-Use Industry
- 21.3.11. Sales Channel
- 21.3.12. Country
- 21.3.12.1. Turkey
- 21.3.12.2. UAE
- 21.3.12.3. Saudi Arabia
- 21.3.12.4. Israel
- 21.3.12.5. Rest of Middle East
- 21.4. Turkey Server Market
- 21.4.1. Country Segmental Analysis
- 21.4.2. Server Type
- 21.4.3. Operating System
- 21.4.4. Processor Type
- 21.4.5. Enterprise Size
- 21.4.6. Deployment Model
- 21.4.7. Virtualization
- 21.4.8. Storage Capacity
- 21.4.9. Form Factor
- 21.4.10. Workload Type
- 21.4.11. End-Use Industry
- 21.4.12. Sales Channel
- 21.5. UAE Server Market
- 21.5.1. Country Segmental Analysis
- 21.5.2. Server Type
- 21.5.3. Operating System
- 21.5.4. Processor Type
- 21.5.5. Enterprise Size
- 21.5.6. Deployment Model
- 21.5.7. Virtualization
- 21.5.8. Storage Capacity
- 21.5.9. Form Factor
- 21.5.10. Workload Type
- 21.5.11. End-Use Industry
- 21.5.12. Sales Channel
- 21.6. Saudi Arabia Server Market
- 21.6.1. Country Segmental Analysis
- 21.6.2. Server Type
- 21.6.3. Operating System
- 21.6.4. Processor Type
- 21.6.5. Enterprise Size
- 21.6.6. Deployment Model
- 21.6.7. Virtualization
- 21.6.8. Storage Capacity
- 21.6.9. Form Factor
- 21.6.10. Workload Type
- 21.6.11. End-Use Industry
- 21.6.12. Sales Channel
- 21.7. Israel Server Market
- 21.7.1. Country Segmental Analysis
- 21.7.2. Server Type
- 21.7.3. Operating System
- 21.7.4. Processor Type
- 21.7.5. Enterprise Size
- 21.7.6. Deployment Model
- 21.7.7. Virtualization
- 21.7.8. Storage Capacity
- 21.7.9. Form Factor
- 21.7.10. Workload Type
- 21.7.11. End-Use Industry
- 21.7.12. Sales Channel
- 21.8. Rest of Middle East Server Market
- 21.8.1. Country Segmental Analysis
- 21.8.2. Server Type
- 21.8.3. Operating System
- 21.8.4. Processor Type
- 21.8.5. Enterprise Size
- 21.8.6. Deployment Model
- 21.8.7. Virtualization
- 21.8.8. Storage Capacity
- 21.8.9. Form Factor
- 21.8.10. Workload Type
- 21.8.11. End-Use Industry
- 21.8.12. Sales Channel
- 22. Africa Server Market Analysis
- 22.1. Key Segment Analysis
- 22.2. Regional Snapshot
- 22.3. Africa Server Market Size (Value - US$ Bn), Analysis, and Forecasts, 2021-2035
- 22.3.1. Server Type
- 22.3.2. Operating System
- 22.3.3. Processor Type
- 22.3.4. Enterprise Size
- 22.3.5. Deployment Model
- 22.3.6. Virtualization
- 22.3.7. Storage Capacity
- 22.3.8. Form Factor
- 22.3.9. Workload Type
- 22.3.10. End-Use Industry
- 22.3.11. Sales Channel
- 22.3.12. Country
- 22.3.12.1. South Africa
- 22.3.12.2. Egypt
- 22.3.12.3. Nigeria
- 22.3.12.4. Algeria
- 22.3.12.5. Rest of Africa
- 22.4. South Africa Server Market
- 22.4.1. Country Segmental Analysis
- 22.4.2. Server Type
- 22.4.3. Operating System
- 22.4.4. Processor Type
- 22.4.5. Enterprise Size
- 22.4.6. Deployment Model
- 22.4.7. Virtualization
- 22.4.8. Storage Capacity
- 22.4.9. Form Factor
- 22.4.10. Workload Type
- 22.4.11. End-Use Industry
- 22.4.12. Sales Channel
- 22.5. Egypt Server Market
- 22.5.1. Country Segmental Analysis
- 22.5.2. Server Type
- 22.5.3. Operating System
- 22.5.4. Processor Type
- 22.5.5. Enterprise Size
- 22.5.6. Deployment Model
- 22.5.7. Virtualization
- 22.5.8. Storage Capacity
- 22.5.9. Form Factor
- 22.5.10. Workload Type
- 22.5.11. End-Use Industry
- 22.5.12. Sales Channel
- 22.6. Nigeria Server Market
- 22.6.1. Country Segmental Analysis
- 22.6.2. Server Type
- 22.6.3. Operating System
- 22.6.4. Processor Type
- 22.6.5. Enterprise Size
- 22.6.6. Deployment Model
- 22.6.7. Virtualization
- 22.6.8. Storage Capacity
- 22.6.9. Form Factor
- 22.6.10. Workload Type
- 22.6.11. End-Use Industry
- 22.6.12. Sales Channel
- 22.7. Algeria Server Market
- 22.7.1. Country Segmental Analysis
- 22.7.2. Server Type
- 22.7.3. Operating System
- 22.7.4. Processor Type
- 22.7.5. Enterprise Size
- 22.7.6. Deployment Model
- 22.7.7. Virtualization
- 22.7.8. Storage Capacity
- 22.7.9. Form Factor
- 22.7.10. Workload Type
- 22.7.11. End-Use Industry
- 22.7.12. Sales Channel
- 22.8. Rest of Africa Server Market
- 22.8.1. Country Segmental Analysis
- 22.8.2. Server Type
- 22.8.3. Operating System
- 22.8.4. Processor Type
- 22.8.5. Enterprise Size
- 22.8.6. Deployment Model
- 22.8.7. Virtualization
- 22.8.8. Storage Capacity
- 22.8.9. Form Factor
- 22.8.10. Workload Type
- 22.8.11. End-Use Industry
- 22.8.12. Sales Channel
- 23. South America Server Market Analysis
- 23.1. Key Segment Analysis
- 23.2. Regional Snapshot
- 23.3. South America Server Market Size (Value - US$ Bn), Analysis, and Forecasts, 2021-2035
- 23.3.1. Server Type
- 23.3.2. Operating System
- 23.3.3. Processor Type
- 23.3.4. Enterprise Size
- 23.3.5. Deployment Model
- 23.3.6. Virtualization
- 23.3.7. Storage Capacity
- 23.3.8. Form Factor
- 23.3.9. Workload Type
- 23.3.10. End-Use Industry
- 23.3.11. Sales Channel
- 23.3.12. Country
- 23.3.12.1. Brazil
- 23.3.12.2. Argentina
- 23.3.12.3. Rest of South America
- 23.4. Brazil Server Market
- 23.4.1. Country Segmental Analysis
- 23.4.2. Server Type
- 23.4.3. Operating System
- 23.4.4. Processor Type
- 23.4.5. Enterprise Size
- 23.4.6. Deployment Model
- 23.4.7. Virtualization
- 23.4.8. Storage Capacity
- 23.4.9. Form Factor
- 23.4.10. Workload Type
- 23.4.11. End-Use Industry
- 23.4.12. Sales Channel
- 23.5. Argentina Server Market
- 23.5.1. Country Segmental Analysis
- 23.5.2. Server Type
- 23.5.3. Operating System
- 23.5.4. Processor Type
- 23.5.5. Enterprise Size
- 23.5.6. Deployment Model
- 23.5.7. Virtualization
- 23.5.8. Storage Capacity
- 23.5.9. Form Factor
- 23.5.10. Workload Type
- 23.5.11. End-Use Industry
- 23.5.12. Sales Channel
- 23.6. Rest of South America Server Market
- 23.6.1. Country Segmental Analysis
- 23.6.2. Server Type
- 23.6.3. Operating System
- 23.6.4. Processor Type
- 23.6.5. Enterprise Size
- 23.6.6. Deployment Model
- 23.6.7. Virtualization
- 23.6.8. Storage Capacity
- 23.6.9. Form Factor
- 23.6.10. Workload Type
- 23.6.11. End-Use Industry
- 23.6.12. Sales Channel
- 24. Key Players/ Company Profile
- 24.1. Arm Holdings
- 24.1.1. Company Details/ Overview
- 24.1.2. Company Financials
- 24.1.3. Key Customers and Competitors
- 24.1.4. Business/ Industry Portfolio
- 24.1.5. Product Portfolio/ Specification Details
- 24.1.6. Pricing Data
- 24.1.7. Strategic Overview
- 24.1.8. Recent Developments
- 24.2. ASUSTeK Computer Inc.
- 24.3. Atos
- 24.4. Cisco Systems, Inc.
- 24.5. Dell Inc.
- 24.6. Fujitsu
- 24.7. H3C Technologies
- 24.8. Hewlett Packard Enterprise (HPE)
- 24.9. Huawei Technologies Co., Ltd.
- 24.10. IBM
- 24.11. Inspur
- 24.12. Intel Corporation
- 24.13. Lenovo
- 24.14. Mitac Computing Technology Corporation
- 24.15. NEC Corporation
- 24.16. Oracle Corporation
- 24.17. Quanta Computer lnc.
- 24.18. SMART Global Holdings, Inc.
- 24.19. Super Micro Computer, Inc.
- 24.20. ZTE Corporation
- 24.21. Other Key Players
- 24.1. Arm Holdings
Note* - This is just tentative list of players. While providing the report, we will cover more number of players based on their revenue and share for each geography
Research Design
Our research design integrates both demand-side and supply-side analysis through a balanced combination of primary and secondary research methodologies. By utilizing both bottom-up and top-down approaches alongside rigorous data triangulation methods, we deliver robust market intelligence that supports strategic decision-making.
MarketGenics' comprehensive research design framework ensures the delivery of accurate, reliable, and actionable market intelligence. Through the integration of multiple research approaches, rigorous validation processes, and expert analysis, we provide our clients with the insights needed to make informed strategic decisions and capitalize on market opportunities.

MarketGenics leverages a dedicated industry panel of experts and a comprehensive suite of paid databases to effectively collect, consolidate, and analyze market intelligence.
Our approach has consistently proven to be reliable and effective in generating accurate market insights, identifying key industry trends, and uncovering emerging business opportunities.
Through both primary and secondary research, we capture and analyze critical company-level data such as manufacturing footprints, including technical centers, R&D facilities, sales offices, and headquarters.
Our expert panel further enhances our ability to estimate market size for specific brands based on validated field-level intelligence.
Our data mining techniques incorporate both parametric and non-parametric methods, allowing for structured data collection, sorting, processing, and cleaning.
Demand projections are derived from large-scale data sets analyzed through proprietary algorithms, culminating in robust and reliable market sizing.
Research Approach
The bottom-up approach builds market estimates by starting with the smallest addressable market units and systematically aggregating them to create comprehensive market size projections.
This method begins with specific, granular data points and builds upward to create the complete market landscape.
Customer Analysis → Segmental Analysis → Geographical Analysis
The top-down approach starts with the broadest possible market data and systematically narrows it down through a series of filters and assumptions to arrive at specific market segments or opportunities.
This method begins with the big picture and works downward to increasingly specific market slices.
TAM → SAM → SOM


Research Methods
Desk / Secondary Research
While analysing the market, we extensively study secondary sources, directories, and databases to identify and collect information useful for this technical, market-oriented, and commercial report. Secondary sources that we utilize are not only the public sources, but it is a combination of Open Source, Associations, Paid Databases, MG Repository & Knowledgebase, and others.
- Company websites, annual reports, financial reports, broker reports, and investor presentations
- National government documents, statistical databases and reports
- News articles, press releases and web-casts specific to the companies operating in the market, Magazines, reports, and others
- We gather information from commercial data sources for deriving company specific data such as segmental revenue, share for geography, product revenue, and others
- Internal and external proprietary databases (industry-specific), relevant patent, and regulatory databases
- Governing Bodies, Government Organizations
- Relevant Authorities, Country-specific Associations for Industries
We also employ the model mapping approach to estimate the product level market data through the players' product portfolio
Primary Research
Primary research/ interviews is vital in analyzing the market. Most of the cases involves paid primary interviews. Primary sources include primary interviews through e-mail interactions, telephonic interviews, surveys as well as face-to-face interviews with the different stakeholders across the value chain including several industry experts.
| Type of Respondents | Number of Primaries |
|---|---|
| Tier 2/3 Suppliers | ~20 |
| Tier 1 Suppliers | ~25 |
| End-users | ~25 |
| Industry Expert/ Panel/ Consultant | ~30 |
| Total | ~100 |
MG Knowledgebase
• Repository of industry blog, newsletter and case studies
• Online platform covering detailed market reports, and company profiles
Forecasting Factors and Models
Forecasting Factors
- Historical Trends – Past market patterns, cycles, and major events that shaped how markets behave over time. Understanding past trends helps predict future behavior.
- Industry Factors – Specific characteristics of the industry like structure, regulations, and innovation cycles that affect market dynamics.
- Macroeconomic Factors – Economic conditions like GDP growth, inflation, and employment rates that affect how much money people have to spend.
- Demographic Factors – Population characteristics like age, income, and location that determine who can buy your product.
- Technology Factors – How quickly people adopt new technology and how much technology infrastructure exists.
- Regulatory Factors – Government rules, laws, and policies that can help or restrict market growth.
- Competitive Factors – Analyzing competition structure such as degree of competition and bargaining power of buyers and suppliers.
Forecasting Models / Techniques
Multiple Regression Analysis
- Identify and quantify factors that drive market changes
- Statistical modeling to establish relationships between market drivers and outcomes
Time Series Analysis – Seasonal Patterns
- Understand regular cyclical patterns in market demand
- Advanced statistical techniques to separate trend, seasonal, and irregular components
Time Series Analysis – Trend Analysis
- Identify underlying market growth patterns and momentum
- Statistical analysis of historical data to project future trends
Expert Opinion – Expert Interviews
- Gather deep industry insights and contextual understanding
- In-depth interviews with key industry stakeholders
Multi-Scenario Development
- Prepare for uncertainty by modeling different possible futures
- Creating optimistic, pessimistic, and most likely scenarios
Time Series Analysis – Moving Averages
- Sophisticated forecasting for complex time series data
- Auto-regressive integrated moving average models with seasonal components
Econometric Models
- Apply economic theory to market forecasting
- Sophisticated economic models that account for market interactions
Expert Opinion – Delphi Method
- Harness collective wisdom of industry experts
- Structured, multi-round expert consultation process
Monte Carlo Simulation
- Quantify uncertainty and probability distributions
- Thousands of simulations with varying input parameters
Research Analysis
Our research framework is built upon the fundamental principle of validating market intelligence from both demand and supply perspectives. This dual-sided approach ensures comprehensive market understanding and reduces the risk of single-source bias.
Demand-Side Analysis: We understand end-user/application behavior, preferences, and market needs along with the penetration of the product for specific application.
Supply-Side Analysis: We estimate overall market revenue, analyze the segmental share along with industry capacity, competitive landscape, and market structure.
Validation & Evaluation
Data triangulation is a validation technique that uses multiple methods, sources, or perspectives to examine the same research question, thereby increasing the credibility and reliability of research findings. In market research, triangulation serves as a quality assurance mechanism that helps identify and minimize bias, validate assumptions, and ensure accuracy in market estimates.
- Data Source Triangulation – Using multiple data sources to examine the same phenomenon
- Methodological Triangulation – Using multiple research methods to study the same research question
- Investigator Triangulation – Using multiple researchers or analysts to examine the same data
- Theoretical Triangulation – Using multiple theoretical perspectives to interpret the same data

Custom Market Research Services
We will customise the research for you, in case the report listed above does not meet your requirements.
Get 10% Free Customisation