Smart Mobility Market Size, Share & Trends Analysis Report by Solution Type (Traffic Management Systems, Parking Management Systems, Integrated Supervision Systems, Ticketing Management Systems, Fleet Management Systems, Ride-Sharing Solutions, Mobility-as-a-Service (MaaS) Platforms, Navigation Systems, Insurance Telematics, Others), Transportation Mode, Technology, Connectivity, Ownership Model, and Geography (North America, Europe, Asia Pacific, Middle East, Africa, and South America) – Global Industry Data, Trends, and Forecasts, 2026–2035
Market Overview:
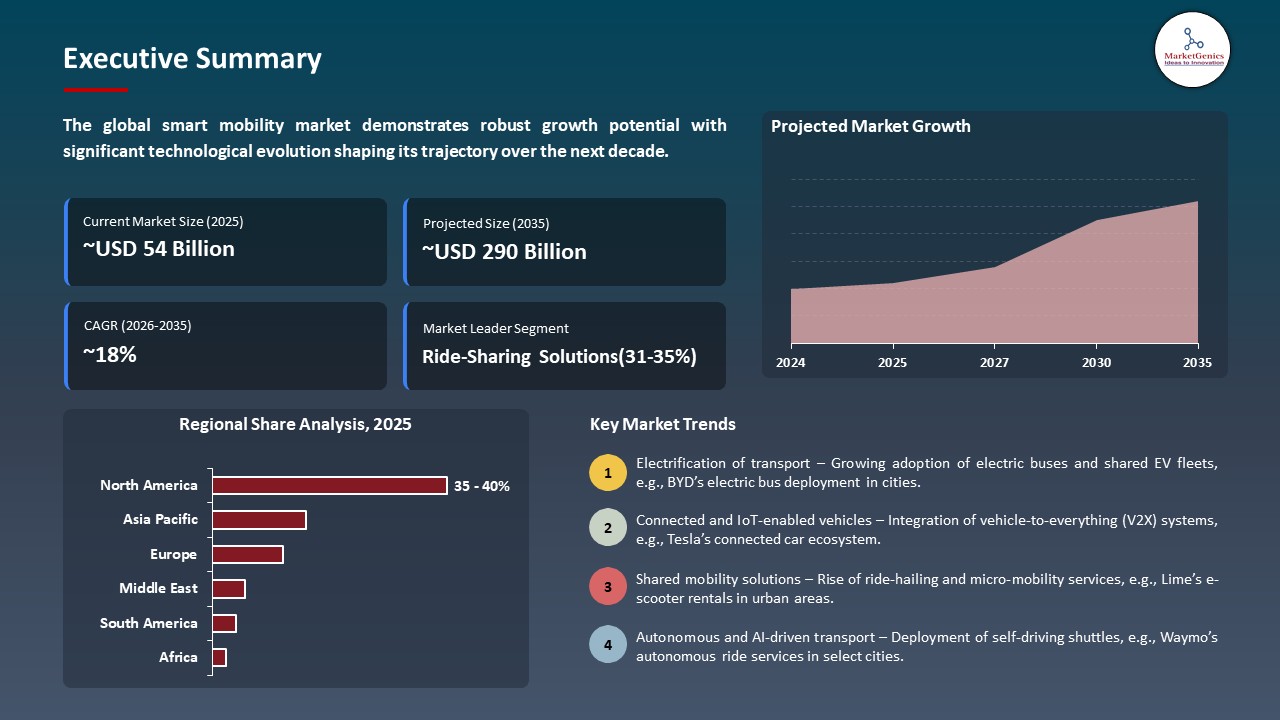
According to MarketGenics Analysis, the global Smart Mobility Market is experiencing substantial growth, with its market value estimated at USD 53.5 billion in 2025 and projected to reach approximately USD 289.6 billion by 2035, registering a robust CAGR of 18.4% during the forecast period.
|
|
|
Segmental Data Insights |
|
|
Demand Trends |
|
|
Competitive Landscape |
|
|
Strategic Development |
|
|
Future Outlook & Opportunities |
|
Smart Mobility Market Size, Share, and Growth
AI-driven traffic management systems, connected vehicle platforms, and edge-enabled analytics are driving the global market in smart mobility, enabling cities and transport operators to know the traffic flow, vehicle performance, and commuter behavior in real-time.
Ms. Victoria Jing Xiang, EHang’s Chief Operating Officer for Europe and Latin America, said: We hope to bring EHang’s technological strengths and global flight operations experience more deeply into Spain through collaboration with local partners, contributing to the development of urban air mobility in Spain and Europe. The China–Spain Smart Mobility Forum provides a valuable platform for dialogue, technical cooperation, and ongoing government–industry engagement, jointly advancing the smart mobility ecosystem.
The global smart mobility market Size is developing at a very fast pace because of increasing need of efficient, connected and autonomous forms of transportation in the urban and intercity systems. Modern technologies, including AI-powered traffic analytics, IoT-powered vehicle sensors, and real-time fleet tracking, can offer operators and urban planners with actionable data to ensure that the traffic flows optimization, emissions reduction, and passenger experience. For instance, in July 2025, the Greater Visakhapatnam Municipal Corporation unveiled a pilot AI-powered project called Project SARTHI which used smart cameras and automatic number plates to improve traffic mobility and safety in the city.
Transport authorities can dynamically coordinate fleets, enhance operational efficiency and reduce delays with integrated cloud-based management systems, predictive route optimization, and adaptive energy management platforms. For instance, in January 2026, the Goa state installed 92 AI-powered traffic lights with smart cameras to streamline traffic, enhance road safety and provide intelligent management of transport in real-time. The 5G communications with low latency, V2X (Vehicle-to-Everything) networks, and the multi-modal transport integration are supporting the implementation of smart mobility solutions on a large scale.
The adjacent opportunities are opening new platforms of innovation where related platforms monitor the health of vehicles, passenger demand patterns, and energy consumption to simplify operations, allow predictive maintenance, and save on operational costs. Smart Mobility is reshaping the transportation of the cities by offering real-time decision-making, better reliability of the services, and environmentally-friendly solutions, which makes it a foundation of sustainable and intelligent cities.
 Smart Mobility Market Dynamics and Trends
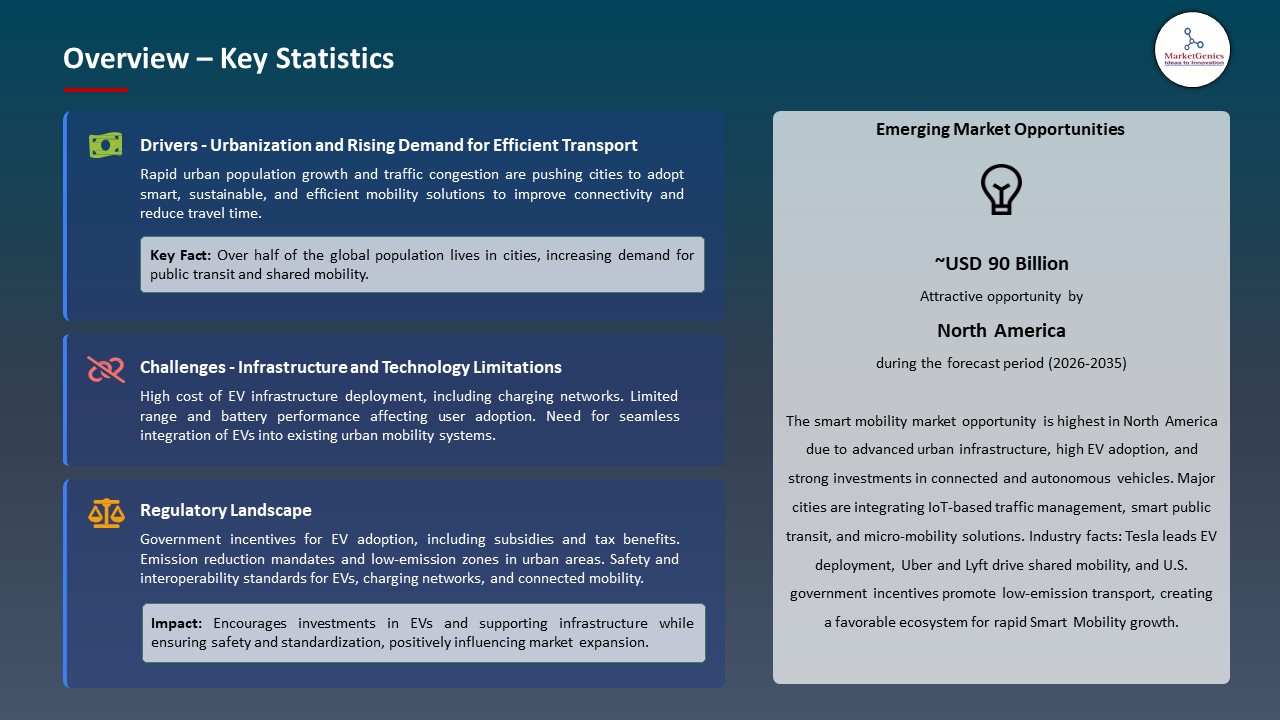
Driver: Rapid Urbanization & Demand for Efficient Transportation
-
The high rate of urban population growth and the rise in the number of vehicles within the urban areas is catalyzing the use of smart mobility solutions on a global scale with the cities aiming to alleviate congestion, decrease emissions, and enhance the overall efficiency of transit.
- The developed AI-based traffic management systems, connected cars, IoT-based public transportation, it is possible to optimize routes in real-time, predict congestion, and schedule dynamically. For instance, in June 2025, Nagpur Municipal Corporation installed AI-powered intelligent traffic lights at major intersections as part of its Rs 197 crore Integrated Intelligent Traffic Management System (IITMS) to help travelers cut down on their travel duration and increase the mobility of the city.
- Connected transport platforms, AI, and IoT enhance efficiency, predictability of traveling, and sustainability of cities.
Restraint: High Infrastructure & Deployment Costs
-
The cost of high capital outlay of deploying 5G networks, V2X enabled road units, and AI-driven traffic management systems restricts large-scale use of smart mobility solutions, particularly in new cities with tight budgets.
- The financial barriers are further increased with the help of operational and maintenance expenses such as software subscriptions of cloud-based mobility platforms, sensor calibration, network management, and special technician training that transit authorities and private operators have to pay.
- The absence of urban digital infrastructure and talent base retards massive implementation of smart mobility measure.
Opportunity: Integration of 5G & V2X Communication Technologies
-
The implementation of 5G networks, AI-oriented sensors and connected cars are offered to give the smart mobility market tremendous growth prospects globally, as it allows delivering ultra-low latency communication, predictive traffic control, and synchronized multi-modal transportation networks.
- Advanced V2X platforms: automobile real-time data exchange between cars and infrastructure, as well as between cars and pedestrians, is possible; in October 2025, the Shanghai International Automobile City and the 5G Automotive Association can demonstrate connected cars using C-V2X and 5G-Advanced technology, reporting better road safety, traffic flow, and overall operations of smart mobility.
- Scalable 5G and V2X-based ecosystems allow optimized route plans, safer autonomous operations, and solutions with less energy consumption in the city mobility at city-wide levels.
Key Trend: Integration of AI & IoT for Intelligent Mobility Ecosystems
-
The application of AI-powered traffic sensors, connected vehicles, and urban IoT can popularize the smart mobility market across the globe because the technology enables predictive traffic control, efficient route is planning, and better functioning of transportation systems of a public and shared transportation system.
- AI and IoT analytics are being used by real-time mobility platforms to provide actionable insights. Dubai provides an example of an AI-based Intelligent Traffic System that is fully autonomous and uses real-time video footage and machine learning to identify and report traffic infractions with no human involvement, which, in October 2025, was used to introduce an Intelligent Traffic System as a significant advance in AI-driven smart mobility infrastructure.
- Connected vehicle and IoT ecosystems can be used to support real-time fleet management, energy-saving options, and scalable and sustainable urban mobility.
 Smart Mobility Market Analysis and Segmental Data
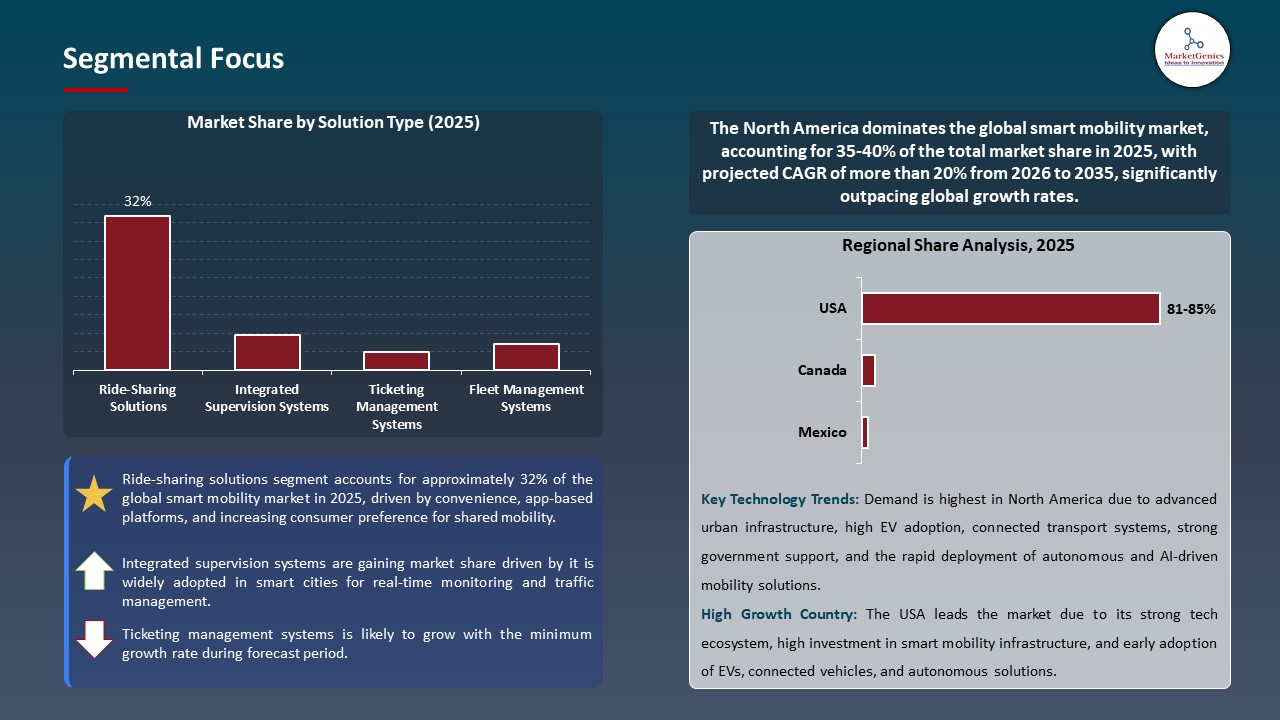
Ride-Sharing Solutions Dominate Global Smart Mobility Market
-
The ride-sharing solutions leads the smart mobility market due to the necessity to introduce efficient, cost-effective, and eco-friendly urban transportation that can minimize traffic jams and enhance the accessibility of commuters.
- AI empowered, multi-modal ride-sharing systems are quickly being implemented which enables real time fleet management, predictive routing and dynamic ride matching, to improve user experience and operational efficiencies. For instance, Uber and Waymo are increasing collaboration to introduce autonomous ride-sharing to such cities as Austin and Atlanta where customers can order driverless rides via the Uber platform and that will expedite the deployment of next-generation ride-sharing solutions into urban mobility networks.
- Scalability, ecosystem integration, and city partnerships enhance the hegemony of the ride-sharing solutions in the global smart mobility market.
North America Leads Global Smart Mobility Market Demand
-
North America leads the market as it is the first region to embrace the benefits of sophisticated smart mobility solutions, strong digital foundations and heavy investments in AI-based transport systems, which enhance traffic flow, safety, and passenger experience.
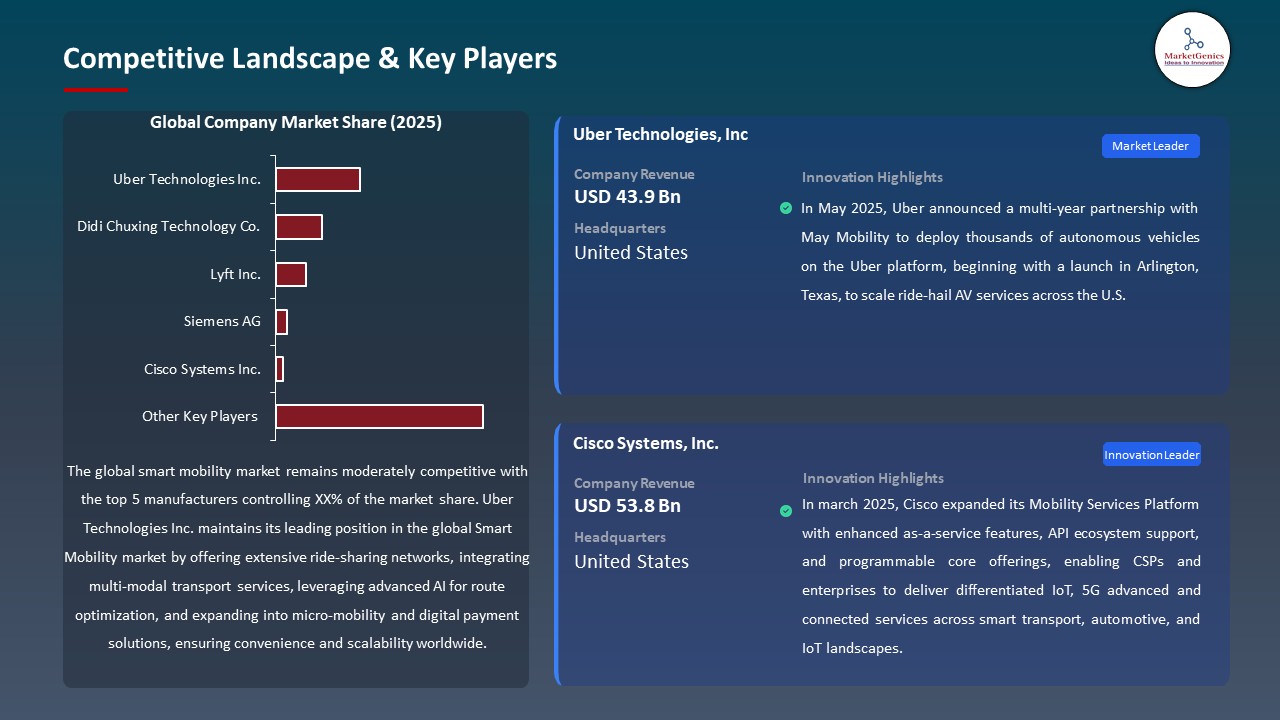
- The application of AI-powered and multi-modal smart mobility technologies is expanding at a high pace, and autonomous ride-hailing delivery, auto-connected vehicle ecosystems, and smart traffic control can be found almost everywhere. For instance, May 2025, Uber Technologies Inc. collaborated with May Mobility to roll out autonomous vehicles on Uber platform in Arlington, Texas, marking the first stage in rolling out AVs on large scale in urban transit systems within the US.
- Better R&D, enabling policies and tech–city alliances consolidate the smart mobility leadership in North America.
Smart Mobility Market Ecosystem
The smart mobility market is moderately consolidated and the competition is based on connected mobility platforms, real-time traffic analytics, IoT-enabled transport solutions, autonomous vehicle technologies, and data-driven fleet management. The fact that Uber Technologies Inc., Didi Chuxing Technology Co., Lyft Inc., Siemens AG, and Cisco Systems Inc. exist implies why the market share is that large because they facilitate built-in smart mobility ecosystems, which include ride-hailing platforms, autonomous and shared mobility solutions, IoT connectivity modules, traffic analytics software, and urban mobility decision-support systems as well.
Uber technologies Inc. is building AI routing and autonomous vehicle integration to streamline the fleet operation. Didi Chuxing is concerned with multi-modes and smart fleet management to make transport in the city efficient. Lyft Inc. combines autonomous pilots and ride-sharing analytics in real-time. The intelligent IoT-based infrastructure and traffic management are offered by Siemens AG. Cisco Systems Inc. provides connected vehicle communication, networking, and cybersecurity products to offer secure and reliable mobility services
Connectivity, data interoperability and AI-based mobility analytics are developing fast because of government-backed smart cities, increased implementation of shared and autonomous transportation systems, and collaboration with mobility startups, urban planners, and OEMs. These ecosystem interactions enhance competitive differentiation, facilitate the introduction of extensive connected transportation systems, and hasten the adoption of autonomous, shared and data-driven urban mobility systems, so the global smart mobility market moves to work towards efficiency, congestion reduction, and sustainable urban transportation.
 Recent Development and Strategic Overview
-
In December 2025, EHang co‑hosted the first China Spain Smart Mobility Forum in Madrid and showcased its EH216‑S pilotless eVTOL at Telefónica’s Innovation Hub, highlighting cross‑border collaboration and innovation in next‑generation smart mobility solutions.
- In October 2025, IDEMIA Public Security collaborated with SAMI Advanced Electronics to design and implement high-tech biometric, transport, and smart mobility solutions in Saudi Arabia, which can expedite the process of digital transformation and convenient mobility.
Report Scope
|
Detail |
|
|
Market Size in 2025 |
USD 53.5 Bn |
|
Market Forecast Value in 2035 |
USD 289.6 Bn |
|
Growth Rate (CAGR) |
18.4% |
|
Forecast Period |
2026 – 2035 |
|
Historical Data Available for |
2021 – 2024 |
|
Market Size Units |
US$ Billion for Value Thousand Units for Volume |
|
Report Format |
Electronic (PDF) + Excel |
|
North America |
Europe |
Asia Pacific |
Middle East |
Africa |
South America |
|
|
|
|
|
|
|
Companies Covered |
|||||
|
|
|
|
|
|
Smart Mobility Market Segmentation and Highlights
|
Segment |
Sub-segment |
|
Smart Mobility Market, By Solution Type |
|
|
Smart Mobility Market, By Transportation Mode |
|
|
Smart Mobility Market, By Technology |
|
|
Smart Mobility Market, By Connectivity |
|
|
Smart Mobility Market, By Ownership Model |
|
Frequently Asked Questions
Table of Contents
- 1. Research Methodology and Assumptions
- 1.1. Definitions
- 1.2. Research Design and Approach
- 1.3. Data Collection Methods
- 1.4. Base Estimates and Calculations
- 1.5. Forecasting Models
- 1.5.1. Key Forecast Factors & Impact Analysis
- 1.6. Secondary Research
- 1.6.1. Open Sources
- 1.6.2. Paid Databases
- 1.6.3. Associations
- 1.7. Primary Research
- 1.7.1. Primary Sources
- 1.7.2. Primary Interviews with Stakeholders across Ecosystem
- 2. Executive Summary
- 2.1. Global Smart Mobility Market Outlook
- 2.1.1. Smart Mobility Market Size (Volume - Thousand Units & Value - US$ Bn), and Forecasts, 2021-2035
- 2.1.2. Compounded Annual Growth Rate Analysis
- 2.1.3. Growth Opportunity Analysis
- 2.1.4. Segmental Share Analysis
- 2.1.5. Geographical Share Analysis
- 2.2. Market Analysis and Facts
- 2.3. Supply-Demand Analysis
- 2.4. Competitive Benchmarking
- 2.5. Go-to- Market Strategy
- 2.5.1. Customer/ End-use Industry Assessment
- 2.5.2. Growth Opportunity Data, 2026-2035
- 2.5.2.1. Regional Data
- 2.5.2.2. Country Data
- 2.5.2.3. Segmental Data
- 2.5.3. Identification of Potential Market Spaces
- 2.5.4. GAP Analysis
- 2.5.5. Potential Attractive Price Points
- 2.5.6. Prevailing Market Risks & Challenges
- 2.5.7. Preferred Sales & Marketing Strategies
- 2.5.8. Key Recommendations and Analysis
- 2.5.9. A Way Forward
- 2.1. Global Smart Mobility Market Outlook
- 3. Industry Data and Premium Insights
- 3.1. Global Industry Overview, 2025
- 3.1.1. Automotive & Transportation Industry Ecosystem Analysis
- 3.1.2. Key Trends for Automotive & Transportation Industry
- 3.1.3. Regional Distribution for Automotive & Transportation Industry
- 3.2. Supplier Customer Data
- 3.3. Technology Roadmap and Developments
- 3.4. Trade Analysis
- 3.4.1. Import & Export Analysis, 2025
- 3.4.2. Top Importing Countries
- 3.4.3. Top Exporting Countries
- 3.5. Trump Tariff Impact Analysis
- 3.5.1. Manufacturer
- 3.5.1.1. Based on the component & Raw material
- 3.5.2. Supply Chain
- 3.5.3. End Consumer
- 3.5.1. Manufacturer
- 3.6. Raw Material Analysis
- 3.1. Global Industry Overview, 2025
- 4. Market Overview
- 4.1. Market Dynamics
- 4.1.1. Drivers
- 4.1.1.1. Rapid urbanization driving demand for efficient, sustainable transportation solutions.
- 4.1.1.2. Technological advancements in AI, IoT, connectivity, and big data analytics.
- 4.1.1.3. Environmental concerns and government initiatives for reducing emissions and supporting smart transport.
- 4.1.2. Restraints
- 4.1.2.1. High infrastructure and deployment costs, including smart systems and EV infrastructure.
- 4.1.2.2. Infrastructure limitations, data privacy/security concerns, and regulatory challenges.
- 4.1.1. Drivers
- 4.2. Key Trend Analysis
- 4.3. Regulatory Framework
- 4.3.1. Key Regulations, Norms, and Subsidies, by Key Countries
- 4.3.2. Tariffs and Standards
- 4.3.3. Impact Analysis of Regulations on the Market
- 4.4. Value Chain Analysis
- 4.5. Porter’s Five Forces Analysis
- 4.6. PESTEL Analysis
- 4.7. Global Smart Mobility Market Demand
- 4.7.1. Historical Market Size – (Volume - Thousand Units & Value - US$ Bn), 2020-2024
- 4.7.2. Current and Future Market Size – (Volume - Thousand Units & Value - US$ Bn), 2026–2035
- 4.7.2.1. Y-o-Y Growth Trends
- 4.7.2.2. Absolute $ Opportunity Assessment
- 4.1. Market Dynamics
- 5. Competition Landscape
- 5.1. Competition structure
- 5.1.1. Fragmented v/s consolidated
- 5.2. Company Share Analysis, 2025
- 5.2.1. Global Company Market Share
- 5.2.2. By Region
- 5.2.2.1. North America
- 5.2.2.2. Europe
- 5.2.2.3. Asia Pacific
- 5.2.2.4. Middle East
- 5.2.2.5. Africa
- 5.2.2.6. South America
- 5.3. Product Comparison Matrix
- 5.3.1. Specifications
- 5.3.2. Market Positioning
- 5.3.3. Pricing
- 5.1. Competition structure
- 6. Global Smart Mobility Market Analysis, by Solution Type
- 6.1. Key Segment Analysis
- 6.2. Smart Mobility Market Size (Volume - Thousand Units & Value - US$ Bn), Analysis, and Forecasts, by Solution Type, 2021-2035
- 6.2.1. Traffic Management Systems
- 6.2.2. Parking Management Systems
- 6.2.3. Integrated Supervision Systems
- 6.2.4. Ticketing Management Systems
- 6.2.5. Fleet Management Systems
- 6.2.6. Ride-Sharing Solutions
- 6.2.7. Mobility-as-a-Service (MaaS) Platforms
- 6.2.8. Navigation Systems
- 6.2.9. Insurance Telematics
- 6.2.10. Others
- 7. Global Smart Mobility Market Analysis, by Transportation Mode
- 7.1. Key Segment Analysis
- 7.2. Smart Mobility Market Size (Volume - Thousand Units & Value - US$ Bn), Analysis, and Forecasts, by Transportation Mode, 2021-2035
- 7.2.1. Roadways
- 7.2.1.1. Private Vehicles
- 7.2.1.2. Public Buses
- 7.2.1.3. Taxis and Ride-Hailing
- 7.2.1.4. Bicycles and E-bikes
- 7.2.1.5. Others
- 7.2.2. Railways
- 7.2.2.1. Metro/Subway
- 7.2.2.2. High-Speed Trains
- 7.2.2.3. Commuter Rails
- 7.2.3. Airways
- 7.2.4. Waterways
- 7.2.5. Multimodal Transportation
- 7.2.1. Roadways
- 8. Global Smart Mobility Market Analysis, by Technology
- 8.1. Key Segment Analysis
- 8.2. Smart Mobility Market Size (Volume - Thousand Units & Value - US$ Bn), Analysis, and Forecasts, by Technology, 2021-2035
- 8.2.1. Artificial Intelligence (AI) and Machine Learning
- 8.2.2. Internet of Things (IoT)
- 8.2.3. Big Data Analytics
- 8.2.4. Cloud Computing
- 8.2.5. 5G Connectivity
- 8.2.6. Blockchain
- 8.2.7. Edge Computing
- 8.2.8. GPS/GNSS Technologies
- 8.2.9. Others
- 9. Global Smart Mobility Market Analysis, by Connectivity
- 9.1. Key Segment Analysis
- 9.2. Smart Mobility Market Size (Volume - Thousand Units & Value - US$ Bn), Analysis, and Forecasts, by Connectivity, 2021-2035
- 9.2.1. Vehicle-to-Vehicle (V2V)
- 9.2.2. Vehicle-to-Infrastructure (V2I)
- 9.2.3. Vehicle-to-Pedestrian (V2P)
- 9.2.4. Vehicle-to-Everything (V2X)
- 9.2.5. Vehicle-to-Cloud (V2C)
- 9.2.6. Vehicle-to-Grid (V2G)
- 10. Global Smart Mobility Market Analysis, by Ownership Model
- 10.1. Key Segment Analysis
- 10.2. Smart Mobility Market Size (Volume - Thousand Units & Value - US$ Bn), Analysis, and Forecasts, by Ownership Model, 2021-2035
- 10.2.1. Individual Ownership
- 10.2.2. Shared Mobility
- 10.2.3. Corporate/Fleet Ownership
- 10.2.4. Subscription-Based Models
- 11. Global Smart Mobility Market Analysis and Forecasts, by Region
- 11.1. Key Findings
- 11.2. Smart Mobility Market Size (Volume - Thousand Units & Value - US$ Bn), Analysis, and Forecasts, by Region, 2021-2035
- 11.2.1. North America
- 11.2.2. Europe
- 11.2.3. Asia Pacific
- 11.2.4. Middle East
- 11.2.5. Africa
- 11.2.6. South America
- 12. North America Smart Mobility Market Analysis
- 12.1. Key Segment Analysis
- 12.2. Regional Snapshot
- 12.3. North America Smart Mobility Market Size (Volume - Thousand Units & Value - US$ Bn), Analysis, and Forecasts, 2021-2035
- 12.3.1. Solution Type
- 12.3.2. Transportation Mode
- 12.3.3. Technology
- 12.3.4. Connectivity
- 12.3.5. Ownership Model
- 12.3.6. Country
- 12.3.6.1. USA
- 12.3.6.2. Canada
- 12.3.6.3. Mexico
- 12.4. USA Smart Mobility Market
- 12.4.1. Country Segmental Analysis
- 12.4.2. Solution Type
- 12.4.3. Transportation Mode
- 12.4.4. Technology
- 12.4.5. Connectivity
- 12.4.6. Ownership Model
- 12.5. Canada Smart Mobility Market
- 12.5.1. Country Segmental Analysis
- 12.5.2. Solution Type
- 12.5.3. Transportation Mode
- 12.5.4. Technology
- 12.5.5. Connectivity
- 12.5.6. Ownership Model
- 12.6. Mexico Smart Mobility Market
- 12.6.1. Country Segmental Analysis
- 12.6.2. Solution Type
- 12.6.3. Transportation Mode
- 12.6.4. Technology
- 12.6.5. Connectivity
- 12.6.6. Ownership Model
- 13. Europe Smart Mobility Market Analysis
- 13.1. Key Segment Analysis
- 13.2. Regional Snapshot
- 13.3. Europe Smart Mobility Market Size (Volume - Thousand Units & Value - US$ Bn), Analysis, and Forecasts, 2021-2035
- 13.3.1. Solution Type
- 13.3.2. Transportation Mode
- 13.3.3. Technology
- 13.3.4. Connectivity
- 13.3.5. Ownership Model
- 13.3.6. Country
- 13.3.6.1. Germany
- 13.3.6.2. United Kingdom
- 13.3.6.3. France
- 13.3.6.4. Italy
- 13.3.6.5. Spain
- 13.3.6.6. Netherlands
- 13.3.6.7. Nordic Countries
- 13.3.6.8. Poland
- 13.3.6.9. Russia & CIS
- 13.3.6.10. Rest of Europe
- 13.4. Germany Smart Mobility Market
- 13.4.1. Country Segmental Analysis
- 13.4.2. Solution Type
- 13.4.3. Transportation Mode
- 13.4.4. Technology
- 13.4.5. Connectivity
- 13.4.6. Ownership Model
- 13.5. United Kingdom Smart Mobility Market
- 13.5.1. Country Segmental Analysis
- 13.5.2. Solution Type
- 13.5.3. Transportation Mode
- 13.5.4. Technology
- 13.5.5. Connectivity
- 13.5.6. Ownership Model
- 13.6. France Smart Mobility Market
- 13.6.1. Country Segmental Analysis
- 13.6.2. Solution Type
- 13.6.3. Transportation Mode
- 13.6.4. Technology
- 13.6.5. Connectivity
- 13.6.6. Ownership Model
- 13.7. Italy Smart Mobility Market
- 13.7.1. Country Segmental Analysis
- 13.7.2. Solution Type
- 13.7.3. Transportation Mode
- 13.7.4. Technology
- 13.7.5. Connectivity
- 13.7.6. Ownership Model
- 13.8. Spain Smart Mobility Market
- 13.8.1. Country Segmental Analysis
- 13.8.2. Solution Type
- 13.8.3. Transportation Mode
- 13.8.4. Technology
- 13.8.5. Connectivity
- 13.8.6. Ownership Model
- 13.9. Netherlands Smart Mobility Market
- 13.9.1. Country Segmental Analysis
- 13.9.2. Solution Type
- 13.9.3. Transportation Mode
- 13.9.4. Technology
- 13.9.5. Connectivity
- 13.9.6. Ownership Model
- 13.10. Nordic Countries Smart Mobility Market
- 13.10.1. Country Segmental Analysis
- 13.10.2. Solution Type
- 13.10.3. Transportation Mode
- 13.10.4. Technology
- 13.10.5. Connectivity
- 13.10.6. Ownership Model
- 13.11. Poland Smart Mobility Market
- 13.11.1. Country Segmental Analysis
- 13.11.2. Solution Type
- 13.11.3. Transportation Mode
- 13.11.4. Technology
- 13.11.5. Connectivity
- 13.11.6. Ownership Model
- 13.12. Russia & CIS Smart Mobility Market
- 13.12.1. Country Segmental Analysis
- 13.12.2. Solution Type
- 13.12.3. Transportation Mode
- 13.12.4. Technology
- 13.12.5. Connectivity
- 13.12.6. Ownership Model
- 13.13. Rest of Europe Smart Mobility Market
- 13.13.1. Country Segmental Analysis
- 13.13.2. Solution Type
- 13.13.3. Transportation Mode
- 13.13.4. Technology
- 13.13.5. Connectivity
- 13.13.6. Ownership Model
- 14. Asia Pacific Smart Mobility Market Analysis
- 14.1. Key Segment Analysis
- 14.2. Regional Snapshot
- 14.3. Asia Pacific Smart Mobility Market Size (Volume - Thousand Units & Value - US$ Bn), Analysis, and Forecasts, 2021-2035
- 14.3.1. Solution Type
- 14.3.2. Transportation Mode
- 14.3.3. Technology
- 14.3.4. Connectivity
- 14.3.5. Ownership Model
- 14.3.6. Country
- 14.3.6.1. China
- 14.3.6.2. India
- 14.3.6.3. Japan
- 14.3.6.4. South Korea
- 14.3.6.5. Australia and New Zealand
- 14.3.6.6. Indonesia
- 14.3.6.7. Malaysia
- 14.3.6.8. Thailand
- 14.3.6.9. Vietnam
- 14.3.6.10. Rest of Asia Pacific
- 14.4. China Smart Mobility Market
- 14.4.1. Country Segmental Analysis
- 14.4.2. Solution Type
- 14.4.3. Transportation Mode
- 14.4.4. Technology
- 14.4.5. Connectivity
- 14.4.6. Ownership Model
- 14.5. India Smart Mobility Market
- 14.5.1. Country Segmental Analysis
- 14.5.2. Solution Type
- 14.5.3. Transportation Mode
- 14.5.4. Technology
- 14.5.5. Connectivity
- 14.5.6. Ownership Model
- 14.6. Japan Smart Mobility Market
- 14.6.1. Country Segmental Analysis
- 14.6.2. Solution Type
- 14.6.3. Transportation Mode
- 14.6.4. Technology
- 14.6.5. Connectivity
- 14.6.6. Ownership Model
- 14.7. South Korea Smart Mobility Market
- 14.7.1. Country Segmental Analysis
- 14.7.2. Solution Type
- 14.7.3. Transportation Mode
- 14.7.4. Technology
- 14.7.5. Connectivity
- 14.7.6. Ownership Model
- 14.8. Australia and New Zealand Smart Mobility Market
- 14.8.1. Country Segmental Analysis
- 14.8.2. Solution Type
- 14.8.3. Transportation Mode
- 14.8.4. Technology
- 14.8.5. Connectivity
- 14.8.6. Ownership Model
- 14.9. Indonesia Smart Mobility Market
- 14.9.1. Country Segmental Analysis
- 14.9.2. Solution Type
- 14.9.3. Transportation Mode
- 14.9.4. Technology
- 14.9.5. Connectivity
- 14.9.6. Ownership Model
- 14.10. Malaysia Smart Mobility Market
- 14.10.1. Country Segmental Analysis
- 14.10.2. Solution Type
- 14.10.3. Transportation Mode
- 14.10.4. Technology
- 14.10.5. Connectivity
- 14.10.6. Ownership Model
- 14.11. Thailand Smart Mobility Market
- 14.11.1. Country Segmental Analysis
- 14.11.2. Solution Type
- 14.11.3. Transportation Mode
- 14.11.4. Technology
- 14.11.5. Connectivity
- 14.11.6. Ownership Model
- 14.12. Vietnam Smart Mobility Market
- 14.12.1. Country Segmental Analysis
- 14.12.2. Solution Type
- 14.12.3. Transportation Mode
- 14.12.4. Technology
- 14.12.5. Connectivity
- 14.12.6. Ownership Model
- 14.13. Rest of Asia Pacific Smart Mobility Market
- 14.13.1. Country Segmental Analysis
- 14.13.2. Solution Type
- 14.13.3. Transportation Mode
- 14.13.4. Technology
- 14.13.5. Connectivity
- 14.13.6. Ownership Model
- 15. Middle East Smart Mobility Market Analysis
- 15.1. Key Segment Analysis
- 15.2. Regional Snapshot
- 15.3. Middle East Smart Mobility Market Size (Volume - Thousand Units & Value - US$ Bn), Analysis, and Forecasts, 2021-2035
- 15.3.1. Solution Type
- 15.3.2. Transportation Mode
- 15.3.3. Technology
- 15.3.4. Connectivity
- 15.3.5. Ownership Model
- 15.3.6. Country
- 15.3.6.1. Turkey
- 15.3.6.2. UAE
- 15.3.6.3. Saudi Arabia
- 15.3.6.4. Israel
- 15.3.6.5. Rest of Middle East
- 15.4. Turkey Smart Mobility Market
- 15.4.1. Country Segmental Analysis
- 15.4.2. Solution Type
- 15.4.3. Transportation Mode
- 15.4.4. Technology
- 15.4.5. Connectivity
- 15.4.6. Ownership Model
- 15.5. UAE Smart Mobility Market
- 15.5.1. Country Segmental Analysis
- 15.5.2. Solution Type
- 15.5.3. Transportation Mode
- 15.5.4. Technology
- 15.5.5. Connectivity
- 15.5.6. Ownership Model
- 15.6. Saudi Arabia Smart Mobility Market
- 15.6.1. Country Segmental Analysis
- 15.6.2. Solution Type
- 15.6.3. Transportation Mode
- 15.6.4. Technology
- 15.6.5. Connectivity
- 15.6.6. Ownership Model
- 15.7. Israel Smart Mobility Market
- 15.7.1. Country Segmental Analysis
- 15.7.2. Solution Type
- 15.7.3. Transportation Mode
- 15.7.4. Technology
- 15.7.5. Connectivity
- 15.7.6. Ownership Model
- 15.8. Rest of Middle East Smart Mobility Market
- 15.8.1. Country Segmental Analysis
- 15.8.2. Solution Type
- 15.8.3. Transportation Mode
- 15.8.4. Technology
- 15.8.5. Connectivity
- 15.8.6. Ownership Model
- 16. Africa Smart Mobility Market Analysis
- 16.1. Key Segment Analysis
- 16.2. Regional Snapshot
- 16.3. Africa Smart Mobility Market Size (Volume - Thousand Units & Value - US$ Bn), Analysis, and Forecasts, 2021-2035
- 16.3.1. Solution Type
- 16.3.2. Transportation Mode
- 16.3.3. Technology
- 16.3.4. Connectivity
- 16.3.5. Ownership Model
- 16.3.6. Country
- 16.3.6.1. South Africa
- 16.3.6.2. Egypt
- 16.3.6.3. Nigeria
- 16.3.6.4. Algeria
- 16.3.6.5. Rest of Africa
- 16.4. South Africa Smart Mobility Market
- 16.4.1. Country Segmental Analysis
- 16.4.2. Solution Type
- 16.4.3. Transportation Mode
- 16.4.4. Technology
- 16.4.5. Connectivity
- 16.4.6. Ownership Model
- 16.5. Egypt Smart Mobility Market
- 16.5.1. Country Segmental Analysis
- 16.5.2. Solution Type
- 16.5.3. Transportation Mode
- 16.5.4. Technology
- 16.5.5. Connectivity
- 16.5.6. Ownership Model
- 16.6. Nigeria Smart Mobility Market
- 16.6.1. Country Segmental Analysis
- 16.6.2. Solution Type
- 16.6.3. Transportation Mode
- 16.6.4. Technology
- 16.6.5. Connectivity
- 16.6.6. Ownership Model
- 16.7. Algeria Smart Mobility Market
- 16.7.1. Country Segmental Analysis
- 16.7.2. Solution Type
- 16.7.3. Transportation Mode
- 16.7.4. Technology
- 16.7.5. Connectivity
- 16.7.6. Ownership Model
- 16.8. Rest of Africa Smart Mobility Market
- 16.8.1. Country Segmental Analysis
- 16.8.2. Solution Type
- 16.8.3. Transportation Mode
- 16.8.4. Technology
- 16.8.5. Connectivity
- 16.8.6. Ownership Model
- 17. South America Smart Mobility Market Analysis
- 17.1. Key Segment Analysis
- 17.2. Regional Snapshot
- 17.3. South America Smart Mobility Market Size (Volume - Thousand Units & Value - US$ Bn), Analysis, and Forecasts, 2021-2035
- 17.3.1. Solution Type
- 17.3.2. Transportation Mode
- 17.3.3. Technology
- 17.3.4. Connectivity
- 17.3.5. Ownership Model
- 17.3.6. Country
- 17.3.6.1. Brazil
- 17.3.6.2. Argentina
- 17.3.6.3. Rest of South America
- 17.4. Brazil Smart Mobility Market
- 17.4.1. Country Segmental Analysis
- 17.4.2. Solution Type
- 17.4.3. Transportation Mode
- 17.4.4. Technology
- 17.4.5. Connectivity
- 17.4.6. Ownership Model
- 17.5. Argentina Smart Mobility Market
- 17.5.1. Country Segmental Analysis
- 17.5.2. Solution Type
- 17.5.3. Transportation Mode
- 17.5.4. Technology
- 17.5.5. Connectivity
- 17.5.6. Ownership Model
- 17.6. Rest of South America Smart Mobility Market
- 17.6.1. Country Segmental Analysis
- 17.6.2. Solution Type
- 17.6.3. Transportation Mode
- 17.6.4. Technology
- 17.6.5. Connectivity
- 17.6.6. Ownership Model
- 18. Key Players/ Company Profile
- 18.1. Alstom SA.
- 18.1.1. Company Details/ Overview
- 18.1.2. Company Financials
- 18.1.3. Key Customers and Competitors
- 18.1.4. Business/ Industry Portfolio
- 18.1.5. Product Portfolio/ Specification Details
- 18.1.6. Pricing Data
- 18.1.7. Strategic Overview
- 18.1.8. Recent Developments
- 18.2. BlaBlaCar
- 18.3. BluSmart Mobility
- 18.4. Cisco Systems Inc.
- 18.5. Conduent Inc.
- 18.6. Cubic Corporation
- 18.7. Didi Chuxing Technology Co
- 18.8. Grab Holdings Inc.
- 18.9. Here Technologies
- 18.10. Hitachi, Ltd.
- 18.11. IBM Corporation
- 18.12. Kapsch TrafficCom AG
- 18.13. Lyft Inc.
- 18.14. Moovit (Intel)
- 18.15. Ola Cabs
- 18.16. Siemens AG
- 18.17. Thales Group
- 18.18. TomTom International BV
- 18.19. Uber Technologies Inc
- 18.20. Yulu Bikes
- 18.21. Other Key Players
- 18.1. Alstom SA.
Note* - This is just tentative list of players. While providing the report, we will cover more number of players based on their revenue and share for each geography
Research Design
Our research design integrates both demand-side and supply-side analysis through a balanced combination of primary and secondary research methodologies. By utilizing both bottom-up and top-down approaches alongside rigorous data triangulation methods, we deliver robust market intelligence that supports strategic decision-making.
MarketGenics' comprehensive research design framework ensures the delivery of accurate, reliable, and actionable market intelligence. Through the integration of multiple research approaches, rigorous validation processes, and expert analysis, we provide our clients with the insights needed to make informed strategic decisions and capitalize on market opportunities.

MarketGenics leverages a dedicated industry panel of experts and a comprehensive suite of paid databases to effectively collect, consolidate, and analyze market intelligence.
Our approach has consistently proven to be reliable and effective in generating accurate market insights, identifying key industry trends, and uncovering emerging business opportunities.
Through both primary and secondary research, we capture and analyze critical company-level data such as manufacturing footprints, including technical centers, R&D facilities, sales offices, and headquarters.
Our expert panel further enhances our ability to estimate market size for specific brands based on validated field-level intelligence.
Our data mining techniques incorporate both parametric and non-parametric methods, allowing for structured data collection, sorting, processing, and cleaning.
Demand projections are derived from large-scale data sets analyzed through proprietary algorithms, culminating in robust and reliable market sizing.
Research Approach
The bottom-up approach builds market estimates by starting with the smallest addressable market units and systematically aggregating them to create comprehensive market size projections.
This method begins with specific, granular data points and builds upward to create the complete market landscape.
Customer Analysis → Segmental Analysis → Geographical Analysis
The top-down approach starts with the broadest possible market data and systematically narrows it down through a series of filters and assumptions to arrive at specific market segments or opportunities.
This method begins with the big picture and works downward to increasingly specific market slices.
TAM → SAM → SOM


Research Methods
Desk / Secondary Research
While analysing the market, we extensively study secondary sources, directories, and databases to identify and collect information useful for this technical, market-oriented, and commercial report. Secondary sources that we utilize are not only the public sources, but it is a combination of Open Source, Associations, Paid Databases, MG Repository & Knowledgebase, and others.
- Company websites, annual reports, financial reports, broker reports, and investor presentations
- National government documents, statistical databases and reports
- News articles, press releases and web-casts specific to the companies operating in the market, Magazines, reports, and others
- We gather information from commercial data sources for deriving company specific data such as segmental revenue, share for geography, product revenue, and others
- Internal and external proprietary databases (industry-specific), relevant patent, and regulatory databases
- Governing Bodies, Government Organizations
- Relevant Authorities, Country-specific Associations for Industries
We also employ the model mapping approach to estimate the product level market data through the players' product portfolio
Primary Research
Primary research/ interviews is vital in analyzing the market. Most of the cases involves paid primary interviews. Primary sources include primary interviews through e-mail interactions, telephonic interviews, surveys as well as face-to-face interviews with the different stakeholders across the value chain including several industry experts.
| Type of Respondents | Number of Primaries |
|---|---|
| Tier 2/3 Suppliers | ~20 |
| Tier 1 Suppliers | ~25 |
| End-users | ~25 |
| Industry Expert/ Panel/ Consultant | ~30 |
| Total | ~100 |
MG Knowledgebase
• Repository of industry blog, newsletter and case studies
• Online platform covering detailed market reports, and company profiles
Forecasting Factors and Models
Forecasting Factors
- Historical Trends – Past market patterns, cycles, and major events that shaped how markets behave over time. Understanding past trends helps predict future behavior.
- Industry Factors – Specific characteristics of the industry like structure, regulations, and innovation cycles that affect market dynamics.
- Macroeconomic Factors – Economic conditions like GDP growth, inflation, and employment rates that affect how much money people have to spend.
- Demographic Factors – Population characteristics like age, income, and location that determine who can buy your product.
- Technology Factors – How quickly people adopt new technology and how much technology infrastructure exists.
- Regulatory Factors – Government rules, laws, and policies that can help or restrict market growth.
- Competitive Factors – Analyzing competition structure such as degree of competition and bargaining power of buyers and suppliers.
Forecasting Models / Techniques
Multiple Regression Analysis
- Identify and quantify factors that drive market changes
- Statistical modeling to establish relationships between market drivers and outcomes
Time Series Analysis – Seasonal Patterns
- Understand regular cyclical patterns in market demand
- Advanced statistical techniques to separate trend, seasonal, and irregular components
Time Series Analysis – Trend Analysis
- Identify underlying market growth patterns and momentum
- Statistical analysis of historical data to project future trends
Expert Opinion – Expert Interviews
- Gather deep industry insights and contextual understanding
- In-depth interviews with key industry stakeholders
Multi-Scenario Development
- Prepare for uncertainty by modeling different possible futures
- Creating optimistic, pessimistic, and most likely scenarios
Time Series Analysis – Moving Averages
- Sophisticated forecasting for complex time series data
- Auto-regressive integrated moving average models with seasonal components
Econometric Models
- Apply economic theory to market forecasting
- Sophisticated economic models that account for market interactions
Expert Opinion – Delphi Method
- Harness collective wisdom of industry experts
- Structured, multi-round expert consultation process
Monte Carlo Simulation
- Quantify uncertainty and probability distributions
- Thousands of simulations with varying input parameters
Research Analysis
Our research framework is built upon the fundamental principle of validating market intelligence from both demand and supply perspectives. This dual-sided approach ensures comprehensive market understanding and reduces the risk of single-source bias.
Demand-Side Analysis: We understand end-user/application behavior, preferences, and market needs along with the penetration of the product for specific application.
Supply-Side Analysis: We estimate overall market revenue, analyze the segmental share along with industry capacity, competitive landscape, and market structure.
Validation & Evaluation
Data triangulation is a validation technique that uses multiple methods, sources, or perspectives to examine the same research question, thereby increasing the credibility and reliability of research findings. In market research, triangulation serves as a quality assurance mechanism that helps identify and minimize bias, validate assumptions, and ensure accuracy in market estimates.
- Data Source Triangulation – Using multiple data sources to examine the same phenomenon
- Methodological Triangulation – Using multiple research methods to study the same research question
- Investigator Triangulation – Using multiple researchers or analysts to examine the same data
- Theoretical Triangulation – Using multiple theoretical perspectives to interpret the same data

Custom Market Research Services
We will customise the research for you, in case the report listed above does not meet your requirements.
Get 10% Free Customisation