Urban Mobility Market Size, Share & Trends Analysis Report by Mode of Transport (Shared Mobility, Public Transport, Non-Motorized Transport (e-bikes, Bicycles), Private Vehicles), Shared Mobility Type, Propulsion Type, Service Provider, Booking Platform, Revenue Model, Infrastructure, End-User and Geography (North America, Europe, Asia Pacific, Middle East, Africa, and South America) – Global Industry Data, Trends, and Forecasts, 2026–2035
|
Market Structure & Evolution |
|
|
Segmental Data Insights |
|
|
Demand Trends |
|
|
Competitive Landscape |
|
|
Strategic Development |
|
|
Future Outlook & Opportunities |
|
Urban Mobility Market Size, Share, and Growth
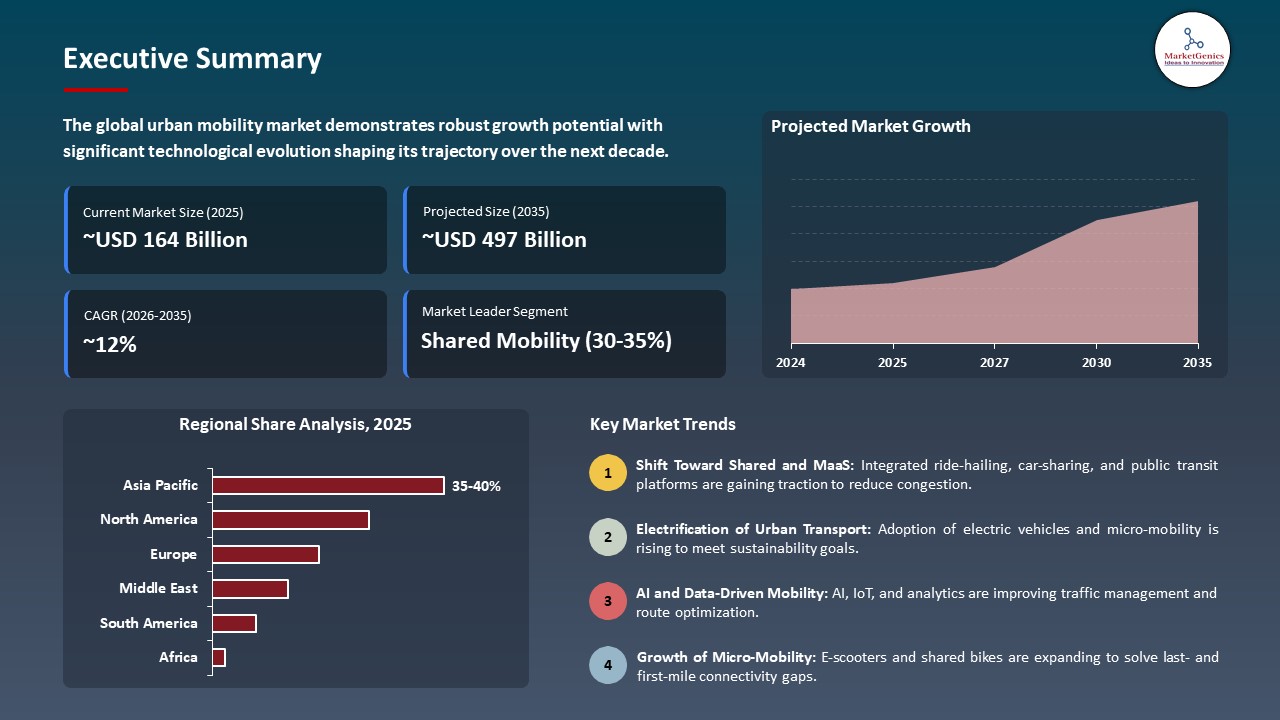
The global urban mobility market is experiencing robust growth, with its estimated value of USD 164.3 billion in the year 2025 and USD 497.4 billion by 2035, registering a CAGR of 11.7% during the forecast period.
Michael Peter, Chief Executive Officer of Siemens Mobility, stated, urbanization is causing the traffic volume to keep increasing, and simultaneously, we want to cut CO emissions by a large margin. This is why the smart connectivity of transportation means is necessary, highlighting the role of AI powered, digitally connected mobility solutions in making urban transport systems more efficient, safer, and environmentally friendly.
The continued increase in urban population will mean that further improvements to existing transport networks will become increasingly important as the demand for urban travel continues to grow. An example of the type of improvements being made by urban centers includes electric bus deployments and other forms of shared mobility (for example, bikes and cars), where all of these services rely heavily on having access to accurate real-time information and digital payments.
There is a huge demand for more efficient and sustainable urban transport systems as the pace of Urbanization increases, as does the rate at which we experience an increase in traffic congestion. The expanding size of metropolitan areas and the increasing number of commuters being served has led to new innovations in this field, including the deployment of large numbers of electric buses and the expansion of shared mobility fleets.
Additionally, many local governments have implemented or will be implementing restrictive government policies, such as low-emission zones (LEZs), mandated electric vehicle (EV) adoption, and investment aid programs to help local transportation agencies adopt new technologies and models for urban mobility. Finally, the convenience of rapidly developing technologies, along with supportive government policy and a growing demand for urban travel, will continue to drive the growth of the urban mobility market.
These adjacent opportunities for the global urban mobility market are intelligent traffic management systems, mobility as a service platform, electric vehicle charging infrastructure, autonomous public transport, and real time passenger information systems. By incorporating these adjacent sectors, mobility providers and technology companies can not only improve integrated transport solutions but also broaden revenue possibilities throughout smart city ecosystems.
Urban Mobility Market Dynamics and Trends
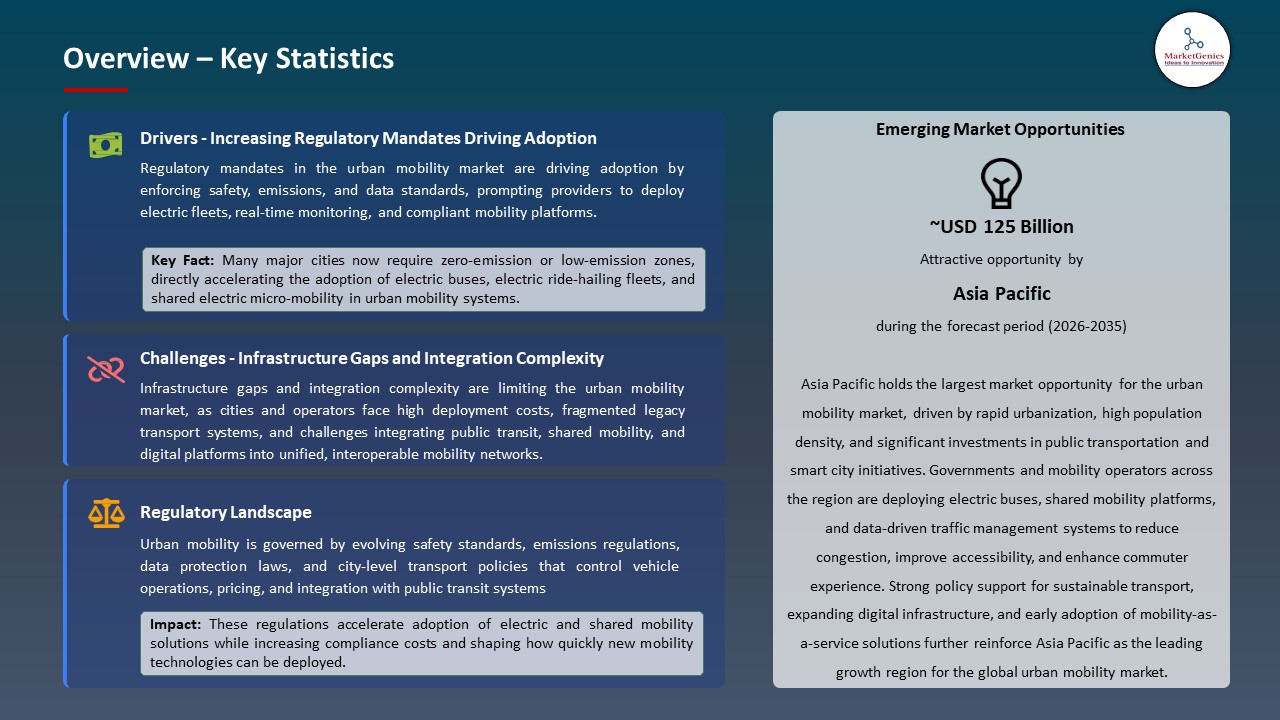
Driver: Increasing Regulatory Mandates Driving Adoption of Advanced Urban Mobility Solutions
-
A significant contributor to the growth of the urban mobility industry is the growing trend toward higher regulatory and quality requirements throughout several industries, including the automobile, medical device, space, and industrial electronics industries. The development of regulations such as ISO 13485 for Medical devices, the IATF 16949 standard for automotive electronics, and IPC standards for printed circuit board designs has created a need in the urban mobility market for organizations to work closely with certified electronic manufacturing service providers, to guarantee that they can provide the latest in traceability, quality assurance, and compliance on an ongoing basis.
- Flex Ltd has recently invested heavily in developing compliance-driven manufacturing capabilities in support of the automotive and healthcare electronic manufacturing segments through the introduction of advanced automated quality and electronic tracking systems to meet the increased demand for compliance with safety and regulatory requirements, representing a shift toward a shift to higher compliance standards in the contract electronics manufacturing sector, which continues to drive growth in the industry.
- The expanding adoption of electronics in safety-related applications, including electric vehicles, medical imaging, and industrial automation, has increased demand for compliance and high-reliability contract urban mobility companies.
Restraint: Infrastructure Gaps and Integration Complexity Limiting Urban Mobility Deployment
-
New regulations have created an opportunity for greater adoption of urban mobility solutions in cities, each city has significant challenges regarding the development of its urban mobility solutions due to an aging road infrastructure and non-consolidated (silo) transportation systems within the urban area. Currently, the majority of cities have transportation systems that remain non-integrated and siloed toward transportation, parking, and traffic management. In addition, the high cost of capital related to electrification, charging infrastructure, and intelligent transportation systems (ITS) makes it difficult for smaller municipalities and developing countries to build modern urban mobility infrastructure.
-
Cities that have invested heavily in modernizing their transportation systems still face significant fragmentation within the systems. For instance, in November 2025, the new metro system was launched in Bhopal, India.
- However, the confusion related to feeder service providers and last-mile connectivity resulted in major traffic delays at key intersections of the city, which prevented commuters from using public transportation, thus demonstrating how historical limitations to supporting urban mobility infrastructure have created significant challenges for the global deployment of seamless urban mobility market.
Opportunity: Expansion in Smart Cities and Government-Led Urban Transport Programs
-
Developed economies in Asia, the Middle East and Latin America have emerged because of rapid growth in the area of Smart City and public transport modernization as the result of Urbanization. In August of 2024, Saudi Arabia's smart mobility project in NEOM will add to the deployment of smart mobility technologies with the addition of autonomous shuttles, electric buses, and AI-based communication and traffic management systems.
- Rapid scaling of shared & electric mobility solutions through public/private partnerships will provide significant opportunities for service delivery mezzanine providers, electric vehicle manufacturers, EV charging infrastructure developers and urban analytics companies because of the rapid scaling of the smart mobility segment of the transportation industry.
Key Trend: Integration of AI, IoT, and Data Platforms Transforming Urban Mobility
-
AI-based traffic analysis, connected vehicles (via IoT), and real-time data solutions are advancing urban mobility through optimal routing, decreased congestion, enhanced commuter experiences, and lower emissions. Cities around the world have started to implement these technologies; with a report from March 2025 that stated all major cities now have Ai adaptive traffic control signal implementations and reduction of travel times due to reduced congestion by an average of 10%.
- The convergence of IoT, digital payment, connected vehicles, and multimodal transportation will change the shape of the urban transport ecosystem and hasten the global adoption of urban mobility solutions.
Urban-Mobility-Market Analysis and Segmental Data
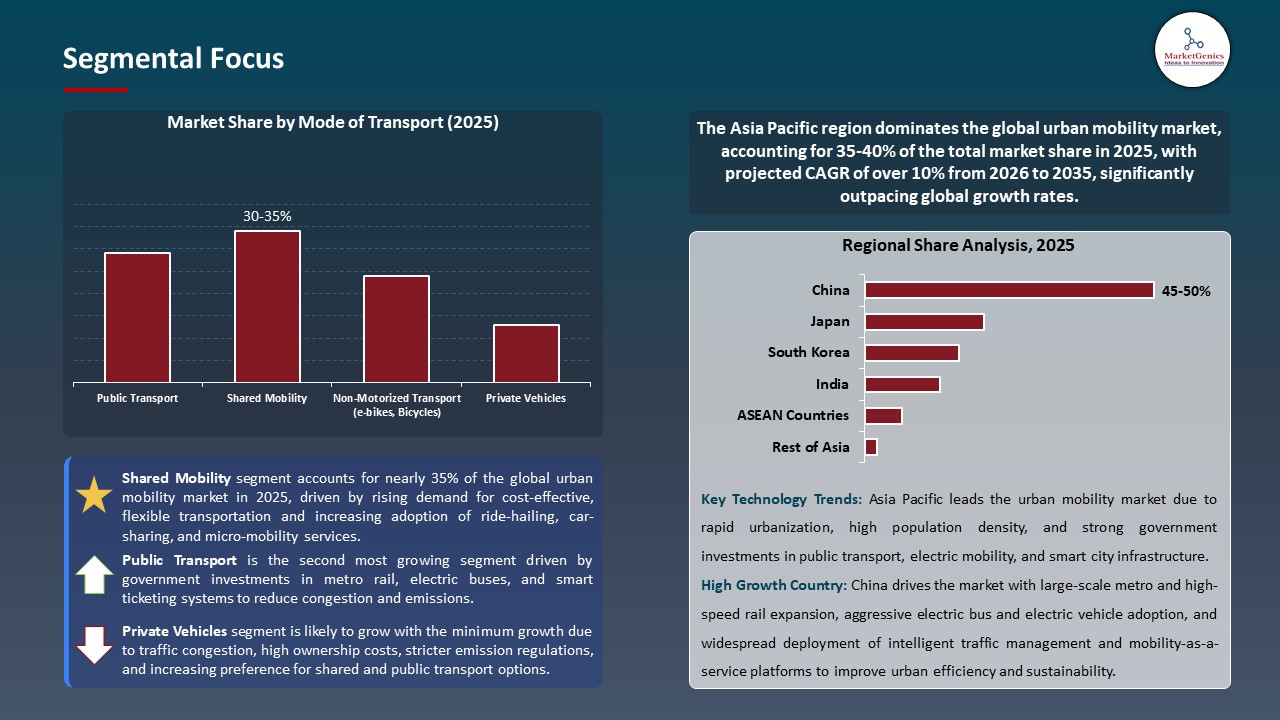
“Shared Mobility Dominates Global Urban Mobility Market amid Rising Urbanization and Cost-Efficient Transportation Demand”
-
While cities continue to grow and become congested at an ever-increasing pace, the global urban mobility market will continue to be dominated by/shared mobility services. Shared mobility allows commuters to access services, such as ride-hailing, bike-sharing, and scooter-sharing, at a much lower cost than owning a vehicle while also utilizing the vehicle more efficiently (more rides per day) and lowering emissions associated with those rides. Young urban residents are particularly attractive to shared mobility services due to their availability through apps, ability to change if preferred, and limited parking and road capacity in their city.
- Moving forward, shared mobility's continued dominance over urban mobility is evidenced by the growth of electric bike and scooter programs between 2024 and 2025 in cities around the world as cities seek to reduce greenhouse gas (GHG) emissions and traffic congestion.
- Furthermore, shared mobility operators have improved the availability and efficiency of their vehicles with the growing use of artificial intelligence (AI) technology to project demand and set pricing dynamically and real-time fleet optimization. Shared mobility will continue to support the growth of the worldwide urban mobility market by fitting into sustainability objectives, decreasing traffic congestion, and providing affordable transportation options.
“Asia Pacific Dominates Urban Mobility Market amid Rapid Urbanization, Smart City Investments, and Expanding Public Transportation Infrastructure”
-
High degree of urbanization, its growing population and rapid investments in smart cities and public transportation infrastructure, Asia Pacific has arisen as the largest region for urban mobility across the world. Dense urban centers combined with increasing passenger demands, as well as governments committing to reduce congestion and CO2 emissions through integrated urban mobility solutions, including metro rail, electric buses, shared use of mobility services, intelligent traffic management systems, etc.
- Large scale infrastructure programs are being undertaken throughout the world by national and city governments in order to foster and promote next generation urban mobility systems through the implementation of large-scale infrastructure investments and the adoption of technology. Examples of the developments occurring in Asian markets to promote next generation urban mobility systems include China's Smart Transportation Initiatives as part of its new urbanization program, India’s smart cities initiative.
- Asian cities are seeing increased urban mobility activity due in large part to the growing demand by both local and foreign private sector providers of urban mobility solutions. In addition, Governments throughout Asia are creating long-term public-private partnerships and providing funding and support for the development of electric and connected urban transportation systems.
Urban-Mobility-Market Ecosystem
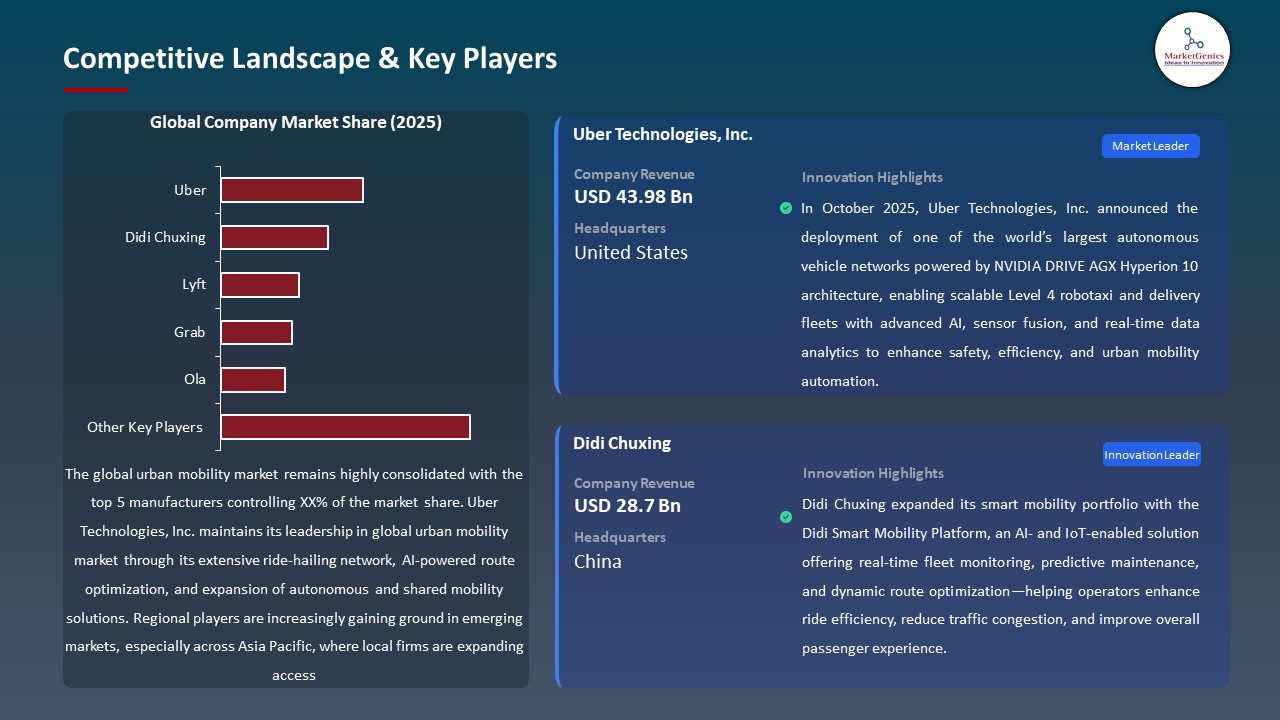
The urban mobility sector has a moderate consolidation level, with the biggest companies (Uber, Didi Chuxing, Grab, Lyft, Bolt, and BlaBlaCar) using data technology, artificial intelligence (AI) for route optimization and large networks of multiple cities to dominate this sector. The dominant players leverage advanced mobile app solutions, analytics in real time, and integrated payment systems that allow for the growth of shared mobility across the different types of mobility (ride-hail, car-share, and micro-mobility).
A growing number of key players are increasingly focused on enhancing their innovation through the introduction of specialized or niche solutions, such as electric-powered two-wheelers and scooters (Lime, Tier Mobility, and Voi), carpooling and long-distance ridesharing solutions (BlaBlaCar), and multimodal journey planner platforms (Moovit and Transit). All of these solutions will address some of the challenges related to congestion, affordability, and first- and last-mile connectivity in dense urban environments.
All of the leading players are emphasizing the importance of diversifying their product portfolios and offering integrated mobility as a service (MaaS) solutions that offer the ability to easily access ride-hail, micro-mobility, integrate public transit, and/or provide subscription-based access to mobility solutions, bettering their sustainability efforts and optimizing their operational efficiencies.
In September 2023, Uber introduced a new feature that uses artificial intelligence to assist in pricing and predicting when people will ask for rides. This new technology makes it easier for Uber to match drivers with nearby requests. It also reduces delays in getting a ride in densely populated areas, and it demonstrates that the urban transportation industry is continuing to innovate.
Recent Development and Strategic Overview:
-
In March 2024, Uber launched its AI-powered Uber Shuttle service throughout many major cities in India. The service used machine learning to allow for better prediction of demand and for dynamic routing, which would ultimately lead to better seat usage and lower emissions per passenger by considering multiple passengers traveling together. The Uber Shuttle service provided a cost-effective and efficient route-sharing transportation solution that aided cities in achieving their congestion goals.
- In May 2024, Grab added a variety of innovative data-driven traffic intelligence features to GrabMaps across Southeast Asia. These new features leveraged AI and real-time location-based mobility data generated from both ride-hailing and delivery vehicles to provide users with more accurate navigation routes and ETAs. This improvement enhanced the effectiveness of multimodal navigation solutions for urban commuters, and provided city planners with anonymized mobility data that can be utilized to facilitate more operationally efficient management of transportation systems.
Report Scope
|
Attribute |
Detail |
|
Market Size in 2025 |
USD 164.3 Bn |
|
Market Forecast Value in 2035 |
USD 497.4 Bn |
|
Growth Rate (CAGR) |
11.7% |
|
Forecast Period |
2026 – 2035 |
|
Historical Data Available for |
2021 – 2024 |
|
Market Size Units |
USD Bn for Value |
|
Report Format |
Electronic (PDF) + Excel |
|
Regions and Countries Covered |
|||||
|
North America |
Europe |
Asia Pacific |
Middle East |
Africa |
South America |
|
|
|
|
|
|
|
Companies Covered |
|||||
|
|
|
|
|
|
Urban-Mobility-Market Segmentation and Highlights
|
Segment |
Sub-segment |
|
Urban Mobility Market, By Mode of Transport |
|
|
Urban Mobility Market, By Shared Mobility Type |
|
|
Urban Mobility Market, By Propulsion Type |
|
|
Urban Mobility Market, By Service Provider |
|
|
Urban Mobility Market, By Booking Platform |
|
|
Urban Mobility Market, By Revenue Model |
|
|
Urban Mobility Market, By Infrastructure |
|
|
Urban Mobility Market, By End-User |
|
Frequently Asked Questions
Table of Contents
- 1. Research Methodology and Assumptions
- 1.1. Definitions
- 1.2. Research Design and Approach
- 1.3. Data Collection Methods
- 1.4. Base Estimates and Calculations
- 1.5. Forecasting Models
- 1.5.1. Key Forecast Factors & Impact Analysis
- 1.6. Secondary Research
- 1.6.1. Open Sources
- 1.6.2. Paid Databases
- 1.6.3. Associations
- 1.7. Primary Research
- 1.7.1. Primary Sources
- 1.7.2. Primary Interviews with Stakeholders across Ecosystem
- 2. Executive Summary
- 2.1. Global Urban Mobility Market Outlook
- 2.1.1. Urban Mobility Market Size (Value - US$ Bn), and Forecasts, 2021-2035
- 2.1.2. Compounded Annual Growth Rate Analysis
- 2.1.3. Growth Opportunity Analysis
- 2.1.4. Segmental Share Analysis
- 2.1.5. Geographical Share Analysis
- 2.2. Market Analysis and Facts
- 2.3. Supply-Demand Analysis
- 2.4. Competitive Benchmarking
- 2.5. Go-to- Market Strategy
- 2.5.1. Customer/ End-use Industry Assessment
- 2.5.2. Growth Opportunity Data, 2026-2035
- 2.5.2.1. Regional Data
- 2.5.2.2. Country Data
- 2.5.2.3. Segmental Data
- 2.5.3. Identification of Potential Market Spaces
- 2.5.4. GAP Analysis
- 2.5.5. Potential Attractive Price Points
- 2.5.6. Prevailing Market Risks & Challenges
- 2.5.7. Preferred Sales & Marketing Strategies
- 2.5.8. Key Recommendations and Analysis
- 2.5.9. A Way Forward
- 2.1. Global Urban Mobility Market Outlook
- 3. Industry Data and Premium Insights
- 3.1. Global Automotive & Transportation Ecosystem Overview, 2025
- 3.1.1. Automotive & Transportation Industry Analysis
- 3.1.2. Key Trends for Automotive & Transportation Industry
- 3.1.3. Regional Distribution for Automotive & Transportation Industry
- 3.2. Supplier Customer Data
- 3.3. Technology Roadmap and Developments
- 3.1. Global Automotive & Transportation Ecosystem Overview, 2025
- 4. Market Overview
- 4.1. Market Dynamics
- 4.1.1. Drivers
- 4.1.1.1. Rising demand for smart mobility solutions, real-time traffic optimization, and autonomous transport systems.
- 4.1.1.2. Growing adoption of AI- and IoT-enabled fleet management, predictive maintenance, and route-planning tools.
- 4.1.1.3. Increasing investments in electric vehicles, connected infrastructure, and smart city mobility platforms.
- 4.1.2. Restraints
- 4.1.2.1. High implementation and operational costs of autonomous and connected mobility solutions.
- 4.1.2.2. Challenges in integrating advanced mobility systems with legacy transport infrastructure, urban planning constraints, and heterogeneous transit networks.
- 4.1.1. Drivers
- 4.2. Key Trend Analysis
- 4.3. Regulatory Framework
- 4.3.1. Key Regulations, Norms, and Subsidies, by Key Countries
- 4.3.2. Tariffs and Standards
- 4.3.3. Impact Analysis of Regulations on the Market
- 4.4. Value Chain Analysis
- 4.4.1. Vehicle Manufacturers/ OEM
- 4.4.2. System Integrators/ Technology Providers
- 4.4.3. Urban Mobility Service Providers
- 4.4.4. End Users/ Customers
- 4.5. Cost Structure Analysis
- 4.6. Porter’s Five Forces Analysis
- 4.7. PESTEL Analysis
- 4.8. Global Urban Mobility Market Demand
- 4.8.1. Historical Market Size –Value (US$ Bn) and Volume (Million Units), 2020-2024
- 4.8.2. Current and Future Market Size –Value (US$ Bn) and Volume (Million Units), 2026–2035
- 4.8.2.1. Y-o-Y Growth Trends
- 4.8.2.2. Absolute $ Opportunity Assessment
- 4.1. Market Dynamics
- 5. Competition Landscape
- 5.1. Competition structure
- 5.1.1. Fragmented v/s consolidated
- 5.2. Company Share Analysis, 2025
- 5.2.1. Global Company Market Share
- 5.2.2. By Region
- 5.2.2.1. North America
- 5.2.2.2. Europe
- 5.2.2.3. Asia Pacific
- 5.2.2.4. Middle East
- 5.2.2.5. Africa
- 5.2.2.6. South America
- 5.3. Product Comparison Matrix
- 5.3.1. Specifications
- 5.3.2. Market Positioning
- 5.3.3. Pricing
- 5.1. Competition structure
- 6. Global Urban Mobility Market Analysis, by Mode of Transport
- 6.1. Key Segment Analysis
- 6.2. Urban Mobility Market Size (Value - US$ Bn), Analysis, and Forecasts, by Mode of Transport, 2021-2035
- 6.2.1. Shared Mobility
- 6.2.2. Public Transport
- 6.2.3. Non-Motorized Transport (e-bikes, Bicycles)
- 6.2.4. Private Vehicles
- 7. Global Urban Mobility Market Analysis, by Shared Mobility Type
- 7.1. Key Segment Analysis
- 7.2. Urban Mobility Market Size (Value - US$ Bn), Analysis, and Forecasts, by Shared Mobility Type, 2021-2035
- 7.2.1. Ride-Hailing Services
- 7.2.2. Car Sharing
- 7.2.3. Bike Sharing
- 7.2.4. E-Scooter Sharing
- 7.2.5. Others
- 8. Global Urban Mobility Market Analysis, by Propulsion Type
- 8.1. Key Segment Analysis
- 8.2. Urban Mobility Market Size (Value - US$ Bn), Analysis, and Forecasts, by Propulsion Type, 2021-2035
- 8.2.1. Electric
- 8.2.2. Hybrid
- 8.2.3. Internal Combustion Engine (ICE)
- 9. Global Urban Mobility Market Analysis, by Service Provider
- 9.1. Key Segment Analysis
- 9.2. Urban Mobility Market Size (Value - US$ Bn), Analysis, and Forecasts, by Service Provider, 2021-2035
- 9.2.1. Service Aggregators
- 9.2.2. OEM-Led Mobility Services
- 9.2.3. Independent Operators
- 9.2.4. Government / Public Transit Operators
- 9.2.5. Others
- 10. Global Urban Mobility Market Analysis, by Booking Platform
- 10.1. Key Segment Analysis
- 10.2. Urban Mobility Market Size (Value - US$ Bn), Analysis, and Forecasts, by Booking Platform, 2021-2035
- 10.2.1. Mobile App Based
- 10.2.2. Web Based
- 10.2.3. Kiosk / Counter Based
- 10.2.4. Others
- 11. Global Urban Mobility Market Analysis, by Revenue Model
- 11.1. Key Segment Analysis
- 11.2. Urban Mobility Market Size (Value - US$ Bn), Analysis, and Forecasts, by Revenue Model, 2021-2035
- 11.2.1. Pay-Per-Use
- 11.2.2. Subscription
- 11.2.3. Membership / Pass Based
- 11.2.4. Advertising / Data Monetization
- 11.2.5. Others
- 12. Global Urban Mobility Market Analysis, by Infrastructure
- 12.1. Key Segment Analysis
- 12.2. Urban Mobility Market Size (Value - US$ Bn), Analysis, and Forecasts, by Infrastructure, 2021-2035
- 12.2.1. Dedicated Lanes & Paths
- 12.2.2. Smart Parking Solutions
- 12.2.3. Charging Infrastructure
- 12.2.4. Multimodal Hubs
- 12.2.5. Others
- 13. Global Urban Mobility Market Analysis, by End-User
- 13.1. Key Segment Analysis
- 13.2. Urban Mobility Market Size (Value - US$ Bn), Analysis, and Forecasts, by End-User, 2021-2035
- 13.2.1. Commuters
- 13.2.2. Tourists
- 13.2.3. Corporate / Enterprise Mobility
- 13.2.4. Students
- 13.2.5. Others
- 14. Global Urban Mobility Market Analysis and Forecasts, by Region
- 14.1. Key Findings
- 14.2. Urban Mobility Market Size (Value - US$ Bn), Analysis, and Forecasts, by Region, 2021-2035
- 14.2.1. North America
- 14.2.2. Europe
- 14.2.3. Asia Pacific
- 14.2.4. Middle East
- 14.2.5. Africa
- 14.2.6. South America
- 15. North America Urban Mobility Market Analysis
- 15.1. Key Segment Analysis
- 15.2. Regional Snapshot
- 15.3. North America Urban Mobility Market Size Value - US$ Bn), Analysis, and Forecasts, 2021-2035
- 15.3.1. Mode of Transport
- 15.3.2. Shared Mobility Type
- 15.3.3. Propulsion Type
- 15.3.4. Service Provider
- 15.3.5. Booking Platform
- 15.3.6. Revenue Model
- 15.3.7. Infrastructure
- 15.3.8. End-User
- 15.3.9. Country
- 15.3.9.1. USA
- 15.3.9.2. Canada
- 15.3.9.3. Mexico
- 15.4. USA Urban Mobility Market
- 15.4.1. Country Segmental Analysis
- 15.4.2. Mode of Transport
- 15.4.3. Shared Mobility Type
- 15.4.4. Propulsion Type
- 15.4.5. Service Provider
- 15.4.6. Booking Platform
- 15.4.7. Revenue Model
- 15.4.8. Infrastructure
- 15.4.9. End-User
- 15.5. Canada Urban Mobility Market
- 15.5.1. Country Segmental Analysis
- 15.5.2. Mode of Transport
- 15.5.3. Shared Mobility Type
- 15.5.4. Propulsion Type
- 15.5.5. Service Provider
- 15.5.6. Booking Platform
- 15.5.7. Revenue Model
- 15.5.8. Infrastructure
- 15.5.9. End-User
- 15.6. Mexico Urban Mobility Market
- 15.6.1. Country Segmental Analysis
- 15.6.2. Mode of Transport
- 15.6.3. Shared Mobility Type
- 15.6.4. Propulsion Type
- 15.6.5. Service Provider
- 15.6.6. Booking Platform
- 15.6.7. Revenue Model
- 15.6.8. Infrastructure
- 15.6.9. End-User
- 16. Europe Urban Mobility Market Analysis
- 16.1. Key Segment Analysis
- 16.2. Regional Snapshot
- 16.3. Europe Urban Mobility Market Size (Value - US$ Bn), Analysis, and Forecasts, 2021-2035
- 16.3.1. Mode of Transport
- 16.3.2. Shared Mobility Type
- 16.3.3. Propulsion Type
- 16.3.4. Service Provider
- 16.3.5. Booking Platform
- 16.3.6. Revenue Model
- 16.3.7. Infrastructure
- 16.3.8. End-User
- 16.3.9. Country
- 16.3.9.1. Germany
- 16.3.9.2. United Kingdom
- 16.3.9.3. France
- 16.3.9.4. Italy
- 16.3.9.5. Spain
- 16.3.9.6. Netherlands
- 16.3.9.7. Nordic Countries
- 16.3.9.8. Poland
- 16.3.9.9. Russia & CIS
- 16.3.9.10. Rest of Europe
- 16.4. Germany Urban Mobility Market
- 16.4.1. Country Segmental Analysis
- 16.4.2. Mode of Transport
- 16.4.3. Shared Mobility Type
- 16.4.4. Propulsion Type
- 16.4.5. Service Provider
- 16.4.6. Booking Platform
- 16.4.7. Revenue Model
- 16.4.8. Infrastructure
- 16.4.9. End-User
- 16.5. United Kingdom Urban Mobility Market
- 16.5.1. Country Segmental Analysis
- 16.5.2. Mode of Transport
- 16.5.3. Shared Mobility Type
- 16.5.4. Propulsion Type
- 16.5.5. Service Provider
- 16.5.6. Booking Platform
- 16.5.7. Revenue Model
- 16.5.8. Infrastructure
- 16.5.9. End-User
- 16.6. France Urban Mobility Market
- 16.6.1. Country Segmental Analysis
- 16.6.2. Mode of Transport
- 16.6.3. Shared Mobility Type
- 16.6.4. Propulsion Type
- 16.6.5. Service Provider
- 16.6.6. Booking Platform
- 16.6.7. Revenue Model
- 16.6.8. Infrastructure
- 16.6.9. End-User
- 16.7. Italy Urban Mobility Market
- 16.7.1. Country Segmental Analysis
- 16.7.2. Mode of Transport
- 16.7.3. Shared Mobility Type
- 16.7.4. Propulsion Type
- 16.7.5. Service Provider
- 16.7.6. Booking Platform
- 16.7.7. Revenue Model
- 16.7.8. Infrastructure
- 16.7.9. End-User
- 16.8. Spain Urban Mobility Market
- 16.8.1. Country Segmental Analysis
- 16.8.2. Mode of Transport
- 16.8.3. Shared Mobility Type
- 16.8.4. Propulsion Type
- 16.8.5. Service Provider
- 16.8.6. Booking Platform
- 16.8.7. Revenue Model
- 16.8.8. Infrastructure
- 16.8.9. End-User
- 16.9. Netherlands Urban Mobility Market
- 16.9.1. Country Segmental Analysis
- 16.9.2. Mode of Transport
- 16.9.3. Shared Mobility Type
- 16.9.4. Propulsion Type
- 16.9.5. Service Provider
- 16.9.6. Booking Platform
- 16.9.7. Revenue Model
- 16.9.8. Infrastructure
- 16.9.9. End-User
- 16.10. Nordic Countries Urban Mobility Market
- 16.10.1. Country Segmental Analysis
- 16.10.2. Mode of Transport
- 16.10.3. Shared Mobility Type
- 16.10.4. Propulsion Type
- 16.10.5. Service Provider
- 16.10.6. Booking Platform
- 16.10.7. Revenue Model
- 16.10.8. Infrastructure
- 16.10.9. End-User
- 16.11. Poland Urban Mobility Market
- 16.11.1. Country Segmental Analysis
- 16.11.2. Mode of Transport
- 16.11.3. Shared Mobility Type
- 16.11.4. Propulsion Type
- 16.11.5. Service Provider
- 16.11.6. Booking Platform
- 16.11.7. Revenue Model
- 16.11.8. Infrastructure
- 16.11.9. End-User
- 16.12. Russia & CIS Urban Mobility Market
- 16.12.1. Country Segmental Analysis
- 16.12.2. Mode of Transport
- 16.12.3. Shared Mobility Type
- 16.12.4. Propulsion Type
- 16.12.5. Service Provider
- 16.12.6. Booking Platform
- 16.12.7. Revenue Model
- 16.12.8. Infrastructure
- 16.12.9. End-User
- 16.13. Rest of Europe Urban Mobility Market
- 16.13.1. Country Segmental Analysis
- 16.13.2. Mode of Transport
- 16.13.3. Shared Mobility Type
- 16.13.4. Propulsion Type
- 16.13.5. Service Provider
- 16.13.6. Booking Platform
- 16.13.7. Revenue Model
- 16.13.8. Infrastructure
- 16.13.9. End-User
- 17. Asia Pacific Urban Mobility Market Analysis
- 17.1. Key Segment Analysis
- 17.2. Regional Snapshot
- 17.3. Asia Pacific Urban Mobility Market Size (Value - US$ Bn), Analysis, and Forecasts, 2021-2035
- 17.3.1. Mode of Transport
- 17.3.2. Shared Mobility Type
- 17.3.3. Propulsion Type
- 17.3.4. Service Provider
- 17.3.5. Booking Platform
- 17.3.6. Revenue Model
- 17.3.7. Infrastructure
- 17.3.8. End-User
- 17.3.9. Country
- 17.3.9.1. China
- 17.3.9.2. India
- 17.3.9.3. Japan
- 17.3.9.4. South Korea
- 17.3.9.5. Australia and New Zealand
- 17.3.9.6. Indonesia
- 17.3.9.7. Malaysia
- 17.3.9.8. Thailand
- 17.3.9.9. Vietnam
- 17.3.9.10. Rest of Asia Pacific
- 17.4. China Urban Mobility Market
- 17.4.1. Country Segmental Analysis
- 17.4.2. Mode of Transport
- 17.4.3. Shared Mobility Type
- 17.4.4. Propulsion Type
- 17.4.5. Service Provider
- 17.4.6. Booking Platform
- 17.4.7. Revenue Model
- 17.4.8. Infrastructure
- 17.4.9. End-User
- 17.5. India Urban Mobility Market
- 17.5.1. Country Segmental Analysis
- 17.5.2. Mode of Transport
- 17.5.3. Shared Mobility Type
- 17.5.4. Propulsion Type
- 17.5.5. Service Provider
- 17.5.6. Booking Platform
- 17.5.7. Revenue Model
- 17.5.8. Infrastructure
- 17.5.9. End-User
- 17.6. Japan Urban Mobility Market
- 17.6.1. Country Segmental Analysis
- 17.6.2. Mode of Transport
- 17.6.3. Shared Mobility Type
- 17.6.4. Propulsion Type
- 17.6.5. Service Provider
- 17.6.6. Booking Platform
- 17.6.7. Revenue Model
- 17.6.8. Infrastructure
- 17.6.9. End-User
- 17.7. South Korea Urban Mobility Market
- 17.7.1. Country Segmental Analysis
- 17.7.2. Mode of Transport
- 17.7.3. Shared Mobility Type
- 17.7.4. Propulsion Type
- 17.7.5. Service Provider
- 17.7.6. Booking Platform
- 17.7.7. Revenue Model
- 17.7.8. Infrastructure
- 17.7.9. End-User
- 17.8. Australia and New Zealand Urban Mobility Market
- 17.8.1. Country Segmental Analysis
- 17.8.2. Mode of Transport
- 17.8.3. Shared Mobility Type
- 17.8.4. Propulsion Type
- 17.8.5. Service Provider
- 17.8.6. Booking Platform
- 17.8.7. Revenue Model
- 17.8.8. Infrastructure
- 17.8.9. End-User
- 17.9. Indonesia Urban Mobility Market
- 17.9.1. Country Segmental Analysis
- 17.9.2. Mode of Transport
- 17.9.3. Shared Mobility Type
- 17.9.4. Propulsion Type
- 17.9.5. Service Provider
- 17.9.6. Booking Platform
- 17.9.7. Revenue Model
- 17.9.8. Infrastructure
- 17.9.9. End-User
- 17.10. Malaysia Urban Mobility Market
- 17.10.1. Country Segmental Analysis
- 17.10.2. Mode of Transport
- 17.10.3. Shared Mobility Type
- 17.10.4. Propulsion Type
- 17.10.5. Service Provider
- 17.10.6. Booking Platform
- 17.10.7. Revenue Model
- 17.10.8. Infrastructure
- 17.10.9. End-User
- 17.11. Thailand Urban Mobility Market
- 17.11.1. Country Segmental Analysis
- 17.11.2. Mode of Transport
- 17.11.3. Shared Mobility Type
- 17.11.4. Propulsion Type
- 17.11.5. Service Provider
- 17.11.6. Booking Platform
- 17.11.7. Revenue Model
- 17.11.8. Infrastructure
- 17.11.9. End-User
- 17.12. Vietnam Urban Mobility Market
- 17.12.1. Country Segmental Analysis
- 17.12.2. Mode of Transport
- 17.12.3. Shared Mobility Type
- 17.12.4. Propulsion Type
- 17.12.5. Service Provider
- 17.12.6. Booking Platform
- 17.12.7. Revenue Model
- 17.12.8. Infrastructure
- 17.12.9. End-User
- 17.13. Rest of Asia Pacific Urban Mobility Market
- 17.13.1. Country Segmental Analysis
- 17.13.2. Mode of Transport
- 17.13.3. Shared Mobility Type
- 17.13.4. Propulsion Type
- 17.13.5. Service Provider
- 17.13.6. Booking Platform
- 17.13.7. Revenue Model
- 17.13.8. Infrastructure
- 17.13.9. End-User
- 18. Middle East Urban Mobility Market Analysis
- 18.1. Key Segment Analysis
- 18.2. Regional Snapshot
- 18.3. Middle East Urban Mobility Market Size (Value - US$ Bn), Analysis, and Forecasts, 2021-2035
- 18.3.1. Mode of Transport
- 18.3.2. Shared Mobility Type
- 18.3.3. Propulsion Type
- 18.3.4. Service Provider
- 18.3.5. Booking Platform
- 18.3.6. Revenue Model
- 18.3.7. Infrastructure
- 18.3.8. End-User
- 18.3.9. Country
- 18.3.9.1. Turkey
- 18.3.9.2. UAE
- 18.3.9.3. Saudi Arabia
- 18.3.9.4. Israel
- 18.3.9.5. Rest of Middle East
- 18.4. Turkey Urban Mobility Market
- 18.4.1. Country Segmental Analysis
- 18.4.2. Mode of Transport
- 18.4.3. Shared Mobility Type
- 18.4.4. Propulsion Type
- 18.4.5. Service Provider
- 18.4.6. Booking Platform
- 18.4.7. Revenue Model
- 18.4.8. Infrastructure
- 18.4.9. End-User
- 18.5. UAE Urban Mobility Market
- 18.5.1. Country Segmental Analysis
- 18.5.2. Mode of Transport
- 18.5.3. Shared Mobility Type
- 18.5.4. Propulsion Type
- 18.5.5. Service Provider
- 18.5.6. Booking Platform
- 18.5.7. Revenue Model
- 18.5.8. Infrastructure
- 18.5.9. End-User
- 18.6. Saudi Arabia Urban Mobility Market
- 18.6.1. Country Segmental Analysis
- 18.6.2. Mode of Transport
- 18.6.3. Shared Mobility Type
- 18.6.4. Propulsion Type
- 18.6.5. Service Provider
- 18.6.6. Booking Platform
- 18.6.7. Revenue Model
- 18.6.8. Infrastructure
- 18.6.9. End-User
- 18.7. Israel Urban Mobility Market
- 18.7.1. Country Segmental Analysis
- 18.7.2. Mode of Transport
- 18.7.3. Shared Mobility Type
- 18.7.4. Propulsion Type
- 18.7.5. Service Provider
- 18.7.6. Booking Platform
- 18.7.7. Revenue Model
- 18.7.8. Infrastructure
- 18.7.9. End-User
- 18.8. Rest of Middle East Urban Mobility Market
- 18.8.1. Country Segmental Analysis
- 18.8.2. Mode of Transport
- 18.8.3. Shared Mobility Type
- 18.8.4. Propulsion Type
- 18.8.5. Service Provider
- 18.8.6. Booking Platform
- 18.8.7. Revenue Model
- 18.8.8. Infrastructure
- 18.8.9. End-User
- 19. Africa Urban Mobility Market Analysis
- 19.1. Key Segment Analysis
- 19.2. Regional Snapshot
- 19.3. Africa Urban Mobility Market Size (Value - US$ Bn), Analysis, and Forecasts, 2021-2035
- 19.3.1. Mode of Transport
- 19.3.2. Shared Mobility Type
- 19.3.3. Propulsion Type
- 19.3.4. Service Provider
- 19.3.5. Booking Platform
- 19.3.6. Revenue Model
- 19.3.7. Infrastructure
- 19.3.8. End-User
- 19.3.9. Country
- 19.3.9.1. South Africa
- 19.3.9.2. Egypt
- 19.3.9.3. Nigeria
- 19.3.9.4. Algeria
- 19.3.9.5. Rest of Africa
- 19.4. South Africa Urban Mobility Market
- 19.4.1. Country Segmental Analysis
- 19.4.2. Mode of Transport
- 19.4.3. Shared Mobility Type
- 19.4.4. Propulsion Type
- 19.4.5. Service Provider
- 19.4.6. Booking Platform
- 19.4.7. Revenue Model
- 19.4.8. Infrastructure
- 19.4.9. End-User
- 19.5. Egypt Urban Mobility Market
- 19.5.1. Country Segmental Analysis
- 19.5.2. Mode of Transport
- 19.5.3. Shared Mobility Type
- 19.5.4. Propulsion Type
- 19.5.5. Service Provider
- 19.5.6. Booking Platform
- 19.5.7. Revenue Model
- 19.5.8. Infrastructure
- 19.5.9. End-User
- 19.6. Nigeria Urban Mobility Market
- 19.6.1. Country Segmental Analysis
- 19.6.2. Mode of Transport
- 19.6.3. Shared Mobility Type
- 19.6.4. Propulsion Type
- 19.6.5. Service Provider
- 19.6.6. Booking Platform
- 19.6.7. Revenue Model
- 19.6.8. Infrastructure
- 19.6.9. End-User
- 19.7. Algeria Urban Mobility Market
- 19.7.1. Country Segmental Analysis
- 19.7.2. Mode of Transport
- 19.7.3. Shared Mobility Type
- 19.7.4. Propulsion Type
- 19.7.5. Service Provider
- 19.7.6. Booking Platform
- 19.7.7. Revenue Model
- 19.7.8. Infrastructure
- 19.7.9. End-User
- 19.8. Rest of Africa Urban Mobility Market
- 19.8.1. Country Segmental Analysis
- 19.8.2. Mode of Transport
- 19.8.3. Shared Mobility Type
- 19.8.4. Propulsion Type
- 19.8.5. Service Provider
- 19.8.6. Booking Platform
- 19.8.7. Revenue Model
- 19.8.8. Infrastructure
- 19.8.9. End-User
- 20. South America Urban Mobility Market Analysis
- 20.1. Key Segment Analysis
- 20.2. Regional Snapshot
- 20.3. South America Urban Mobility Market Size (Value - US$ Bn), Analysis, and Forecasts, 2021-2035
- 20.3.1. Mode of Transport
- 20.3.2. Shared Mobility Type
- 20.3.3. Propulsion Type
- 20.3.4. Service Provider
- 20.3.5. Booking Platform
- 20.3.6. Revenue Model
- 20.3.7. Infrastructure
- 20.3.8. End-User
- 20.3.9. Country
- 20.3.9.1. Brazil
- 20.3.9.2. Argentina
- 20.3.9.3. Rest of South America
- 20.4. Brazil Urban Mobility Market
- 20.4.1. Country Segmental Analysis
- 20.4.2. Mode of Transport
- 20.4.3. Shared Mobility Type
- 20.4.4. Propulsion Type
- 20.4.5. Service Provider
- 20.4.6. Booking Platform
- 20.4.7. Revenue Model
- 20.4.8. Infrastructure
- 20.4.9. End-User
- 20.5. Argentina Urban Mobility Market
- 20.5.1. Country Segmental Analysis
- 20.5.2. Mode of Transport
- 20.5.3. Shared Mobility Type
- 20.5.4. Propulsion Type
- 20.5.5. Service Provider
- 20.5.6. Booking Platform
- 20.5.7. Revenue Model
- 20.5.8. Infrastructure
- 20.5.9. End-User
- 20.6. Rest of South America Urban Mobility Market
- 20.6.1. Country Segmental Analysis
- 20.6.2. Mode of Transport
- 20.6.3. Shared Mobility Type
- 20.6.4. Propulsion Type
- 20.6.5. Service Provider
- 20.6.6. Booking Platform
- 20.6.7. Revenue Model
- 20.6.8. Infrastructure
- 20.6.9. End-User
- 21. Key Players/ Company Profile
- 21.1. Bird Rides
- 21.1.1. Company Details/ Overview
- 21.1.2. Company Financials
- 21.1.3. Key Customers and Competitors
- 21.1.4. Business/ Industry Portfolio
- 21.1.5. Product Portfolio/ Specification Details
- 21.1.6. Pricing Data
- 21.1.7. Strategic Overview
- 21.1.8. Recent Developments
- 21.2. BlaBlaCar
- 21.3. Bolt
- 21.4. Careem
- 21.5. Didi Chuxing
- 21.6. Gett
- 21.7. Grab
- 21.8. Lime
- 21.9. Lyft
- 21.10. Moovit
- 21.11. Ola
- 21.12. REVEL
- 21.13. Spin (Ford)
- 21.14. Superpedestrian
- 21.15. Tier Mobility
- 21.16. Transit
- 21.17. Uber
- 21.18. Voi Technology
- 21.19. Wheels Mobility
- 21.20. Zipcar
- 21.21. Other Key Players
- 21.1. Bird Rides
Note* - This is just tentative list of players. While providing the report, we will cover more number of players based on their revenue and share for each geography
Research Design
Our research design integrates both demand-side and supply-side analysis through a balanced combination of primary and secondary research methodologies. By utilizing both bottom-up and top-down approaches alongside rigorous data triangulation methods, we deliver robust market intelligence that supports strategic decision-making.
MarketGenics' comprehensive research design framework ensures the delivery of accurate, reliable, and actionable market intelligence. Through the integration of multiple research approaches, rigorous validation processes, and expert analysis, we provide our clients with the insights needed to make informed strategic decisions and capitalize on market opportunities.

MarketGenics leverages a dedicated industry panel of experts and a comprehensive suite of paid databases to effectively collect, consolidate, and analyze market intelligence.
Our approach has consistently proven to be reliable and effective in generating accurate market insights, identifying key industry trends, and uncovering emerging business opportunities.
Through both primary and secondary research, we capture and analyze critical company-level data such as manufacturing footprints, including technical centers, R&D facilities, sales offices, and headquarters.
Our expert panel further enhances our ability to estimate market size for specific brands based on validated field-level intelligence.
Our data mining techniques incorporate both parametric and non-parametric methods, allowing for structured data collection, sorting, processing, and cleaning.
Demand projections are derived from large-scale data sets analyzed through proprietary algorithms, culminating in robust and reliable market sizing.
Research Approach
The bottom-up approach builds market estimates by starting with the smallest addressable market units and systematically aggregating them to create comprehensive market size projections.
This method begins with specific, granular data points and builds upward to create the complete market landscape.
Customer Analysis → Segmental Analysis → Geographical Analysis
The top-down approach starts with the broadest possible market data and systematically narrows it down through a series of filters and assumptions to arrive at specific market segments or opportunities.
This method begins with the big picture and works downward to increasingly specific market slices.
TAM → SAM → SOM


Research Methods
Desk / Secondary Research
While analysing the market, we extensively study secondary sources, directories, and databases to identify and collect information useful for this technical, market-oriented, and commercial report. Secondary sources that we utilize are not only the public sources, but it is a combination of Open Source, Associations, Paid Databases, MG Repository & Knowledgebase, and others.
- Company websites, annual reports, financial reports, broker reports, and investor presentations
- National government documents, statistical databases and reports
- News articles, press releases and web-casts specific to the companies operating in the market, Magazines, reports, and others
- We gather information from commercial data sources for deriving company specific data such as segmental revenue, share for geography, product revenue, and others
- Internal and external proprietary databases (industry-specific), relevant patent, and regulatory databases
- Governing Bodies, Government Organizations
- Relevant Authorities, Country-specific Associations for Industries
We also employ the model mapping approach to estimate the product level market data through the players' product portfolio
Primary Research
Primary research/ interviews is vital in analyzing the market. Most of the cases involves paid primary interviews. Primary sources include primary interviews through e-mail interactions, telephonic interviews, surveys as well as face-to-face interviews with the different stakeholders across the value chain including several industry experts.
| Type of Respondents | Number of Primaries |
|---|---|
| Tier 2/3 Suppliers | ~20 |
| Tier 1 Suppliers | ~25 |
| End-users | ~25 |
| Industry Expert/ Panel/ Consultant | ~30 |
| Total | ~100 |
MG Knowledgebase
• Repository of industry blog, newsletter and case studies
• Online platform covering detailed market reports, and company profiles
Forecasting Factors and Models
Forecasting Factors
- Historical Trends – Past market patterns, cycles, and major events that shaped how markets behave over time. Understanding past trends helps predict future behavior.
- Industry Factors – Specific characteristics of the industry like structure, regulations, and innovation cycles that affect market dynamics.
- Macroeconomic Factors – Economic conditions like GDP growth, inflation, and employment rates that affect how much money people have to spend.
- Demographic Factors – Population characteristics like age, income, and location that determine who can buy your product.
- Technology Factors – How quickly people adopt new technology and how much technology infrastructure exists.
- Regulatory Factors – Government rules, laws, and policies that can help or restrict market growth.
- Competitive Factors – Analyzing competition structure such as degree of competition and bargaining power of buyers and suppliers.
Forecasting Models / Techniques
Multiple Regression Analysis
- Identify and quantify factors that drive market changes
- Statistical modeling to establish relationships between market drivers and outcomes
Time Series Analysis – Seasonal Patterns
- Understand regular cyclical patterns in market demand
- Advanced statistical techniques to separate trend, seasonal, and irregular components
Time Series Analysis – Trend Analysis
- Identify underlying market growth patterns and momentum
- Statistical analysis of historical data to project future trends
Expert Opinion – Expert Interviews
- Gather deep industry insights and contextual understanding
- In-depth interviews with key industry stakeholders
Multi-Scenario Development
- Prepare for uncertainty by modeling different possible futures
- Creating optimistic, pessimistic, and most likely scenarios
Time Series Analysis – Moving Averages
- Sophisticated forecasting for complex time series data
- Auto-regressive integrated moving average models with seasonal components
Econometric Models
- Apply economic theory to market forecasting
- Sophisticated economic models that account for market interactions
Expert Opinion – Delphi Method
- Harness collective wisdom of industry experts
- Structured, multi-round expert consultation process
Monte Carlo Simulation
- Quantify uncertainty and probability distributions
- Thousands of simulations with varying input parameters
Research Analysis
Our research framework is built upon the fundamental principle of validating market intelligence from both demand and supply perspectives. This dual-sided approach ensures comprehensive market understanding and reduces the risk of single-source bias.
Demand-Side Analysis: We understand end-user/application behavior, preferences, and market needs along with the penetration of the product for specific application.
Supply-Side Analysis: We estimate overall market revenue, analyze the segmental share along with industry capacity, competitive landscape, and market structure.
Validation & Evaluation
Data triangulation is a validation technique that uses multiple methods, sources, or perspectives to examine the same research question, thereby increasing the credibility and reliability of research findings. In market research, triangulation serves as a quality assurance mechanism that helps identify and minimize bias, validate assumptions, and ensure accuracy in market estimates.
- Data Source Triangulation – Using multiple data sources to examine the same phenomenon
- Methodological Triangulation – Using multiple research methods to study the same research question
- Investigator Triangulation – Using multiple researchers or analysts to examine the same data
- Theoretical Triangulation – Using multiple theoretical perspectives to interpret the same data

Custom Market Research Services
We will customise the research for you, in case the report listed above does not meet your requirements.
Get 10% Free Customisation