Vehicle-as-a-Service Market Size, Share & Trends Analysis Report by Service Type (Ride Hailing, Car Sharing, Ride Sharing/Carpooling, Station-Based Mobility, Micro-Mobility Services, Subscription-Based Services), Vehicle Type, Propulsion Type, Platform Type, Booking Type, Ownership Model, Pricing Model, End-users, and Geography (North America, Europe, Asia Pacific, Middle East, Africa, and South America) – Global Industry Data, Trends, and Forecasts, 2026–2035
Market Overview:
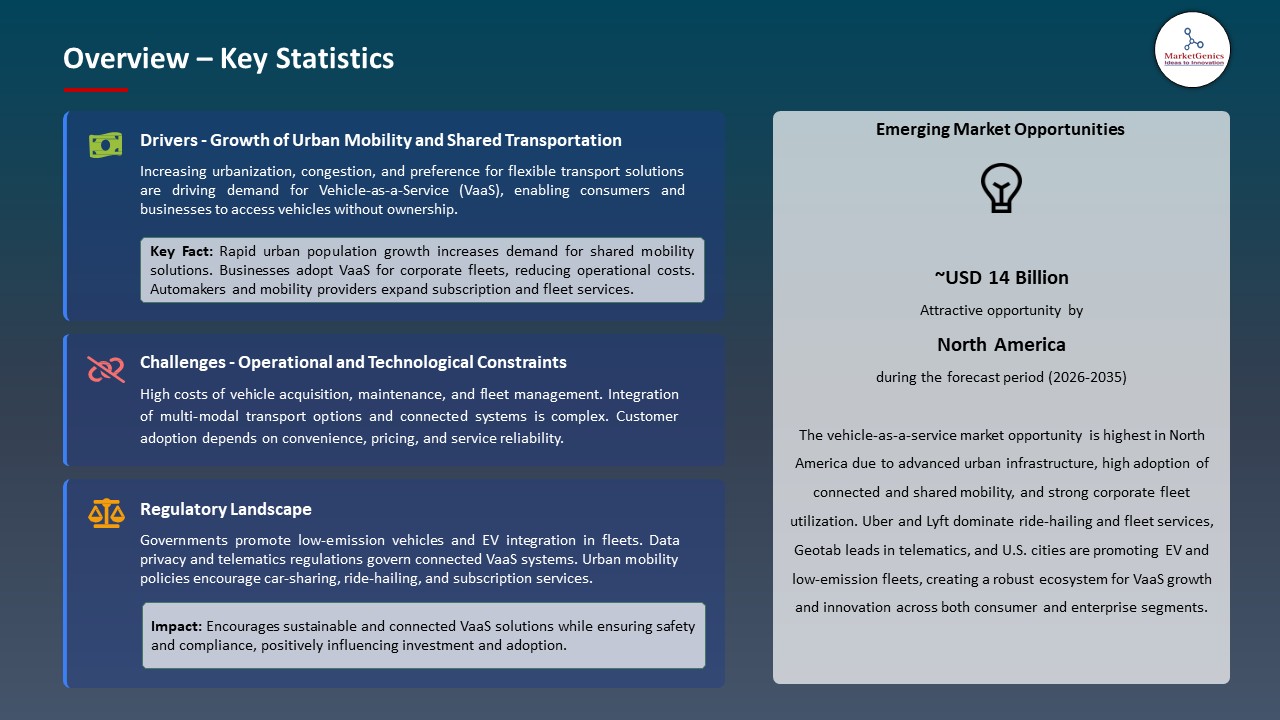
According to MarketGenics, the global Vehicle-as-a-Service market is projected to grow from USD 12.5 billion in 2025 to USD 49.3 billion by 2035, registering a CAGR of 14.7% during the forecast period.
|
|
|
Segmental Data Insights |
|
|
Demand Trends |
|
|
Competitive Landscape |
|
|
Strategic Development |
|
|
Future Outlook & Opportunities |
|
Vehicle-as-a-Service Market Size, Share, and Growth
Digital mobility platforms and connected vehicle technologies, combined with cloud-based fleet management systems, drive the global vehicle-as-a-service market which makes flexible, on-demand, and subscription-based transportation services available to enterprises and consumers at real-time visibility, scalability, and operational efficiency.

Sarfraz Maredia, Global Head of Autonomous at Uber, said, We’re excited to launch autonomous rides in Dallas with Avride, as we continue to build towards an increasingly electric and autonomous future. With the world’s largest hybrid network, we’re proving how AVs and drivers can work side by side to make transportation more convenient, sustainable, and affordable for people everywhere.
The global vehicle-as-a-service market is booming, with businesses, fleet owners, and urban mobility companies rapidly abandoning the traditional asset-intensive ownership model in a rotation to flexible usage-based bases of vehicle access. Subscriber fleets, temporary leasing, and bundled mobility are transforming the way vehicles are deployed in the ride-hailing, logistics, corporate mobility, and municipal transport, enhancing cost-related clarity and operational responsiveness.
Fleet orchestration AIs, autonomous driving systems, and cloud-based mobility solutions are also providing vehicle-as-a-service providers with the ability to operate at scale with little human effort alongside enhancing utilization and reliability of services. For instance, in January 2026, a fully commercial, driverless ride-hailing service operated on the Yas Island in Abu Dhabi through Apollo Go, a Baidu partner, and AutoGo of the UAE is illustrative of the scalability of autonomous VaaS models outside of China and the U.S. Real-time dispatch, predictive analytics and vehicle monitoring further supports VaaS developments across the urban markets worldwide.
The adjacent opportunities are growing with electric fleet programs, autonomous mobility pilots, and data-enabled mobility services and unlock recurring revenue with subscriptions and fleet intelligence and enterprise transport solutions. Vehicle-as-a-Service is transforming the worldwide mobility outlook by empowering asset-light, technology profound and sustainability-related transport models that promote effectiveness in operations and long-term mobility risk globally.
 Vehicle-as-a-Service Market Dynamics and Trends
Driver: Growing Adoption of Flexible and Shared Mobility Solutions
-
Urban congestion, transformation in vehicle ownership models and need to have transport that is affordable is driving the trend towards subscription-based, shared, as well as on-demand models of mobility, which are prompting Vehicle-as-a-Service platforms to be adopted worldwide.
- Services based on fleet-sharing, ride-hailing, and car subscription, which are platform-enabled, are growing faster as consumers focus more on flexibility, rather than ownership. In November 2025, Uber extended the Uber One mobility subscription to provide multi-vehicle access not only to ride-hailing but also car rentals and micro mobility services, which enhances recurring revenue models of the VaaS ecosystem.
- App-based traffic, real-time fleet analysis and dynamic price will ensure better utilization of the assets and possible scaling shared mobility use deployment.
Restraint: Regulatory and Infrastructure Challenges
-
The combination of ride-hailing, autonomous vehicles, and electric fleets will add to the regulatory complexity of vehicle-as-a-service providers because licensing, safety protocols, data protection regulations, and worker categorization only differ between nations and cities.
- High infrastructure needs (EV charging networks, autonomous vehicle testing corridors, real-time traffic data systems, etc.) increase the cost of deployment and slow the large-scale implementation, especially in emerging and mid-tier urban markets.
- Poor smart transport preparedness and slow policy integration call interoperability and postponability to scalable VaaS implementation.
Opportunity: Autonomous and Electric Vehicle Integration
-
A combination of autonomous driving systems and electric vehicle (EV) platforms is also opening new possibilities to the vehicle-as-a-service market by offering cost-effective, scalable, and sustainable mobility models of urban transportation and logistics and enterprise mobility services.
- Strategic partnerships between OEMs, technology providers and VaaS platforms are facilitating more autonomous mobility based on EVs; in October 2025, Stellantis confirmed it was going to a global collaboration with NVIDIA, Uber and Foxconn to collaborate in developing Level 4 autonomous electric robotaxi platforms to deploy globally, speeding up next-generation VaaS services.
- There is autonomous EV robotaxi and common batches, which facilitates saleable subscription-based, enterprise, and low-emission VaaS revenue streams.
Key Trend: Multi-Modal and On-Demand Transport Convergence
-
Ride-hailing, autonomous vehicles, micro-mobility and shared transport services are converging at rapid speeds, driving the global vehicle-as-a-service market, with platforms being built as integrated mobility ecosystems that are seamless and end-to-end modes of travel, with a single digital interface.
- The convergence is being enhanced by integrating autonomous driving technology into on-demand mobility platforms; in May 2025, Grab made an investment and alliance with May Mobility to roll out the autonomous vehicle technology across Southeast Asia to allow the addition of self-driving fleets to the ride-hailing and other mobility services offered by the company.
- Coherent mobility platforms enhance fleet utilisation and make it possible to monetise VaaS at scale and through bundling.
Vehicle-as-a-Service Market Analysis and Segmental Data
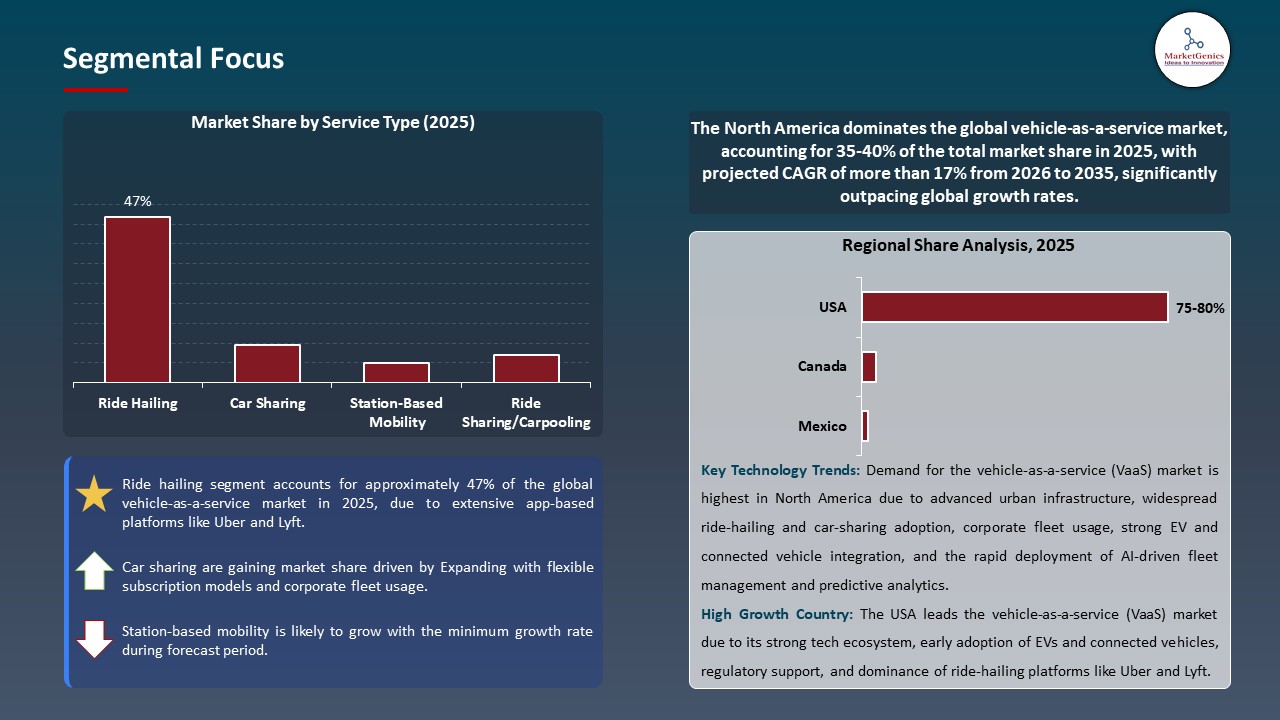
Ride Hailing Dominate Global Vehicle-as-a-Service Market
-
The ride hailing leads the global vehicle-as-a-service market due to its widespread use in cities to provide the convenience of using apps in bookings and the fact that people prefer convenient digital booking applications.
- Incremental adoption is growing due to continuous innovation in ride hailing platforms and strategic expansions; for instance, in August 2025, Lyft collaborated with Baidu to launch a robotaxi service in Europe and increase autonomous hailing options in Germany and the UK, and platform reach through multimodal mobility integration.
- High app penetration and AI-driven dispatching remain source of consolidation of ride hailing in VaaS across the globe.
North America Leads Global Vehicle-as-a-Service Market Demand
-
North America is a market leader because of the high usage of flexible, technology-enabled mobility technologies, developed urban infrastructure, and the presence of large concentrations of major Vehicle-as-a-Service innovators in the U.S and Canada.
- The use of AI-based real-time VaaS solutions gains momentum as businesses and users shift to subscription and on-demand models of mobility; for instance, in September 2025, agreement between Lyft and Waymo to incorporate autonomous vehicles into shared mobility fleets and increase the efficiency of urban transport and next-generation services.
- Clear cloud infrastructure and strategic alliances between the government and the businesses remain in place to strengthen the North American leadership in scalable VaaS networks.
Vehicle-as-a-Service Market Ecosystem
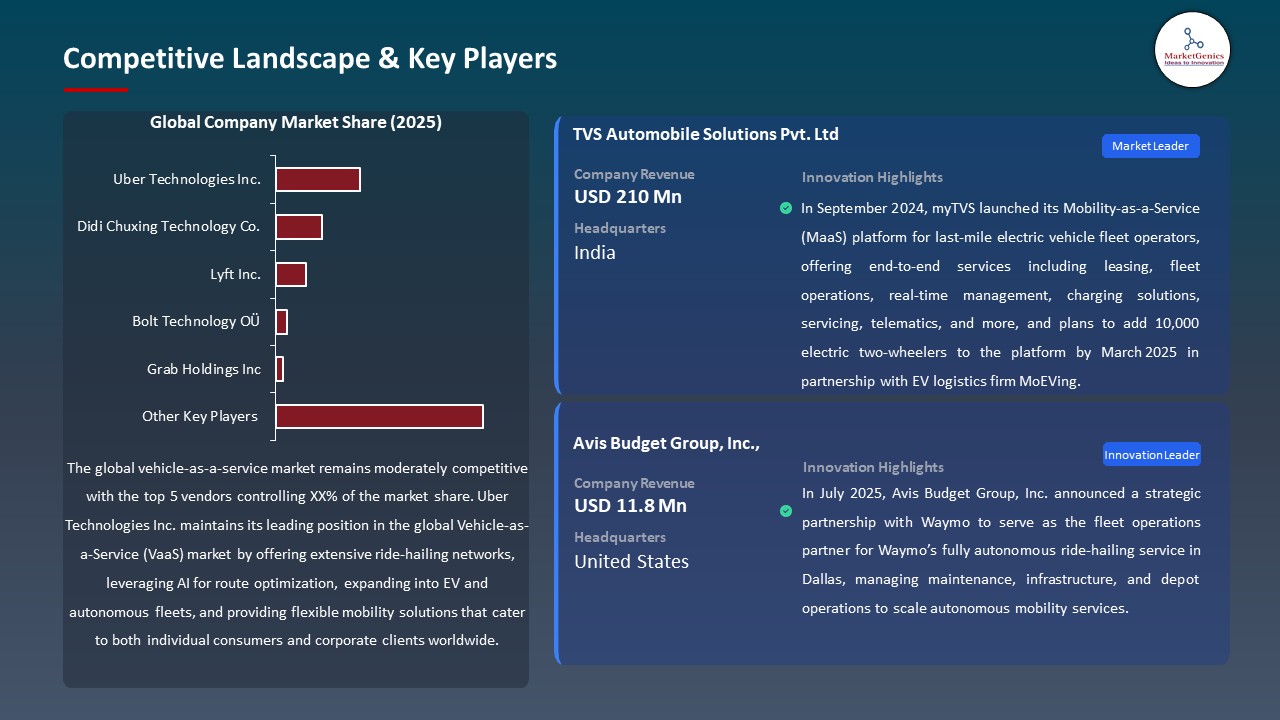
The vehicle-as-a-service market is moderately consolidated, and the competition is focused on scalable mobility platforms, real-time ride matching, multi-modal transport integration, fleet electrification, and sustainable city mobility. The market share magnitude is attributed to the existence of Uber Technologies Inc., Didi Chuxing Technology Co., Lyft Inc., Bolt Technology OU, and Grab Holdings Inc. that provide a range of VaaS offerings that comprise advanced ride-hailing platforms, micro-mobility services, AI-driven fleet management, real-time dispatching, subscription packages, and digital engagement tools.
Uber Technologies Inc. is a worldwide network that provides ride-hailing, shared rides and self-driving vehicles. Didi Chuxing Technology Co. is a ride-hailing, bike-sharing and fleet electrification company in China. Lyft Inc. is an organization that specializes in shared mobility, EV adoption, and corporate mobility in North America. Bolt Technology OU provides cheap rides in cities with the help of ride-hailing and e-scooters in Europe and emerging markets. Grab Holdings Inc. is a ride-hailing and food delivery, logistics, and financial services company based in Southeast Asia.
Electrification and multi-modal integration, fleet optimization by AI, and real-time connection with users are emerging fast because of the rising investments in EV infrastructure, rising demand of shared and sustainable mobility, and collaboration with local governments, fleet operators, and technology providers. These ecosystem relationships drive more competitive differentiation, scale of VaaS networks, and Vehicle-as-a-Service applications based on social, business, and urban mobility, which is why the global VaaS market functions to improve urban transportation, sustainability, and next-generation mobility experiences.
 Recent Development and Strategic Overview
-
In September 2024, myTVS announced its Mobility-as-a-Service (MaaS) platform to last-mile electric vehicle fleet operators, which includes end-to-end services such as leasing, fleet management, real-time management, charging options, servicing, telematics, and others and intends to add 10,000 electric two-wheelers to the platform in collaboration with an EV logistics company, MoEVing.
- In December 2025, Uber and autonomous technology developer Avride debuted a robotaxi service in Dallas, where passengers can be paired with Avride-driven autonomous Hyundai Ioniq 5 via the Uber app as part of their future collaboration to commercially launch autonomous ride-hailing.
Report Scope
|
Detail |
|
|
Market Size in 2025 |
USD 12.5 Bn |
|
Market Forecast Value in 2035 |
USD 49.3 Bn |
|
Growth Rate (CAGR) |
14.7% |
|
Forecast Period |
2026 – 2035 |
|
Historical Data Available for |
2021 – 2024 |
|
Market Size Units |
US$ Billion for Value |
|
Report Format |
Electronic (PDF) + Excel |
|
North America |
Europe |
Asia Pacific |
Middle East |
Africa |
South America |
|
|
|
|
|
|
|
Companies Covered |
|||||
|
|
|
|
|
|
Vehicle-as-a-Service Market Segmentation and Highlights
|
Segment |
Sub-segment |
|
Vehicle-as-a-Service Market, By Service Type |
|
|
Vehicle-as-a-Service Market, By Vehicle Type |
|
|
Vehicle-as-a-Service Market, By Propulsion Type |
|
|
Vehicle-as-a-Service Market, By Platform Type |
|
|
Vehicle-as-a-Service Market, By Booking Type |
|
|
Vehicle-as-a-Service Market, By Ownership Model |
|
|
Vehicle-as-a-Service Market, By Pricing Model |
|
|
Vehicle-as-a-Service Market, By End-users |
|
Frequently Asked Questions
Table of Contents
- 1. Research Methodology and Assumptions
- 1.1. Definitions
- 1.2. Research Design and Approach
- 1.3. Data Collection Methods
- 1.4. Base Estimates and Calculations
- 1.5. Forecasting Models
- 1.5.1. Key Forecast Factors & Impact Analysis
- 1.6. Secondary Research
- 1.6.1. Open Sources
- 1.6.2. Paid Databases
- 1.6.3. Associations
- 1.7. Primary Research
- 1.7.1. Primary Sources
- 1.7.2. Primary Interviews with Stakeholders across Ecosystem
- 2. Executive Summary
- 2.1. Global Vehicle-as-a-Service Market Outlook
- 2.1.1. Vehicle-as-a-Service Market Size (Value - US$ Bn), and Forecasts, 2021-2035
- 2.1.2. Compounded Annual Growth Rate Analysis
- 2.1.3. Growth Opportunity Analysis
- 2.1.4. Segmental Share Analysis
- 2.1.5. Geographical Share Analysis
- 2.2. Market Analysis and Facts
- 2.3. Supply-Demand Analysis
- 2.4. Competitive Benchmarking
- 2.5. Go-to- Market Strategy
- 2.5.1. Customer/ End-use Industry Assessment
- 2.5.2. Growth Opportunity Data, 2026-2035
- 2.5.2.1. Regional Data
- 2.5.2.2. Country Data
- 2.5.2.3. Segmental Data
- 2.5.3. Identification of Potential Market Spaces
- 2.5.4. GAP Analysis
- 2.5.5. Potential Attractive Price Points
- 2.5.6. Prevailing Market Risks & Challenges
- 2.5.7. Preferred Sales & Marketing Strategies
- 2.5.8. Key Recommendations and Analysis
- 2.5.9. A Way Forward
- 2.1. Global Vehicle-as-a-Service Market Outlook
- 3. Industry Data and Premium Insights
- 3.1. Global Automotive & Transportation Industry Overview, 2025
- 3.1.1. Automotive & Transportation Industry Ecosystem Analysis
- 3.1.2. Key Trends for Automotive & Transportation Industry
- 3.1.3. Regional Distribution for Automotive & Transportation Industry
- 3.2. Supplier Customer Data
- 3.3. Technology Roadmap and Developments
- 3.4. Trade Analysis
- 3.4.1. Import & Export Analysis, 2025
- 3.4.2. Top Importing Countries
- 3.4.3. Top Exporting Countries
- 3.5. Trump Tariff Impact Analysis
- 3.5.1. Manufacturer
- 3.5.1.1. Based on the component & Raw material
- 3.5.2. Supply Chain
- 3.5.3. End Consumer
- 3.5.1. Manufacturer
- 3.6. Raw Material Analysis
- 3.1. Global Automotive & Transportation Industry Overview, 2025
- 4. Market Overview
- 4.1. Market Dynamics
- 4.1.1. Drivers
- 4.1.1.1. Rising demand for flexible mobility solutions and shift from ownership to access through subscriptions, leasing, and on-demand services.
- 4.1.1.2. Rapid urbanization, traffic congestion, and need for efficient transportation driving shared mobility adoption.
- 4.1.1.3. Technological advancements including digital platforms, connectivity, and integration with smartphones that enhance user experience.
- 4.1.2. Restraints
- 4.1.2.1. Regulatory challenges and varying compliance requirements across regions.
- 4.1.2.2. Infrastructure limitations and high initial investment for fleet acquisition and support systems.
- 4.1.1. Drivers
- 4.2. Key Trend Analysis
- 4.3. Regulatory Framework
- 4.3.1. Key Regulations, Norms, and Subsidies, by Key Countries
- 4.3.2. Tariffs and Standards
- 4.3.3. Impact Analysis of Regulations on the Market
- 4.4. Ecosystem Analysis
- 4.5. Porter’s Five Forces Analysis
- 4.6. PESTEL Analysis
- 4.7. Global Vehicle-as-a-Service Market Demand
- 4.7.1. Historical Market Size – Value (US$ Bn), 2020-2024
- 4.7.2. Current and Future Market Size – Value (US$ Bn), 2026–2035
- 4.7.2.1. Y-o-Y Growth Trends
- 4.7.2.2. Absolute $ Opportunity Assessment
- 4.1. Market Dynamics
- 5. Competition Landscape
- 5.1. Competition structure
- 5.1.1. Fragmented v/s consolidated
- 5.2. Company Share Analysis, 2025
- 5.2.1. Global Company Market Share
- 5.2.2. By Region
- 5.2.2.1. North America
- 5.2.2.2. Europe
- 5.2.2.3. Asia Pacific
- 5.2.2.4. Middle East
- 5.2.2.5. Africa
- 5.2.2.6. South America
- 5.3. Product Comparison Matrix
- 5.3.1. Specifications
- 5.3.2. Market Positioning
- 5.3.3. Pricing
- 5.1. Competition structure
- 6. Global Vehicle-as-a-Service Market Analysis, by Service Type
- 6.1. Key Segment Analysis
- 6.2. Vehicle-as-a-Service Market Size (Value - US$ Bn), Analysis, and Forecasts, by Service Type, 2021-2035
- 6.2.1. Ride Hailing
- 6.2.2. Car Sharing
- 6.2.3. Ride Sharing/Carpooling
- 6.2.4. Station-Based Mobility
- 6.2.5. Micro-Mobility Services
- 6.2.6. Subscription-Based Services
- 7. Global Vehicle-as-a-Service Market Analysis, by Vehicle Type
- 7.1. Key Segment Analysis
- 7.2. Vehicle-as-a-Service Market Size (Value - US$ Bn), Analysis, and Forecasts, by Vehicle Type, 2021-2035
- 7.2.1. Passenger Cars
- 7.2.1.1. Hatchback
- 7.2.1.2. Sedan
- 7.2.1.3. SUV
- 7.2.1.4. Luxury Vehicles
- 7.2.2. Commercial Vehicles
- 7.2.2.1. Light Commercial Vehicles
- 7.2.2.2. Medium Commercial Vehicles
- 7.2.2.3. Heavy Commercial Vehicles
- 7.2.3. Two-Wheelers
- 7.2.4. Micro-Mobility Vehicles
- 7.2.4.1. E-Scooters
- 7.2.4.2. E-Bikes
- 7.2.1. Passenger Cars
- 8. Global Vehicle-as-a-Service Market Analysis, by Propulsion Type
- 8.1. Key Segment Analysis
- 8.2. Vehicle-as-a-Service Market Size (Value - US$ Bn), Analysis, and Forecasts, by Propulsion Type, 2021-2035
- 8.2.1. Internal Combustion Engine (ICE)
- 8.2.1.1. Gasoline
- 8.2.1.2. Diesel
- 8.2.2. Electric Vehicles
- 8.2.2.1. Battery Electric Vehicles (BEV)
- 8.2.2.2. Plug-in Hybrid Electric Vehicles (PHEV)
- 8.2.3. Hybrid Vehicles
- 8.2.1. Internal Combustion Engine (ICE)
- 9. Global Vehicle-as-a-Service Market Analysis, by Platform Type
- 9.1. Key Segment Analysis
- 9.2. Vehicle-as-a-Service Market Size (Value - US$ Bn), Analysis, and Forecasts, by Platform Type, 2021-2035
- 9.2.1. App-Based
- 9.2.2. Web-Based
- 9.2.3. Integrated Platforms
- 10. Global Vehicle-as-a-Service Market Analysis, by Booking Type
- 10.1. Key Segment Analysis
- 10.2. Vehicle-as-a-Service Market Size (Value - US$ Bn), Analysis, and Forecasts, by Booking Type, 2021-2035
- 10.2.1. Short-Term Rental
- 10.2.2. Long-Term Rental
- 10.2.3. On-Demand Booking
- 10.2.4. Advance Booking
- 11. Global Vehicle-as-a-Service Market Analysis, by Ownership Model
- 11.1. Key Segment Analysis
- 11.2. Vehicle-as-a-Service Market Size (Value - US$ Bn), Analysis, and Forecasts, by Ownership Model, 2021-2035
- 11.2.1. B2C (Business to Consumer)
- 11.2.2. B2B (Business to Business)
- 11.2.3. P2P (Peer to Peer)
- 12. Global Vehicle-as-a-Service Market Analysis, by Pricing Model
- 12.1. Key Segment Analysis
- 12.2. Vehicle-as-a-Service Market Size (Value - US$ Bn), Analysis, and Forecasts, by Pricing Model, 2021-2035
- 12.2.1. Pay-Per-Use
- 12.2.2. Subscription-Based
- 12.2.3. Membership-Based
- 12.2.4. Hybrid Pricing
- 13. Global Vehicle-as-a-Service Market Analysis, by End-users
- 13.1. Key Segment Analysis
- 13.2. Vehicle-as-a-Service Market Size (Value - US$ Bn), Analysis, and Forecasts, by End-users, 2021-2035
- 13.2.1. Corporate/Business Sector
- 13.2.2. Individual/Personal Use
- 13.2.3. Tourism & Hospitality
- 13.2.4. Healthcare
- 13.2.5. Educational Institutions
- 13.2.6. Government & Public Sector
- 13.2.7. Retail & E-Commerce
- 13.2.8. Real Estate & Property Management
- 13.2.9. Others
- 14. Global Vehicle-as-a-Service Market Analysis and Forecasts, by Region
- 14.1. Key Findings
- 14.2. Vehicle-as-a-Service Market Size (Value - US$ Bn), Analysis, and Forecasts, by Region, 2021-2035
- 14.2.1. North America
- 14.2.2. Europe
- 14.2.3. Asia Pacific
- 14.2.4. Middle East
- 14.2.5. Africa
- 14.2.6. South America
- 15. North America Vehicle-as-a-Service Market Analysis
- 15.1. Key Segment Analysis
- 15.2. Regional Snapshot
- 15.3. North America Vehicle-as-a-Service Market Size (Value - US$ Bn), Analysis, and Forecasts, 2021-2035
- 15.3.1. Service Type
- 15.3.2. Vehicle Type
- 15.3.3. Propulsion Type
- 15.3.4. Platform Type
- 15.3.5. Booking Type
- 15.3.6. Ownership Model
- 15.3.7. Pricing Model
- 15.3.8. End-users
- 15.3.9. Country
- 15.3.9.1. USA
- 15.3.9.2. Canada
- 15.3.9.3. Mexico
- 15.4. USA Vehicle-as-a-Service Market
- 15.4.1. Country Segmental Analysis
- 15.4.2. Service Type
- 15.4.3. Vehicle Type
- 15.4.4. Propulsion Type
- 15.4.5. Platform Type
- 15.4.6. Booking Type
- 15.4.7. Ownership Model
- 15.4.8. Pricing Model
- 15.4.9. End-users
- 15.5. Canada Vehicle-as-a-Service Market
- 15.5.1. Country Segmental Analysis
- 15.5.2. Service Type
- 15.5.3. Vehicle Type
- 15.5.4. Propulsion Type
- 15.5.5. Platform Type
- 15.5.6. Booking Type
- 15.5.7. Ownership Model
- 15.5.8. Pricing Model
- 15.5.9. End-users
- 15.6. Mexico Vehicle-as-a-Service Market
- 15.6.1. Country Segmental Analysis
- 15.6.2. Service Type
- 15.6.3. Vehicle Type
- 15.6.4. Propulsion Type
- 15.6.5. Platform Type
- 15.6.6. Booking Type
- 15.6.7. Ownership Model
- 15.6.8. Pricing Model
- 15.6.9. End-users
- 16. Europe Vehicle-as-a-Service Market Analysis
- 16.1. Key Segment Analysis
- 16.2. Regional Snapshot
- 16.3. Europe Vehicle-as-a-Service Market Size (Value - US$ Bn), Analysis, and Forecasts, 2021-2035
- 16.3.1. Service Type
- 16.3.2. Vehicle Type
- 16.3.3. Propulsion Type
- 16.3.4. Platform Type
- 16.3.5. Booking Type
- 16.3.6. Ownership Model
- 16.3.7. Pricing Model
- 16.3.8. End-users
- 16.3.9. Country
- 16.3.9.1. Germany
- 16.3.9.2. United Kingdom
- 16.3.9.3. France
- 16.3.9.4. Italy
- 16.3.9.5. Spain
- 16.3.9.6. Netherlands
- 16.3.9.7. Nordic Countries
- 16.3.9.8. Poland
- 16.3.9.9. Russia & CIS
- 16.3.9.10. Rest of Europe
- 16.4. Germany Vehicle-as-a-Service Market
- 16.4.1. Country Segmental Analysis
- 16.4.2. Service Type
- 16.4.3. Vehicle Type
- 16.4.4. Propulsion Type
- 16.4.5. Platform Type
- 16.4.6. Booking Type
- 16.4.7. Ownership Model
- 16.4.8. Pricing Model
- 16.4.9. End-users
- 16.5. United Kingdom Vehicle-as-a-Service Market
- 16.5.1. Country Segmental Analysis
- 16.5.2. Service Type
- 16.5.3. Vehicle Type
- 16.5.4. Propulsion Type
- 16.5.5. Platform Type
- 16.5.6. Booking Type
- 16.5.7. Ownership Model
- 16.5.8. Pricing Model
- 16.5.9. End-users
- 16.6. France Vehicle-as-a-Service Market
- 16.6.1. Country Segmental Analysis
- 16.6.2. Service Type
- 16.6.3. Vehicle Type
- 16.6.4. Propulsion Type
- 16.6.5. Platform Type
- 16.6.6. Booking Type
- 16.6.7. Ownership Model
- 16.6.8. Pricing Model
- 16.6.9. End-users
- 16.7. Italy Vehicle-as-a-Service Market
- 16.7.1. Country Segmental Analysis
- 16.7.2. Service Type
- 16.7.3. Vehicle Type
- 16.7.4. Propulsion Type
- 16.7.5. Platform Type
- 16.7.6. Booking Type
- 16.7.7. Ownership Model
- 16.7.8. Pricing Model
- 16.7.9. End-users
- 16.8. Spain Vehicle-as-a-Service Market
- 16.8.1. Country Segmental Analysis
- 16.8.2. Service Type
- 16.8.3. Vehicle Type
- 16.8.4. Propulsion Type
- 16.8.5. Platform Type
- 16.8.6. Booking Type
- 16.8.7. Ownership Model
- 16.8.8. Pricing Model
- 16.8.9. End-users
- 16.9. Netherlands Vehicle-as-a-Service Market
- 16.9.1. Country Segmental Analysis
- 16.9.2. Service Type
- 16.9.3. Vehicle Type
- 16.9.4. Propulsion Type
- 16.9.5. Platform Type
- 16.9.6. Booking Type
- 16.9.7. Ownership Model
- 16.9.8. Pricing Model
- 16.9.9. End-users
- 16.10. Nordic Countries Vehicle-as-a-Service Market
- 16.10.1. Country Segmental Analysis
- 16.10.2. Service Type
- 16.10.3. Vehicle Type
- 16.10.4. Propulsion Type
- 16.10.5. Platform Type
- 16.10.6. Booking Type
- 16.10.7. Ownership Model
- 16.10.8. Pricing Model
- 16.10.9. End-users
- 16.11. Poland Vehicle-as-a-Service Market
- 16.11.1. Country Segmental Analysis
- 16.11.2. Service Type
- 16.11.3. Vehicle Type
- 16.11.4. Propulsion Type
- 16.11.5. Platform Type
- 16.11.6. Booking Type
- 16.11.7. Ownership Model
- 16.11.8. Pricing Model
- 16.11.9. End-users
- 16.12. Russia & CIS Vehicle-as-a-Service Market
- 16.12.1. Country Segmental Analysis
- 16.12.2. Service Type
- 16.12.3. Vehicle Type
- 16.12.4. Propulsion Type
- 16.12.5. Platform Type
- 16.12.6. Booking Type
- 16.12.7. Ownership Model
- 16.12.8. Pricing Model
- 16.12.9. End-users
- 16.13. Rest of Europe Vehicle-as-a-Service Market
- 16.13.1. Country Segmental Analysis
- 16.13.2. Service Type
- 16.13.3. Vehicle Type
- 16.13.4. Propulsion Type
- 16.13.5. Platform Type
- 16.13.6. Booking Type
- 16.13.7. Ownership Model
- 16.13.8. Pricing Model
- 16.13.9. End-users
- 17. Asia Pacific Vehicle-as-a-Service Market Analysis
- 17.1. Key Segment Analysis
- 17.2. Regional Snapshot
- 17.3. Asia Pacific Vehicle-as-a-Service Market Size (Value - US$ Bn), Analysis, and Forecasts, 2021-2035
- 17.3.1. Service Type
- 17.3.2. Vehicle Type
- 17.3.3. Propulsion Type
- 17.3.4. Platform Type
- 17.3.5. Booking Type
- 17.3.6. Ownership Model
- 17.3.7. Pricing Model
- 17.3.8. End-users
- 17.3.9. Country
- 17.3.9.1. China
- 17.3.9.2. India
- 17.3.9.3. Japan
- 17.3.9.4. South Korea
- 17.3.9.5. Australia and New Zealand
- 17.3.9.6. Indonesia
- 17.3.9.7. Malaysia
- 17.3.9.8. Thailand
- 17.3.9.9. Vietnam
- 17.3.9.10. Rest of Asia Pacific
- 17.4. China Vehicle-as-a-Service Market
- 17.4.1. Country Segmental Analysis
- 17.4.2. Service Type
- 17.4.3. Vehicle Type
- 17.4.4. Propulsion Type
- 17.4.5. Platform Type
- 17.4.6. Booking Type
- 17.4.7. Ownership Model
- 17.4.8. Pricing Model
- 17.4.9. End-users
- 17.5. India Vehicle-as-a-Service Market
- 17.5.1. Country Segmental Analysis
- 17.5.2. Service Type
- 17.5.3. Vehicle Type
- 17.5.4. Propulsion Type
- 17.5.5. Platform Type
- 17.5.6. Booking Type
- 17.5.7. Ownership Model
- 17.5.8. Pricing Model
- 17.5.9. End-users
- 17.6. Japan Vehicle-as-a-Service Market
- 17.6.1. Country Segmental Analysis
- 17.6.2. Service Type
- 17.6.3. Vehicle Type
- 17.6.4. Propulsion Type
- 17.6.5. Platform Type
- 17.6.6. Booking Type
- 17.6.7. Ownership Model
- 17.6.8. Pricing Model
- 17.6.9. End-users
- 17.7. South Korea Vehicle-as-a-Service Market
- 17.7.1. Country Segmental Analysis
- 17.7.2. Service Type
- 17.7.3. Vehicle Type
- 17.7.4. Propulsion Type
- 17.7.5. Platform Type
- 17.7.6. Booking Type
- 17.7.7. Ownership Model
- 17.7.8. Pricing Model
- 17.7.9. End-users
- 17.8. Australia and New Zealand Vehicle-as-a-Service Market
- 17.8.1. Country Segmental Analysis
- 17.8.2. Service Type
- 17.8.3. Vehicle Type
- 17.8.4. Propulsion Type
- 17.8.5. Platform Type
- 17.8.6. Booking Type
- 17.8.7. Ownership Model
- 17.8.8. Pricing Model
- 17.8.9. End-users
- 17.9. Indonesia Vehicle-as-a-Service Market
- 17.9.1. Country Segmental Analysis
- 17.9.2. Service Type
- 17.9.3. Vehicle Type
- 17.9.4. Propulsion Type
- 17.9.5. Platform Type
- 17.9.6. Booking Type
- 17.9.7. Ownership Model
- 17.9.8. Pricing Model
- 17.9.9. End-users
- 17.10. Malaysia Vehicle-as-a-Service Market
- 17.10.1. Country Segmental Analysis
- 17.10.2. Service Type
- 17.10.3. Vehicle Type
- 17.10.4. Propulsion Type
- 17.10.5. Platform Type
- 17.10.6. Booking Type
- 17.10.7. Ownership Model
- 17.10.8. Pricing Model
- 17.10.9. End-users
- 17.11. Thailand Vehicle-as-a-Service Market
- 17.11.1. Country Segmental Analysis
- 17.11.2. Service Type
- 17.11.3. Vehicle Type
- 17.11.4. Propulsion Type
- 17.11.5. Platform Type
- 17.11.6. Booking Type
- 17.11.7. Ownership Model
- 17.11.8. Pricing Model
- 17.11.9. End-users
- 17.12. Vietnam Vehicle-as-a-Service Market
- 17.12.1. Country Segmental Analysis
- 17.12.2. Service Type
- 17.12.3. Vehicle Type
- 17.12.4. Propulsion Type
- 17.12.5. Platform Type
- 17.12.6. Booking Type
- 17.12.7. Ownership Model
- 17.12.8. Pricing Model
- 17.12.9. End-users
- 17.13. Rest of Asia Pacific Vehicle-as-a-Service Market
- 17.13.1. Country Segmental Analysis
- 17.13.2. Service Type
- 17.13.3. Vehicle Type
- 17.13.4. Propulsion Type
- 17.13.5. Platform Type
- 17.13.6. Booking Type
- 17.13.7. Ownership Model
- 17.13.8. Pricing Model
- 17.13.9. End-users
- 18. Middle East Vehicle-as-a-Service Market Analysis
- 18.1. Key Segment Analysis
- 18.2. Regional Snapshot
- 18.3. Middle East Vehicle-as-a-Service Market Size (Value - US$ Bn), Analysis, and Forecasts, 2021-2035
- 18.3.1. Service Type
- 18.3.2. Vehicle Type
- 18.3.3. Propulsion Type
- 18.3.4. Platform Type
- 18.3.5. Booking Type
- 18.3.6. Ownership Model
- 18.3.7. Pricing Model
- 18.3.8. End-users
- 18.3.9. Country
- 18.3.9.1. Turkey
- 18.3.9.2. UAE
- 18.3.9.3. Saudi Arabia
- 18.3.9.4. Israel
- 18.3.9.5. Rest of Middle East
- 18.4. Turkey Vehicle-as-a-Service Market
- 18.4.1. Country Segmental Analysis
- 18.4.2. Service Type
- 18.4.3. Vehicle Type
- 18.4.4. Propulsion Type
- 18.4.5. Platform Type
- 18.4.6. Booking Type
- 18.4.7. Ownership Model
- 18.4.8. Pricing Model
- 18.4.9. End-users
- 18.5. UAE Vehicle-as-a-Service Market
- 18.5.1. Country Segmental Analysis
- 18.5.2. Service Type
- 18.5.3. Vehicle Type
- 18.5.4. Propulsion Type
- 18.5.5. Platform Type
- 18.5.6. Booking Type
- 18.5.7. Ownership Model
- 18.5.8. Pricing Model
- 18.5.9. End-users
- 18.6. Saudi Arabia Vehicle-as-a-Service Market
- 18.6.1. Country Segmental Analysis
- 18.6.2. Service Type
- 18.6.3. Vehicle Type
- 18.6.4. Propulsion Type
- 18.6.5. Platform Type
- 18.6.6. Booking Type
- 18.6.7. Ownership Model
- 18.6.8. Pricing Model
- 18.6.9. End-users
- 18.7. Israel Vehicle-as-a-Service Market
- 18.7.1. Country Segmental Analysis
- 18.7.2. Service Type
- 18.7.3. Vehicle Type
- 18.7.4. Propulsion Type
- 18.7.5. Platform Type
- 18.7.6. Booking Type
- 18.7.7. Ownership Model
- 18.7.8. Pricing Model
- 18.7.9. End-users
- 18.8. Rest of Middle East Vehicle-as-a-Service Market
- 18.8.1. Country Segmental Analysis
- 18.8.2. Service Type
- 18.8.3. Vehicle Type
- 18.8.4. Propulsion Type
- 18.8.5. Platform Type
- 18.8.6. Booking Type
- 18.8.7. Ownership Model
- 18.8.8. Pricing Model
- 18.8.9. End-users
- 19. Africa Vehicle-as-a-Service Market Analysis
- 19.1. Key Segment Analysis
- 19.2. Regional Snapshot
- 19.3. Africa Vehicle-as-a-Service Market Size (Value - US$ Bn), Analysis, and Forecasts, 2021-2035
- 19.3.1. Service Type
- 19.3.2. Vehicle Type
- 19.3.3. Propulsion Type
- 19.3.4. Platform Type
- 19.3.5. Booking Type
- 19.3.6. Ownership Model
- 19.3.7. Pricing Model
- 19.3.8. End-users
- 19.3.9. Country
- 19.3.9.1. South Africa
- 19.3.9.2. Egypt
- 19.3.9.3. Nigeria
- 19.3.9.4. Algeria
- 19.3.9.5. Rest of Africa
- 19.4. South Africa Vehicle-as-a-Service Market
- 19.4.1. Country Segmental Analysis
- 19.4.2. Service Type
- 19.4.3. Vehicle Type
- 19.4.4. Propulsion Type
- 19.4.5. Platform Type
- 19.4.6. Booking Type
- 19.4.7. Ownership Model
- 19.4.8. Pricing Model
- 19.4.9. End-users
- 19.5. Egypt Vehicle-as-a-Service Market
- 19.5.1. Country Segmental Analysis
- 19.5.2. Service Type
- 19.5.3. Vehicle Type
- 19.5.4. Propulsion Type
- 19.5.5. Platform Type
- 19.5.6. Booking Type
- 19.5.7. Ownership Model
- 19.5.8. Pricing Model
- 19.5.9. End-users
- 19.6. Nigeria Vehicle-as-a-Service Market
- 19.6.1. Country Segmental Analysis
- 19.6.2. Service Type
- 19.6.3. Vehicle Type
- 19.6.4. Propulsion Type
- 19.6.5. Platform Type
- 19.6.6. Booking Type
- 19.6.7. Ownership Model
- 19.6.8. Pricing Model
- 19.6.9. End-users
- 19.7. Algeria Vehicle-as-a-Service Market
- 19.7.1. Country Segmental Analysis
- 19.7.2. Service Type
- 19.7.3. Vehicle Type
- 19.7.4. Propulsion Type
- 19.7.5. Platform Type
- 19.7.6. Booking Type
- 19.7.7. Ownership Model
- 19.7.8. Pricing Model
- 19.7.9. End-users
- 19.8. Rest of Africa Vehicle-as-a-Service Market
- 19.8.1. Country Segmental Analysis
- 19.8.2. Service Type
- 19.8.3. Vehicle Type
- 19.8.4. Propulsion Type
- 19.8.5. Platform Type
- 19.8.6. Booking Type
- 19.8.7. Ownership Model
- 19.8.8. Pricing Model
- 19.8.9. End-users
- 20. South America Vehicle-as-a-Service Market Analysis
- 20.1. Key Segment Analysis
- 20.2. Regional Snapshot
- 20.3. South America Vehicle-as-a-Service Market Size (Value - US$ Bn), Analysis, and Forecasts, 2021-2035
- 20.3.1. Service Type
- 20.3.2. Vehicle Type
- 20.3.3. Propulsion Type
- 20.3.4. Platform Type
- 20.3.5. Booking Type
- 20.3.6. Ownership Model
- 20.3.7. Pricing Model
- 20.3.8. End-users
- 20.3.9. Country
- 20.3.9.1. Brazil
- 20.3.9.2. Argentina
- 20.3.9.3. Rest of South America
- 20.4. Brazil Vehicle-as-a-Service Market
- 20.4.1. Country Segmental Analysis
- 20.4.2. Service Type
- 20.4.3. Vehicle Type
- 20.4.4. Propulsion Type
- 20.4.5. Platform Type
- 20.4.6. Booking Type
- 20.4.7. Ownership Model
- 20.4.8. Pricing Model
- 20.4.9. End-users
- 20.5. Argentina Vehicle-as-a-Service Market
- 20.5.1. Country Segmental Analysis
- 20.5.2. Service Type
- 20.5.3. Vehicle Type
- 20.5.4. Propulsion Type
- 20.5.5. Platform Type
- 20.5.6. Booking Type
- 20.5.7. Ownership Model
- 20.5.8. Pricing Model
- 20.5.9. End-users
- 20.6. Rest of South America Vehicle-as-a-Service Market
- 20.6.1. Country Segmental Analysis
- 20.6.2. Service Type
- 20.6.3. Vehicle Type
- 20.6.4. Propulsion Type
- 20.6.5. Platform Type
- 20.6.6. Booking Type
- 20.6.7. Ownership Model
- 20.6.8. Pricing Model
- 20.6.9. End-users
- 21. Key Players/ Company Profile
- 21.1. Avis Budget Group Inc.
- 21.1.1. Company Details/ Overview
- 21.1.2. Company Financials
- 21.1.3. Key Customers and Competitors
- 21.1.4. Business/ Industry Portfolio
- 21.1.5. Product Portfolio/ Specification Details
- 21.1.6. Pricing Data
- 21.1.7. Strategic Overview
- 21.1.8. Recent Developments
- 21.2. BlaBlaCar
- 21.3. Bolt Technology OÜ
- 21.4. Car2Go
- 21.5. Careem
- 21.6. Didi Chuxing Technology Co.
- 21.7. Enterprise Holdings Inc.
- 21.8. Europcar Mobility Group
- 21.9. Getaround Inc.
- 21.10. Gett Inc.
- 21.11. Grab Holdings Inc.
- 21.12. Hertz Global Holdings Inc.
- 21.13. Lyft Inc.
- 21.14. Maven
- 21.15. Ola Cabs
- 21.16. ReachNow
- 21.17. Sixt SE
- 21.18. Tier Mobility GmbH
- 21.19. Turo Inc.
- 21.20. Uber Technologies Inc.
- 21.21. Voi Technology AB
- 21.22. Zipcar
- 21.23. Zoomcar
- 21.24. Other Key Players
- 21.1. Avis Budget Group Inc.
Note* - This is just tentative list of players. While providing the report, we will cover more number of players based on their revenue and share for each geography
Research Design
Our research design integrates both demand-side and supply-side analysis through a balanced combination of primary and secondary research methodologies. By utilizing both bottom-up and top-down approaches alongside rigorous data triangulation methods, we deliver robust market intelligence that supports strategic decision-making.
MarketGenics' comprehensive research design framework ensures the delivery of accurate, reliable, and actionable market intelligence. Through the integration of multiple research approaches, rigorous validation processes, and expert analysis, we provide our clients with the insights needed to make informed strategic decisions and capitalize on market opportunities.

MarketGenics leverages a dedicated industry panel of experts and a comprehensive suite of paid databases to effectively collect, consolidate, and analyze market intelligence.
Our approach has consistently proven to be reliable and effective in generating accurate market insights, identifying key industry trends, and uncovering emerging business opportunities.
Through both primary and secondary research, we capture and analyze critical company-level data such as manufacturing footprints, including technical centers, R&D facilities, sales offices, and headquarters.
Our expert panel further enhances our ability to estimate market size for specific brands based on validated field-level intelligence.
Our data mining techniques incorporate both parametric and non-parametric methods, allowing for structured data collection, sorting, processing, and cleaning.
Demand projections are derived from large-scale data sets analyzed through proprietary algorithms, culminating in robust and reliable market sizing.
Research Approach
The bottom-up approach builds market estimates by starting with the smallest addressable market units and systematically aggregating them to create comprehensive market size projections.
This method begins with specific, granular data points and builds upward to create the complete market landscape.
Customer Analysis → Segmental Analysis → Geographical Analysis
The top-down approach starts with the broadest possible market data and systematically narrows it down through a series of filters and assumptions to arrive at specific market segments or opportunities.
This method begins with the big picture and works downward to increasingly specific market slices.
TAM → SAM → SOM


Research Methods
Desk / Secondary Research
While analysing the market, we extensively study secondary sources, directories, and databases to identify and collect information useful for this technical, market-oriented, and commercial report. Secondary sources that we utilize are not only the public sources, but it is a combination of Open Source, Associations, Paid Databases, MG Repository & Knowledgebase, and others.
- Company websites, annual reports, financial reports, broker reports, and investor presentations
- National government documents, statistical databases and reports
- News articles, press releases and web-casts specific to the companies operating in the market, Magazines, reports, and others
- We gather information from commercial data sources for deriving company specific data such as segmental revenue, share for geography, product revenue, and others
- Internal and external proprietary databases (industry-specific), relevant patent, and regulatory databases
- Governing Bodies, Government Organizations
- Relevant Authorities, Country-specific Associations for Industries
We also employ the model mapping approach to estimate the product level market data through the players' product portfolio
Primary Research
Primary research/ interviews is vital in analyzing the market. Most of the cases involves paid primary interviews. Primary sources include primary interviews through e-mail interactions, telephonic interviews, surveys as well as face-to-face interviews with the different stakeholders across the value chain including several industry experts.
| Type of Respondents | Number of Primaries |
|---|---|
| Tier 2/3 Suppliers | ~20 |
| Tier 1 Suppliers | ~25 |
| End-users | ~25 |
| Industry Expert/ Panel/ Consultant | ~30 |
| Total | ~100 |
MG Knowledgebase
• Repository of industry blog, newsletter and case studies
• Online platform covering detailed market reports, and company profiles
Forecasting Factors and Models
Forecasting Factors
- Historical Trends – Past market patterns, cycles, and major events that shaped how markets behave over time. Understanding past trends helps predict future behavior.
- Industry Factors – Specific characteristics of the industry like structure, regulations, and innovation cycles that affect market dynamics.
- Macroeconomic Factors – Economic conditions like GDP growth, inflation, and employment rates that affect how much money people have to spend.
- Demographic Factors – Population characteristics like age, income, and location that determine who can buy your product.
- Technology Factors – How quickly people adopt new technology and how much technology infrastructure exists.
- Regulatory Factors – Government rules, laws, and policies that can help or restrict market growth.
- Competitive Factors – Analyzing competition structure such as degree of competition and bargaining power of buyers and suppliers.
Forecasting Models / Techniques
Multiple Regression Analysis
- Identify and quantify factors that drive market changes
- Statistical modeling to establish relationships between market drivers and outcomes
Time Series Analysis – Seasonal Patterns
- Understand regular cyclical patterns in market demand
- Advanced statistical techniques to separate trend, seasonal, and irregular components
Time Series Analysis – Trend Analysis
- Identify underlying market growth patterns and momentum
- Statistical analysis of historical data to project future trends
Expert Opinion – Expert Interviews
- Gather deep industry insights and contextual understanding
- In-depth interviews with key industry stakeholders
Multi-Scenario Development
- Prepare for uncertainty by modeling different possible futures
- Creating optimistic, pessimistic, and most likely scenarios
Time Series Analysis – Moving Averages
- Sophisticated forecasting for complex time series data
- Auto-regressive integrated moving average models with seasonal components
Econometric Models
- Apply economic theory to market forecasting
- Sophisticated economic models that account for market interactions
Expert Opinion – Delphi Method
- Harness collective wisdom of industry experts
- Structured, multi-round expert consultation process
Monte Carlo Simulation
- Quantify uncertainty and probability distributions
- Thousands of simulations with varying input parameters
Research Analysis
Our research framework is built upon the fundamental principle of validating market intelligence from both demand and supply perspectives. This dual-sided approach ensures comprehensive market understanding and reduces the risk of single-source bias.
Demand-Side Analysis: We understand end-user/application behavior, preferences, and market needs along with the penetration of the product for specific application.
Supply-Side Analysis: We estimate overall market revenue, analyze the segmental share along with industry capacity, competitive landscape, and market structure.
Validation & Evaluation
Data triangulation is a validation technique that uses multiple methods, sources, or perspectives to examine the same research question, thereby increasing the credibility and reliability of research findings. In market research, triangulation serves as a quality assurance mechanism that helps identify and minimize bias, validate assumptions, and ensure accuracy in market estimates.
- Data Source Triangulation – Using multiple data sources to examine the same phenomenon
- Methodological Triangulation – Using multiple research methods to study the same research question
- Investigator Triangulation – Using multiple researchers or analysts to examine the same data
- Theoretical Triangulation – Using multiple theoretical perspectives to interpret the same data

Custom Market Research Services
We will customise the research for you, in case the report listed above does not meet your requirements.
Get 10% Free Customisation