Virtual Reality Market Size, Share & Trends Analysis Report by Component (Hardware, Software, Services), Technology, Content Type, Deployment Mode, Organization Size, Functionality, Revenue Model, Application, End-User Industry and Geography (North America, Europe, Asia Pacific, Middle East, Africa, and South America) – Global Industry Data, Trends, and Forecasts, 2026–2035
|
Market Structure & Evolution |
|
|
Segmental Data Insights |
|
|
Demand Trends |
|
|
Competitive Landscape |
|
|
Strategic Development |
|
|
Future Outlook & Opportunities |
|
Virtual Reality Market Size, Share, and Growth
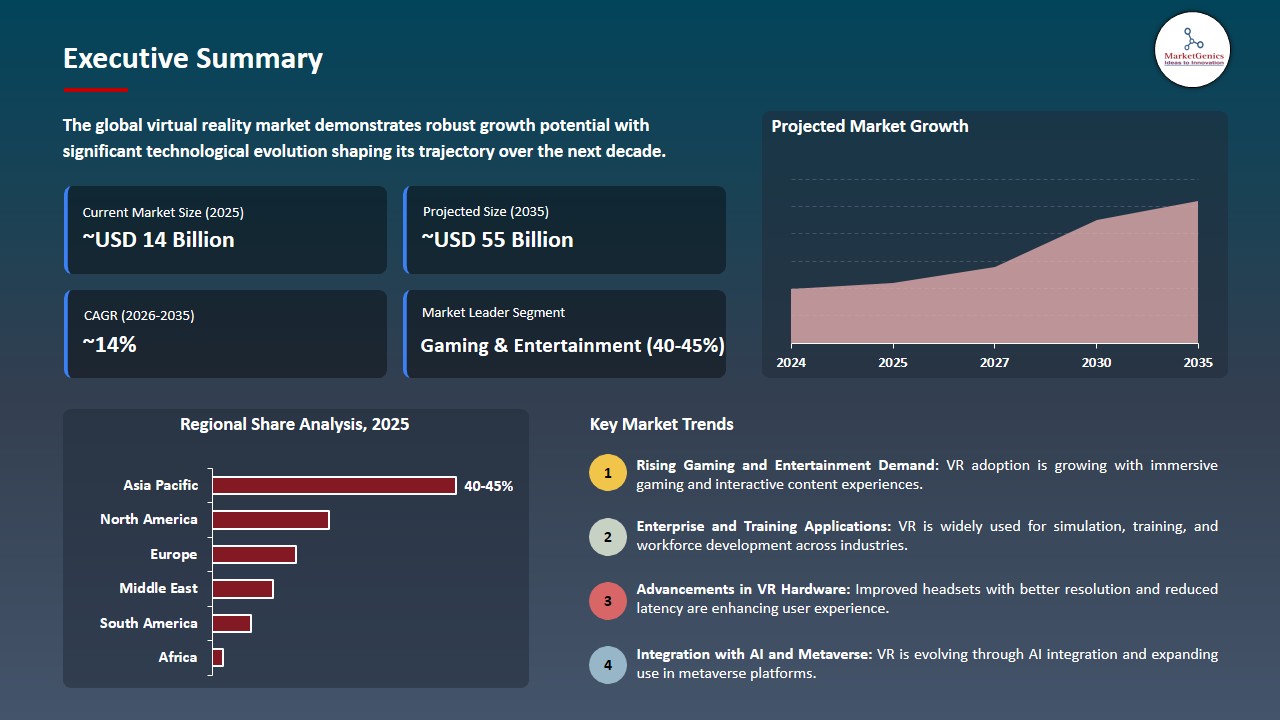
The global virtual reality market is experiencing robust growth, with its estimated value of USD 14.4 billion in the year 2025 and USD 55.2 billion by 2035, registering a CAGR of 14.3% % during the forecast period. Globally, the virtual reality market is experiencing robust growth due to increased use of immersive technologies and the rise of VR usage for gaming, enterprise applications, and training.
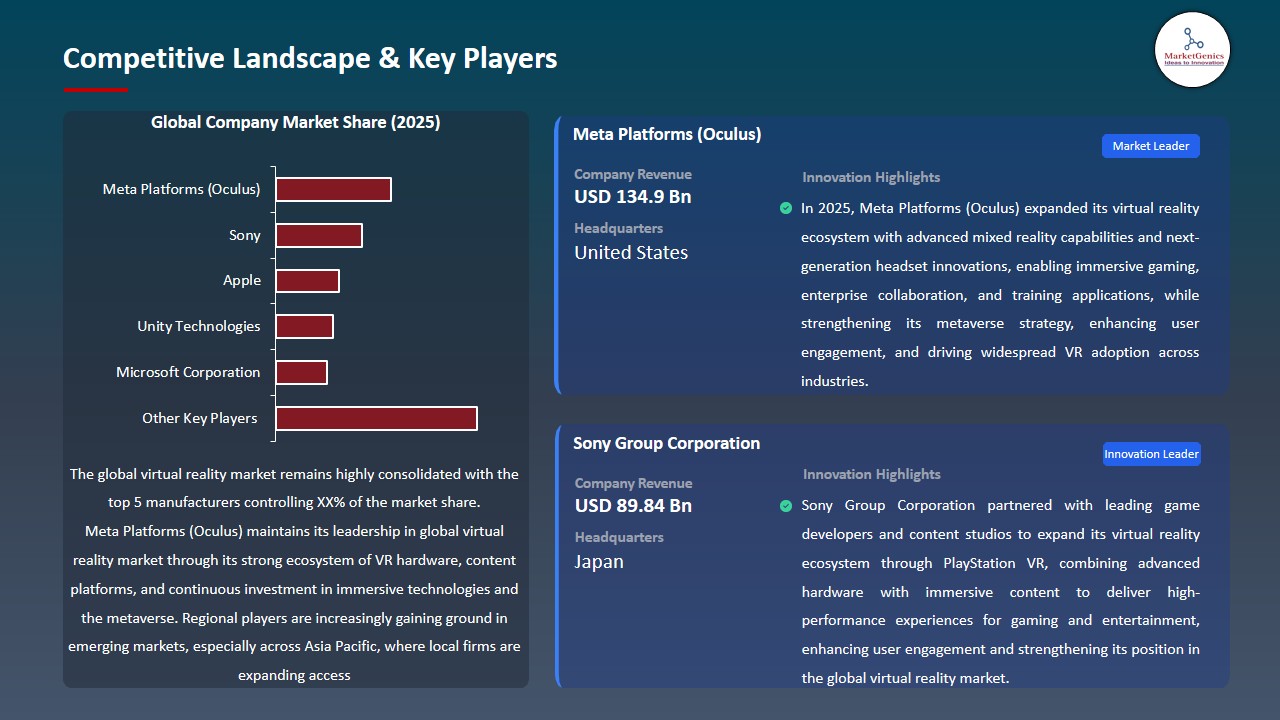
Mark Zuckerberg, the CEO of Meta Platforms, Inc. noted, The next platform is likely to be a lot more immersive an embodied internet where you’re literally in the experience rather than just looking at it, thus emphasizing the aspect of virtual reality in creating immersive settings, improving user interaction, and leading the development of digital experiences and the metaverse.
The development of hardware and software related to virtual reality has led to expanded realism, interactivity, and user experience in virtual reality. Sony Group Corporation's expansion of its PlayStation VR2 ecosystem is likely to improve the quality and diversity of content that can be created for the headset in 2024. This is likely to foster the growth of immersive gaming.
At the same time, the growth of the virtual reality market has been facilitated by companies adopting simulation-based training and collaborating virtually within the healthcare, manufacturing, and defense industries. HTC Corporation is creating enterprise VR solutions through its VIVE platform that is likely to provide safe, cost-effective training for employees and help them to collaborate remotely in a virtual environment.
Furthermore, the integration of artificial intelligence (AI) and real-time rendering technologies into enterprise VR solutions is likely to enable these companies to create scalable deployments for the technologies they utilize.
Additionally, there are numerous ancillary opportunities related to creating virtual reality content, haptic technology, immersive training platforms, and creating digital twin spaces. Companies that are able to successfully leverage these ancillary opportunities is likely to increase the level of engagement their customers have with their products and services, provide additional use case scenarios for their services, and create additional streams of revenue.
Virtual Reality Market Dynamics and Trends
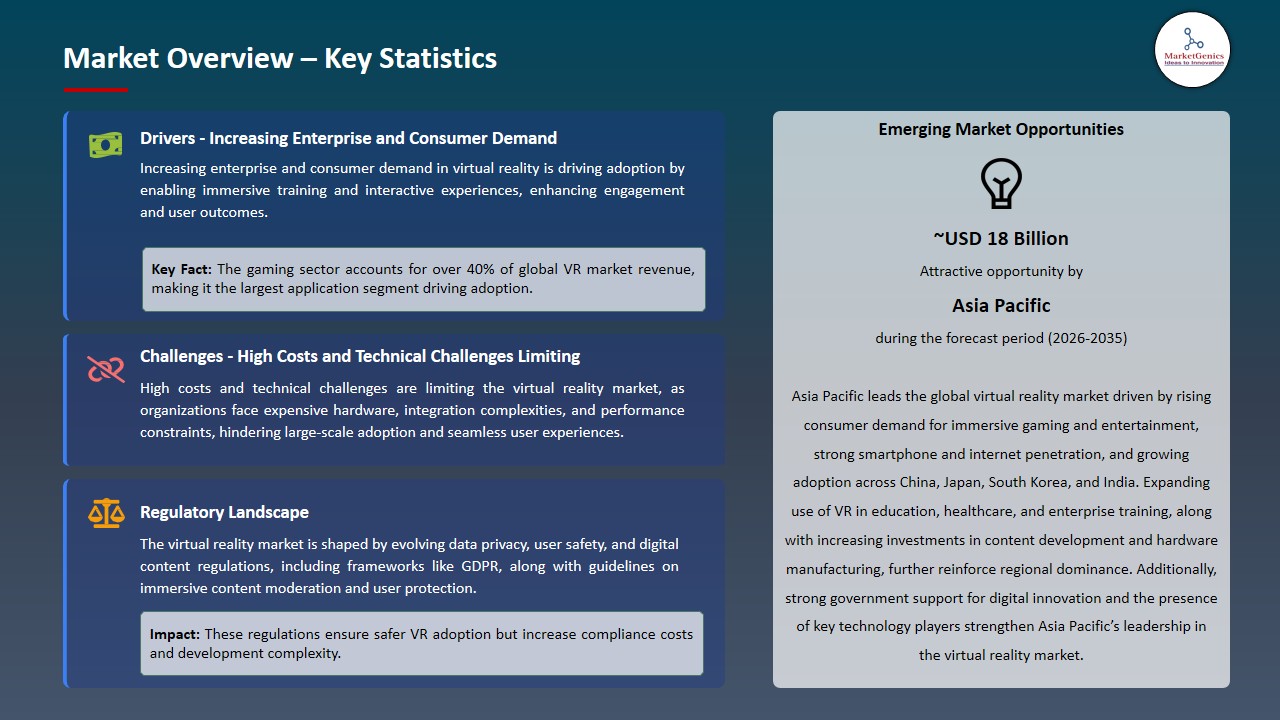
Driver: Increasing Enterprise and Consumer Demand Driving Virtual Reality Adoption
-
Rapid growth within the virtual reality market can be attributed to the increasing use of VR by enterprises in industries such as healthcare, manufacturing, retail and education; along with an increase in consumer demand for more immersive gaming and entertainment experiences. These enterprises are finding ways to leverage VR technology to improve training efficiencies, lower operational risks, and improve engagement with customers.
- There has also been a supportive regulatory environment focused on encouraging digital innovation through regulations that support data privacy and safety standards in deploying VR solutions throughout both the North American and European Union markets. As an example of this, Unity Technologies developed and released advanced AR/VR development tools in 2024 which integrated artificial intelligence and analytics to allow enterprises to build immersive applications that are secure and compliant.
- The continued increase in digital/remote work across many industries is likely to keep accelerating deployment of VR technology resulting in increased productivity as well as enhancement of user experiences through the use of VR tools. All these factors are likely to continue to escalate the growth of the virtual reality market.
Restraint: High Costs and Technical Challenges Limiting Widespread Virtual Reality Adoption
-
Growing use of virtual reality technology is limited due to the expensive price associated with virtual reality hardware, developing content, & integrating systems, especially for small to medium-sized businesses (SMEs) or educational institutions.
- Some of the technical barriers include latency, motion sickness, and difficulty to use across all different types of platforms that leads to friction and slows down the rate of new users.
- Integrating legacy IT and operations processes into a comparable style of virtual reality development for organizations to achieve scale is still a considerable challenge as it relates to the secure management of classified information. All these factors are expected to restrict the expansion of the virtual reality market.
Opportunity: Expansion in Emerging Markets and Enterprise Applications
-
Companies in emerging markets throughout Asia-Pacific; Latin America; and the Middle East are beginning to use virtual reality (or VR) as part of their industrial training efforts etc., driven by the growing digital infrastructure and increasing mobile phone penetration rates in these regions.
- Technology companies have already begun partnering with local businesses and/or governments in these regions to implement virtual reality technology in various industries like health care systems, workforce training, and immersive educational solutions. For example, Lenovo Group Limited announced in 2025 that they had expanded its AR/VR portfolio throughout India, enabling enterprise adoption as well as educational use of these products.
- There is an abundance of opportunity for hardware vendors, software vendors, and content developers to take advantage of untapped markets by utilizing virtual reality technologies to provide their respective users with scalable software applications. However, it is expected to create more opportunities in future for virtual reality market.
Key Trend: Integration of AI, Cloud, and Real-Time 3D Environments Driving Virtual Reality Innovation
-
Current VR platforms use AI analytic abilities, 3D rendering in the moment of experience at once, and ability to use Cloud Technology to make an Intelligent, “aware of its surroundings”, and Very Interactive Immersive Experience.
- VR simulation, virtual collaboration, and Digital Twin technology are Changing Enterprise Operations with AI in conjunction with Motion Tracking and Behavioral Analysis allow greater level of interaction and ease of use.
- NVIDIA Omniverse, one of the leading companies in real-time collaborative VR environments, continues to develop their systems to be able to offer massive scale of multi-user access in Enterprise size. All these elements are expected to influence significant trends in the virtual reality market.
Virtual Reality Market Analysis and Segmental Data
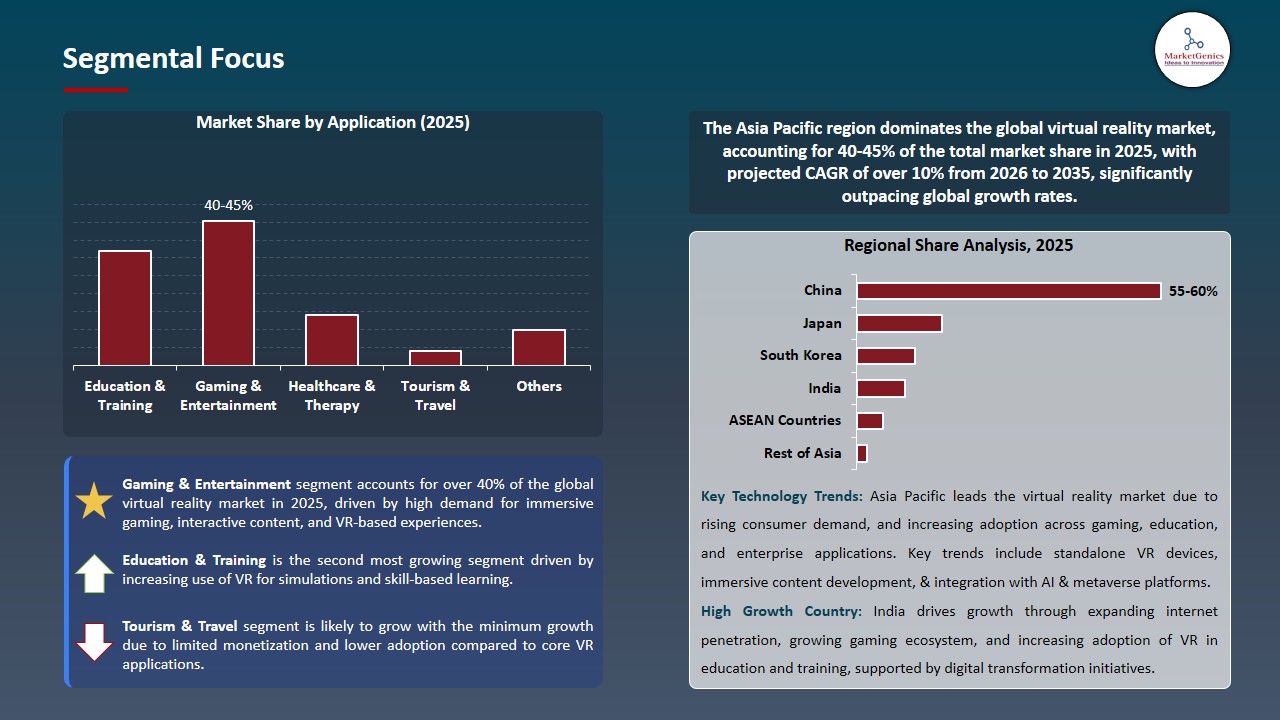
Gaming & Entertainment Segment Dominates Global Virtual Reality Market amid Growing Demand for Immersive Experiences
-
The gaming & entertainment market is leading the way in the global virtual reality market as an overall increase in gamer demand creates demand for experiences that are immersive, interactive and realistic. New technology in virtual reality hardware, such as HMD’s with high-resolution displays and the addition of motion-tracking controller devices, have increased the realism of VR gameplay and also increased the amount of user participation in gaming activity.
- Notably, in 2024 Valve Corporation expanded its SteamVR ecosystem by adding additional tracking and cross-platform support in an effort to continue to grow VR Gaming Collectively to achieve a more seamless and engaging way to play VR games around the globe.
- The emergence of VR arcades, e-sports and multiplayer gaming experiences are also being adopted to increase the amount of casual and professional gamers participating in these activities. Developers are now using content development platforms and game engines to create more sophisticated and interactive VR worlds, reinforcing the gaming and entertainment segment’s dominance in global virtual reality market.
Asia Pacific Dominates Virtual Reality Market amid Rapid Digital Infrastructure Expansion and Rising Enterprise Adoption
-
The Asia Pacific region has a very large market share in the virtual reality market driven by increasing digital infrastructure, high numbers of smartphones and internet access, and a rapidly growing number of companies using VR technology in health care, manufacturing, education and entertainment. The governments of this region have been supportive of VR deployment through their initiatives for promoting digital transformation to create smart cities.
- Furthermore, an increase in the amount of money flowing into the development of VR hardware, software and content is expected to help increase the overall adoption of virtual reality technology in all industry sectors, such as when Huawei Technologies Co., Ltd. launched VR products for the enterprise sector in 2025. These factors collectively reinforce the region’s leadership in the global virtual reality market.
Virtual Reality Market Ecosystem
The global virtual reality market is highly concentrated with Tier 1 companies, such as Meta Platforms, and Sony being responsible for innovations to the platforms; Tier 2 companies, such as HTC and Valve, delivering customized hardware and software solutions; and Tier 3 companies developing niche applications, revealing medium levels of concentration.
Key nodes in the value chain include hardware manufacturing and software/platform development which are vital to the growth of the ecosystem. For example, in 2024, Sony will expand its PlayStation VR2 ecosystem through improved hardware capabilities and increased production of immersive content; therefore, reinforcing the cooperation between companies across tiers and enhancing the competitiveness of the market for both consumer and enterprise applications.
Recent Development and Strategic Overview:
-
In July 2025, Epic Games’ Unreal Engine 6 VR development suite will enable creators to create realistic VR in rich, cross-platform environments using advanced physics simulation and real-time lighting, creating a whole new level of immersion for video games and business training purposes when it is made available.
- In September 2025, Varjo Technologies launched its first headset targeting enterprise markets. The XR-3 Enterprise is designed to help workers perform precise simulation and collaborate at a distance through real-time interaction while providing a means to develop designs for industries such as construction, medicine, and engineering.
Report Scope
|
Attribute |
Detail |
|
Market Size in 2025 |
USD 14.4 Bn |
|
Market Forecast Value in 2035 |
USD 55.2 Bn |
|
Growth Rate (CAGR) |
14.3% |
|
Forecast Period |
2026 – 2035 |
|
Historical Data Available for |
2021 – 2024 |
|
Market Size Units |
USD Bn for Value |
|
Report Format |
Electronic (PDF) + Excel |
|
Regions and Countries Covered |
|||||
|
North America |
Europe |
Asia Pacific |
Middle East |
Africa |
South America |
|
|
|
|
|
|
|
Companies Covered |
|||||
|
|
|
|
|
|
Virtual Reality Market Segmentation and Highlights
|
Segment |
Sub-segment |
|
Virtual Reality Market, By Component |
|
|
Virtual Reality Market, By Technology |
|
|
Virtual Reality Market, By Content Type |
|
|
Virtual Reality Market, By Deployment Mode |
|
|
Virtual Reality Market, By Organization Size |
|
|
Virtual Reality Market, By Functionality |
|
|
Virtual Reality Market, By Revenue Model |
|
|
Virtual Reality Market, By Application |
|
|
Virtual Reality Market, By End-User Industry |
|
Frequently Asked Questions
Table of Contents
- 1. Research Methodology and Assumptions
- 1.1. Definitions
- 1.2. Research Design and Approach
- 1.3. Data Collection Methods
- 1.4. Base Estimates and Calculations
- 1.5. Forecasting Models
- 1.5.1. Key Forecast Factors & Impact Analysis
- 1.6. Secondary Research
- 1.6.1. Open Sources
- 1.6.2. Paid Databases
- 1.6.3. Associations
- 1.7. Primary Research
- 1.7.1. Primary Sources
- 1.7.2. Primary Interviews with Stakeholders across Ecosystem
- 2. Executive Summary
- 2.1. Global Virtual Reality Market Outlook
- 2.1.1. Virtual Reality Market Size (Value - US$ Bn), and Forecasts, 2021-2035
- 2.1.2. Compounded Annual Growth Rate Analysis
- 2.1.3. Growth Opportunity Analysis
- 2.1.4. Segmental Share Analysis
- 2.1.5. Geographical Share Analysis
- 2.2. Market Analysis and Facts
- 2.3. Supply-Demand Analysis
- 2.4. Competitive Benchmarking
- 2.5. Go-to- Market Strategy
- 2.5.1. Customer/ End-use Industry Assessment
- 2.5.2. Growth Opportunity Data, 2026-2035
- 2.5.2.1. Regional Data
- 2.5.2.2. Country Data
- 2.5.2.3. Segmental Data
- 2.5.3. Identification of Potential Market Spaces
- 2.5.4. GAP Analysis
- 2.5.5. Potential Attractive Price Points
- 2.5.6. Prevailing Market Risks & Challenges
- 2.5.7. Preferred Sales & Marketing Strategies
- 2.5.8. Key Recommendations and Analysis
- 2.5.9. A Way Forward
- 2.1. Global Virtual Reality Market Outlook
- 3. Industry Data and Premium Insights
- 3.1. Global Information Technology & Media Ecosystem Overview, 2025
- 3.1.1. Information Technology & Media Ecosystem Analysis
- 3.1.2. Key Trends for Information Technology & Media Industry
- 3.1.3. Regional Distribution for Information Technology & Media Industry
- 3.2. Supplier Customer Data
- 3.3. Technology Roadmap and Developments
- 3.1. Global Information Technology & Media Ecosystem Overview, 2025
- 4. Market Overview
- 4.1. Market Dynamics
- 4.1.1. Drivers
- 4.1.1.1. Advances in VR hardware, software, and AI enhancing immersive experiences.
- 4.1.1.2. Rising enterprise adoption in healthcare, education, manufacturing, and retail.
- 4.1.1.3. Investments in 5G, edge computing, and cloud platforms enabling scalable deployment.
- 4.1.2. Restraints
- 4.1.2.1. High costs of VR hardware and software limiting adoption.
- 4.1.2.2. Technical challenges in complex or low-light environments.
- 4.1.2.3. Privacy and security concerns over VR data.
- 4.1.1. Drivers
- 4.2. Key Trend Analysis
- 4.3. Regulatory Framework
- 4.3.1. Key Regulations, Norms, and Subsidies, by Key Countries
- 4.3.2. Tariffs and Standards
- 4.3.3. Impact Analysis of Regulations on the Market
- 4.4. Value Chain Analysis
- 4.5. Cost Structure Analysis
- 4.6. Porter’s Five Forces Analysis
- 4.7. PESTEL Analysis
- 4.8. Global Virtual Reality Market Demand
- 4.8.1. Historical Market Size – Value (US$ Bn), 2020-2024
- 4.8.2. Current and Future Market Size – Value (US$ Bn), 2026–2035
- 4.8.2.1. Y-o-Y Growth Trends
- 4.8.2.2. Absolute $ Opportunity Assessment
- 4.1. Market Dynamics
- 5. Competition Landscape
- 5.1. Competition structure
- 5.1.1. Fragmented v/s consolidated
- 5.2. Company Share Analysis, 2025
- 5.2.1. Global Company Market Share
- 5.2.2. By Region
- 5.2.2.1. North America
- 5.2.2.2. Europe
- 5.2.2.3. Asia Pacific
- 5.2.2.4. Middle East
- 5.2.2.5. Africa
- 5.2.2.6. South America
- 5.3. Product Comparison Matrix
- 5.3.1. Specifications
- 5.3.2. Market Positioning
- 5.3.3. Pricing
- 5.1. Competition structure
- 6. Global Virtual Reality Market Analysis, by Component
- 6.1. Key Segment Analysis
- 6.2. Virtual Reality Market Size (Value - US$ Bn), Analysis, and Forecasts, by Component, 2021-2035
- 6.2.1. Hardware
- 6.2.1.1. Head-Mounted Displays (HMDs)
- 6.2.1.2. VR Headsets (Standalone)
- 6.2.1.3. Tethered VR Headsets (PC/Console)
- 6.2.1.4. VR Controllers & Input Devices
- 6.2.1.5. Motion Tracking Sensors & Cameras
- 6.2.1.6. Haptic Feedback Devices (Gloves, Suits)
- 6.2.1.7. VR Treadmills & Locomotion Platforms
- 6.2.1.8. VR-Ready PCs & Gaming Consoles
- 6.2.1.9. Audio Systems (3D/Spatial Audio)
- 6.2.1.10. Eye-Tracking Modules
- 6.2.1.11. Others
- 6.2.2. Software
- 6.2.2.1. VR Operating Systems & Firmware
- 6.2.2.2. VR Content/Experience Platforms
- 6.2.2.3. VR Development Engines & SDKs
- 6.2.2.4. Simulation & Visualization Software
- 6.2.2.5. VR Analytics & Performance Tools
- 6.2.2.6. VR Security & Access Control Software
- 6.2.2.7. VR Rendering & Graphics Software
- 6.2.2.8. VR Collaboration & Networking Software
- 6.2.2.9. Others
- 6.2.3. Services
- 6.2.3.1. Consulting & Strategy Services
- 6.2.3.2. Implementation & Deployment Services
- 6.2.3.3. VR Content Creation Services
- 6.2.3.4. Custom VR Application Development
- 6.2.3.5. Integration & System Integration Services
- 6.2.3.6. Training & Education Services
- 6.2.3.7. Support & Maintenance Services
- 6.2.3.8. Managed VR Services
- 6.2.3.9. Testing & Quality Assurance Services
- 6.2.3.10. Others
- 6.2.1. Hardware
- 7. Global Virtual Reality Market Analysis, by Technology
- 7.1. Key Segment Analysis
- 7.2. Virtual Reality Market Size (Value - US$ Bn), Analysis, and Forecasts, by Technology, 2021-2035
- 7.2.1. Tethered VR
- 7.2.2. Standalone VR
- 7.2.3. Mobile VR
- 7.2.4. PC-Based VR
- 7.2.5. Console VR
- 7.2.6. Others
- 8. Global Virtual Reality Market Analysis, by Content Type
- 8.1. Key Segment Analysis
- 8.2. Virtual Reality Market Size (Value - US$ Bn), Analysis, and Forecasts, by Content Type, 2021-2035
- 8.2.1. 2D VR Content
- 8.2.2. 3D VR Content
- 8.2.3. 360° Videos
- 8.2.4. Interactive VR Experiences
- 8.2.5. Others
- 9. Global Virtual Reality Market Analysis, by Deployment Mode
- 9.1. Key Segment Analysis
- 9.2. Virtual Reality Market Size (Value - US$ Bn), Analysis, and Forecasts, by Deployment Mode, 2021-2035
- 9.2.1. On-Premise
- 9.2.2. Cloud-Based
- 9.2.3. Hybrid
- 10. Global Virtual Reality Market Analysis, by Organization Size
- 10.1. Key Segment Analysis
- 10.2. Virtual Reality Market Size (Value - US$ Bn), Analysis, and Forecasts, by Organization Size, 2021-2035
- 10.2.1. Large Enterprises
- 10.2.2. Small & Medium-Sized Enterprises (SMEs)
- 11. Global Virtual Reality Market Analysis, by Functionality
- 11.1. Key Segment Analysis
- 11.2. Virtual Reality Market Size (Value - US$ Bn), Analysis, and Forecasts, by Functionality, 2021-2035
- 11.2.1. Real-Time Rendering
- 11.2.2. Motion Tracking
- 11.2.3. Spatial Audio
- 11.2.4. Gesture Recognition
- 11.2.5. Multiplayer/Networking
- 11.2.6. Others
- 12. Global Virtual Reality Market Analysis, by Revenue Model
- 12.1. Key Segment Analysis
- 12.2. Virtual Reality Market Size (Value - US$ Bn), Analysis, and Forecasts, by Revenue Model, 2021-2035
- 12.2.1. Subscription
- 12.2.2. License Fee
- 12.2.3. Pay-Per-Use
- 12.2.4. Freemium
- 13. Global Virtual Reality Market Analysis, by Application
- 13.1. Key Segment Analysis
- 13.2. Virtual Reality Market Size (Value - US$ Bn), Analysis, and Forecasts, by Application, 2021-2035
- 13.2.1. Gaming & Entertainment
- 13.2.2. Education & Training
- 13.2.3. Healthcare & Therapy
- 13.2.4. Industrial & Manufacturing
- 13.2.5. Retail & E-Commerce
- 13.2.6. Real Estate & Architecture
- 13.2.7. Military & Defense
- 13.2.8. Media & Advertising
- 13.2.9. Tourism & Travel
- 13.2.10. Others
- 14. Global Virtual Reality Market Analysis, by End-User Industry
- 14.1. Key Segment Analysis
- 14.2. Virtual Reality Market Size (Value - US$ Bn), Analysis, and Forecasts, by End-User Industry, 2021-2035
- 14.2.1. Consumer
- 14.2.2. Enterprise
- 14.2.3. Healthcare
- 14.2.4. Education
- 14.2.5. Automotive
- 14.2.6. Manufacturing
- 14.2.7. Media & Entertainment
- 14.2.8. Retail
- 14.2.9. Others
- 15. Global Virtual Reality Market Analysis and Forecasts, by Region
- 15.1. Key Findings
- 15.2. Virtual Reality Market Size (Value - US$ Bn), Analysis, and Forecasts, by Region, 2021-2035
- 15.2.1. North America
- 15.2.2. Europe
- 15.2.3. Asia Pacific
- 15.2.4. Middle East
- 15.2.5. Africa
- 15.2.6. South America
- 16. North America Virtual Reality Market Analysis
- 16.1. Key Segment Analysis
- 16.2. Regional Snapshot
- 16.3. North America Virtual Reality Market Size (Value - US$ Bn), Analysis, and Forecasts, 2021-2035
- 16.3.1. Component
- 16.3.2. Technology
- 16.3.3. Content Type
- 16.3.4. Deployment Mode
- 16.3.5. Organization Size
- 16.3.6. Functionality
- 16.3.7. Revenue Model
- 16.3.8. Application
- 16.3.9. End-User Industry
- 16.3.10. Country
- 16.3.10.1. USA
- 16.3.10.2. Canada
- 16.3.10.3. Mexico
- 16.4. USA Virtual Reality Market
- 16.4.1. Country Segmental Analysis
- 16.4.2. Component
- 16.4.3. Technology
- 16.4.4. Content Type
- 16.4.5. Deployment Mode
- 16.4.6. Organization Size
- 16.4.7. Functionality
- 16.4.8. Revenue Model
- 16.4.9. Application
- 16.4.10. End-User Industry
- 16.5. Canada Virtual Reality Market
- 16.5.1. Country Segmental Analysis
- 16.5.2. Component
- 16.5.3. Technology
- 16.5.4. Content Type
- 16.5.5. Deployment Mode
- 16.5.6. Organization Size
- 16.5.7. Functionality
- 16.5.8. Revenue Model
- 16.5.9. Application
- 16.5.10. End-User Industry
- 16.6. Mexico Virtual Reality Market
- 16.6.1. Country Segmental Analysis
- 16.6.2. Component
- 16.6.3. Technology
- 16.6.4. Content Type
- 16.6.5. Deployment Mode
- 16.6.6. Organization Size
- 16.6.7. Functionality
- 16.6.8. Revenue Model
- 16.6.9. Application
- 16.6.10. End-User Industry
- 17. Europe Virtual Reality Market Analysis
- 17.1. Key Segment Analysis
- 17.2. Regional Snapshot
- 17.3. Europe Virtual Reality Market Size (Value - US$ Bn), Analysis, and Forecasts, 2021-2035
- 17.3.1. Component
- 17.3.2. Technology
- 17.3.3. Content Type
- 17.3.4. Deployment Mode
- 17.3.5. Organization Size
- 17.3.6. Functionality
- 17.3.7. Revenue Model
- 17.3.8. Application
- 17.3.9. End-User Industry
- 17.3.10. Country
- 17.3.10.1. Germany
- 17.3.10.2. United Kingdom
- 17.3.10.3. France
- 17.3.10.4. Italy
- 17.3.10.5. Spain
- 17.3.10.6. Netherlands
- 17.3.10.7. Nordic Countries
- 17.3.10.8. Poland
- 17.3.10.9. Russia & CIS
- 17.3.10.10. Rest of Europe
- 17.4. Germany Virtual Reality Market
- 17.4.1. Country Segmental Analysis
- 17.4.2. Component
- 17.4.3. Technology
- 17.4.4. Content Type
- 17.4.5. Deployment Mode
- 17.4.6. Organization Size
- 17.4.7. Functionality
- 17.4.8. Revenue Model
- 17.4.9. Application
- 17.4.10. End-User Industry
- 17.5. United Kingdom Virtual Reality Market
- 17.5.1. Country Segmental Analysis
- 17.5.2. Component
- 17.5.3. Technology
- 17.5.4. Content Type
- 17.5.5. Deployment Mode
- 17.5.6. Organization Size
- 17.5.7. Functionality
- 17.5.8. Revenue Model
- 17.5.9. Application
- 17.5.10. End-User Industry
- 17.6. France Virtual Reality Market
- 17.6.1. Country Segmental Analysis
- 17.6.2. Component
- 17.6.3. Technology
- 17.6.4. Content Type
- 17.6.5. Deployment Mode
- 17.6.6. Organization Size
- 17.6.7. Functionality
- 17.6.8. Revenue Model
- 17.6.9. Application
- 17.6.10. End-User Industry
- 17.7. Italy Virtual Reality Market
- 17.7.1. Country Segmental Analysis
- 17.7.2. Component
- 17.7.3. Technology
- 17.7.4. Content Type
- 17.7.5. Deployment Mode
- 17.7.6. Organization Size
- 17.7.7. Functionality
- 17.7.8. Revenue Model
- 17.7.9. Application
- 17.7.10. End-User Industry
- 17.8. Spain Virtual Reality Market
- 17.8.1. Country Segmental Analysis
- 17.8.2. Component
- 17.8.3. Technology
- 17.8.4. Content Type
- 17.8.5. Deployment Mode
- 17.8.6. Organization Size
- 17.8.7. Functionality
- 17.8.8. Revenue Model
- 17.8.9. Application
- 17.8.10. End-User Industry
- 17.9. Netherlands Virtual Reality Market
- 17.9.1. Country Segmental Analysis
- 17.9.2. Component
- 17.9.3. Technology
- 17.9.4. Content Type
- 17.9.5. Deployment Mode
- 17.9.6. Organization Size
- 17.9.7. Functionality
- 17.9.8. Revenue Model
- 17.9.9. Application
- 17.9.10. End-User Industry
- 17.10. Nordic Countries Virtual Reality Market
- 17.10.1. Country Segmental Analysis
- 17.10.2. Component
- 17.10.3. Technology
- 17.10.4. Content Type
- 17.10.5. Deployment Mode
- 17.10.6. Organization Size
- 17.10.7. Functionality
- 17.10.8. Revenue Model
- 17.10.9. Application
- 17.10.10. End-User Industry
- 17.11. Poland Virtual Reality Market
- 17.11.1. Country Segmental Analysis
- 17.11.2. Component
- 17.11.3. Technology
- 17.11.4. Content Type
- 17.11.5. Deployment Mode
- 17.11.6. Organization Size
- 17.11.7. Functionality
- 17.11.8. Revenue Model
- 17.11.9. Application
- 17.11.10. End-User Industry
- 17.12. Russia & CIS Virtual Reality Market
- 17.12.1. Country Segmental Analysis
- 17.12.2. Component
- 17.12.3. Technology
- 17.12.4. Content Type
- 17.12.5. Deployment Mode
- 17.12.6. Organization Size
- 17.12.7. Functionality
- 17.12.8. Revenue Model
- 17.12.9. Application
- 17.12.10. End-User Industry
- 17.13. Rest of Europe Virtual Reality Market
- 17.13.1. Country Segmental Analysis
- 17.13.2. Component
- 17.13.3. Technology
- 17.13.4. Content Type
- 17.13.5. Deployment Mode
- 17.13.6. Organization Size
- 17.13.7. Functionality
- 17.13.8. Revenue Model
- 17.13.9. Application
- 17.13.10. End-User Industry
- 18. Asia Pacific Virtual Reality Market Analysis
- 18.1. Key Segment Analysis
- 18.2. Regional Snapshot
- 18.3. Asia Pacific Virtual Reality Market Size (Value - US$ Bn), Analysis, and Forecasts, 2021-2035
- 18.3.1. Component
- 18.3.2. Technology
- 18.3.3. Content Type
- 18.3.4. Deployment Mode
- 18.3.5. Organization Size
- 18.3.6. Functionality
- 18.3.7. Revenue Model
- 18.3.8. Application
- 18.3.9. End-User Industry
- 18.3.10. Country
- 18.3.10.1. China
- 18.3.10.2. India
- 18.3.10.3. Japan
- 18.3.10.4. South Korea
- 18.3.10.5. Australia and New Zealand
- 18.3.10.6. Indonesia
- 18.3.10.7. Malaysia
- 18.3.10.8. Thailand
- 18.3.10.9. Vietnam
- 18.3.10.10. Rest of Asia Pacific
- 18.4. China Virtual Reality Market
- 18.4.1. Country Segmental Analysis
- 18.4.2. Component
- 18.4.3. Technology
- 18.4.4. Content Type
- 18.4.5. Deployment Mode
- 18.4.6. Organization Size
- 18.4.7. Functionality
- 18.4.8. Revenue Model
- 18.4.9. Application
- 18.4.10. End-User Industry
- 18.5. India Virtual Reality Market
- 18.5.1. Country Segmental Analysis
- 18.5.2. Component
- 18.5.3. Technology
- 18.5.4. Content Type
- 18.5.5. Deployment Mode
- 18.5.6. Organization Size
- 18.5.7. Functionality
- 18.5.8. Revenue Model
- 18.5.9. Application
- 18.5.10. End-User Industry
- 18.6. Japan Virtual Reality Market
- 18.6.1. Country Segmental Analysis
- 18.6.2. Component
- 18.6.3. Technology
- 18.6.4. Content Type
- 18.6.5. Deployment Mode
- 18.6.6. Organization Size
- 18.6.7. Functionality
- 18.6.8. Revenue Model
- 18.6.9. Application
- 18.6.10. End-User Industry
- 18.7. South Korea Virtual Reality Market
- 18.7.1. Country Segmental Analysis
- 18.7.2. Component
- 18.7.3. Technology
- 18.7.4. Content Type
- 18.7.5. Deployment Mode
- 18.7.6. Organization Size
- 18.7.7. Functionality
- 18.7.8. Revenue Model
- 18.7.9. Application
- 18.7.10. End-User Industry
- 18.8. Australia and New Zealand Virtual Reality Market
- 18.8.1. Country Segmental Analysis
- 18.8.2. Component
- 18.8.3. Technology
- 18.8.4. Content Type
- 18.8.5. Deployment Mode
- 18.8.6. Organization Size
- 18.8.7. Functionality
- 18.8.8. Revenue Model
- 18.8.9. Application
- 18.8.10. End-User Industry
- 18.9. Indonesia Virtual Reality Market
- 18.9.1. Country Segmental Analysis
- 18.9.2. Component
- 18.9.3. Technology
- 18.9.4. Content Type
- 18.9.5. Deployment Mode
- 18.9.6. Organization Size
- 18.9.7. Functionality
- 18.9.8. Revenue Model
- 18.9.9. Application
- 18.9.10. End-User Industry
- 18.10. Malaysia Virtual Reality Market
- 18.10.1. Country Segmental Analysis
- 18.10.2. Component
- 18.10.3. Technology
- 18.10.4. Content Type
- 18.10.5. Deployment Mode
- 18.10.6. Organization Size
- 18.10.7. Functionality
- 18.10.8. Revenue Model
- 18.10.9. Application
- 18.10.10. End-User Industry
- 18.11. Thailand Virtual Reality Market
- 18.11.1. Country Segmental Analysis
- 18.11.2. Component
- 18.11.3. Technology
- 18.11.4. Content Type
- 18.11.5. Deployment Mode
- 18.11.6. Organization Size
- 18.11.7. Functionality
- 18.11.8. Revenue Model
- 18.11.9. Application
- 18.11.10. End-User Industry
- 18.12. Vietnam Virtual Reality Market
- 18.12.1. Country Segmental Analysis
- 18.12.2. Component
- 18.12.3. Technology
- 18.12.4. Content Type
- 18.12.5. Deployment Mode
- 18.12.6. Organization Size
- 18.12.7. Functionality
- 18.12.8. Revenue Model
- 18.12.9. Application
- 18.12.10. End-User Industry
- 18.13. Rest of Asia Pacific Virtual Reality Market
- 18.13.1. Country Segmental Analysis
- 18.13.2. Component
- 18.13.3. Technology
- 18.13.4. Content Type
- 18.13.5. Deployment Mode
- 18.13.6. Organization Size
- 18.13.7. Functionality
- 18.13.8. Revenue Model
- 18.13.9. Application
- 18.13.10. End-User Industry
- 19. Middle East Virtual Reality Market Analysis
- 19.1. Key Segment Analysis
- 19.2. Regional Snapshot
- 19.3. Middle East Virtual Reality Market Size (Value - US$ Bn), Analysis, and Forecasts, 2021-2035
- 19.3.1. Component
- 19.3.2. Technology
- 19.3.3. Content Type
- 19.3.4. Deployment Mode
- 19.3.5. Organization Size
- 19.3.6. Functionality
- 19.3.7. Revenue Model
- 19.3.8. Application
- 19.3.9. End-User Industry
- 19.3.10. Country
- 19.3.10.1. Turkey
- 19.3.10.2. UAE
- 19.3.10.3. Saudi Arabia
- 19.3.10.4. Israel
- 19.3.10.5. Rest of Middle East
- 19.4. Turkey Virtual Reality Market
- 19.4.1. Country Segmental Analysis
- 19.4.2. Component
- 19.4.3. Technology
- 19.4.4. Content Type
- 19.4.5. Deployment Mode
- 19.4.6. Organization Size
- 19.4.7. Functionality
- 19.4.8. Revenue Model
- 19.4.9. Application
- 19.4.10. End-User Industry
- 19.5. UAE Virtual Reality Market
- 19.5.1. Country Segmental Analysis
- 19.5.2. Component
- 19.5.3. Technology
- 19.5.4. Content Type
- 19.5.5. Deployment Mode
- 19.5.6. Organization Size
- 19.5.7. Functionality
- 19.5.8. Revenue Model
- 19.5.9. Application
- 19.5.10. End-User Industry
- 19.6. Saudi Arabia Virtual Reality Market
- 19.6.1. Country Segmental Analysis
- 19.6.2. Component
- 19.6.3. Technology
- 19.6.4. Content Type
- 19.6.5. Deployment Mode
- 19.6.6. Organization Size
- 19.6.7. Functionality
- 19.6.8. Revenue Model
- 19.6.9. Application
- 19.6.10. End-User Industry
- 19.7. Israel Virtual Reality Market
- 19.7.1. Country Segmental Analysis
- 19.7.2. Component
- 19.7.3. Technology
- 19.7.4. Content Type
- 19.7.5. Deployment Mode
- 19.7.6. Organization Size
- 19.7.7. Functionality
- 19.7.8. Revenue Model
- 19.7.9. Application
- 19.7.10. End-User Industry
- 19.8. Rest of Middle East Virtual Reality Market
- 19.8.1. Country Segmental Analysis
- 19.8.2. Component
- 19.8.3. Technology
- 19.8.4. Content Type
- 19.8.5. Deployment Mode
- 19.8.6. Organization Size
- 19.8.7. Functionality
- 19.8.8. Revenue Model
- 19.8.9. Application
- 19.8.10. End-User Industry
- 20. Africa Virtual Reality Market Analysis
- 20.1. Key Segment Analysis
- 20.2. Regional Snapshot
- 20.3. Africa Virtual Reality Market Size (Value - US$ Bn), Analysis, and Forecasts, 2021-2035
- 20.3.1. Component
- 20.3.2. Technology
- 20.3.3. Content Type
- 20.3.4. Deployment Mode
- 20.3.5. Organization Size
- 20.3.6. Functionality
- 20.3.7. Revenue Model
- 20.3.8. Application
- 20.3.9. End-User Industry
- 20.3.10. Country
- 20.3.10.1. South Africa
- 20.3.10.2. Egypt
- 20.3.10.3. Nigeria
- 20.3.10.4. Algeria
- 20.3.10.5. Rest of Africa
- 20.4. South Africa Virtual Reality Market
- 20.4.1. Country Segmental Analysis
- 20.4.2. Component
- 20.4.3. Technology
- 20.4.4. Content Type
- 20.4.5. Deployment Mode
- 20.4.6. Organization Size
- 20.4.7. Functionality
- 20.4.8. Revenue Model
- 20.4.9. Application
- 20.4.10. End-User Industry
- 20.5. Egypt Virtual Reality Market
- 20.5.1. Country Segmental Analysis
- 20.5.2. Component
- 20.5.3. Technology
- 20.5.4. Content Type
- 20.5.5. Deployment Mode
- 20.5.6. Organization Size
- 20.5.7. Functionality
- 20.5.8. Revenue Model
- 20.5.9. Application
- 20.5.10. End-User Industry
- 20.6. Nigeria Virtual Reality Market
- 20.6.1. Country Segmental Analysis
- 20.6.2. Component
- 20.6.3. Technology
- 20.6.4. Content Type
- 20.6.5. Deployment Mode
- 20.6.6. Organization Size
- 20.6.7. Functionality
- 20.6.8. Revenue Model
- 20.6.9. Application
- 20.6.10. End-User Industry
- 20.7. Algeria Virtual Reality Market
- 20.7.1. Country Segmental Analysis
- 20.7.2. Component
- 20.7.3. Technology
- 20.7.4. Content Type
- 20.7.5. Deployment Mode
- 20.7.6. Organization Size
- 20.7.7. Functionality
- 20.7.8. Revenue Model
- 20.7.9. Application
- 20.7.10. End-User Industry
- 20.8. Rest of Africa Virtual Reality Market
- 20.8.1. Country Segmental Analysis
- 20.8.2. Component
- 20.8.3. Technology
- 20.8.4. Content Type
- 20.8.5. Deployment Mode
- 20.8.6. Organization Size
- 20.8.7. Functionality
- 20.8.8. Revenue Model
- 20.8.9. Application
- 20.8.10. End-User Industry
- 21. South America Virtual Reality Market Analysis
- 21.1. Key Segment Analysis
- 21.2. Regional Snapshot
- 21.3. South America Virtual Reality Market Size (Value - US$ Bn), Analysis, and Forecasts, 2021-2035
- 21.3.1. Component
- 21.3.2. Technology
- 21.3.3. Content Type
- 21.3.4. Deployment Mode
- 21.3.5. Organization Size
- 21.3.6. Functionality
- 21.3.7. Revenue Model
- 21.3.8. Application
- 21.3.9. End-User Industry
- 21.3.10. Country
- 21.3.10.1. Brazil
- 21.3.10.2. Argentina
- 21.3.10.3. Rest of South America
- 21.4. Brazil Virtual Reality Market
- 21.4.1. Country Segmental Analysis
- 21.4.2. Component
- 21.4.3. Technology
- 21.4.4. Content Type
- 21.4.5. Deployment Mode
- 21.4.6. Organization Size
- 21.4.7. Functionality
- 21.4.8. Revenue Model
- 21.4.9. Application
- 21.4.10. End-User Industry
- 21.5. Argentina Virtual Reality Market
- 21.5.1. Country Segmental Analysis
- 21.5.2. Component
- 21.5.3. Technology
- 21.5.4. Content Type
- 21.5.5. Deployment Mode
- 21.5.6. Organization Size
- 21.5.7. Functionality
- 21.5.8. Revenue Model
- 21.5.9. Application
- 21.5.10. End-User Industry
- 21.6. Rest of South America Virtual Reality Market
- 21.6.1. Country Segmental Analysis
- 21.6.2. Component
- 21.6.3. Technology
- 21.6.4. Content Type
- 21.6.5. Deployment Mode
- 21.6.6. Organization Size
- 21.6.7. Functionality
- 21.6.8. Revenue Model
- 21.6.9. Application
- 21.6.10. End-User Industry
- 22. Key Players/ Company Profile
- 22.1. IBM
- 22.1.1. Company Details/ Overview
- 22.1.2. Company Financials
- 22.1.3. Key Customers and Competitors
- 22.1.4. Business/ Industry Portfolio
- 22.1.5. Product Portfolio/ Specification Details
- 22.1.6. Pricing Data
- 22.1.7. Strategic Overview
- 22.1.8. Recent Developments
- 22.2. Accenture
- 22.3. Adobe
- 22.4. Amazon Web Services (AWS)
- 22.5. Apple
- 22.6. Baidu
- 22.7. Cisco Systems
- 22.8. Cognizant
- 22.9. Facebook (Meta Platforms)
- 22.10. Google
- 22.11. Hewlett Packard Enterprise (HPE)
- 22.12. Infosys
- 22.13. Intel
- 22.14. Microsoft
- 22.15. NVIDIA
- 22.16. Oracle
- 22.17. Salesforce
- 22.18. SAP
- 22.19. Siemens
- 22.20. Tencent
- 22.21. Other Key Players
- 22.1. IBM
Note* - This is just tentative list of players. While providing the report, we will cover more number of players based on their revenue and share for each geography
Research Design
Our research design integrates both demand-side and supply-side analysis through a balanced combination of primary and secondary research methodologies. By utilizing both bottom-up and top-down approaches alongside rigorous data triangulation methods, we deliver robust market intelligence that supports strategic decision-making.
MarketGenics' comprehensive research design framework ensures the delivery of accurate, reliable, and actionable market intelligence. Through the integration of multiple research approaches, rigorous validation processes, and expert analysis, we provide our clients with the insights needed to make informed strategic decisions and capitalize on market opportunities.

MarketGenics leverages a dedicated industry panel of experts and a comprehensive suite of paid databases to effectively collect, consolidate, and analyze market intelligence.
Our approach has consistently proven to be reliable and effective in generating accurate market insights, identifying key industry trends, and uncovering emerging business opportunities.
Through both primary and secondary research, we capture and analyze critical company-level data such as manufacturing footprints, including technical centers, R&D facilities, sales offices, and headquarters.
Our expert panel further enhances our ability to estimate market size for specific brands based on validated field-level intelligence.
Our data mining techniques incorporate both parametric and non-parametric methods, allowing for structured data collection, sorting, processing, and cleaning.
Demand projections are derived from large-scale data sets analyzed through proprietary algorithms, culminating in robust and reliable market sizing.
Research Approach
The bottom-up approach builds market estimates by starting with the smallest addressable market units and systematically aggregating them to create comprehensive market size projections.
This method begins with specific, granular data points and builds upward to create the complete market landscape.
Customer Analysis → Segmental Analysis → Geographical Analysis
The top-down approach starts with the broadest possible market data and systematically narrows it down through a series of filters and assumptions to arrive at specific market segments or opportunities.
This method begins with the big picture and works downward to increasingly specific market slices.
TAM → SAM → SOM


Research Methods
Desk / Secondary Research
While analysing the market, we extensively study secondary sources, directories, and databases to identify and collect information useful for this technical, market-oriented, and commercial report. Secondary sources that we utilize are not only the public sources, but it is a combination of Open Source, Associations, Paid Databases, MG Repository & Knowledgebase, and others.
- Company websites, annual reports, financial reports, broker reports, and investor presentations
- National government documents, statistical databases and reports
- News articles, press releases and web-casts specific to the companies operating in the market, Magazines, reports, and others
- We gather information from commercial data sources for deriving company specific data such as segmental revenue, share for geography, product revenue, and others
- Internal and external proprietary databases (industry-specific), relevant patent, and regulatory databases
- Governing Bodies, Government Organizations
- Relevant Authorities, Country-specific Associations for Industries
We also employ the model mapping approach to estimate the product level market data through the players' product portfolio
Primary Research
Primary research/ interviews is vital in analyzing the market. Most of the cases involves paid primary interviews. Primary sources include primary interviews through e-mail interactions, telephonic interviews, surveys as well as face-to-face interviews with the different stakeholders across the value chain including several industry experts.
| Type of Respondents | Number of Primaries |
|---|---|
| Tier 2/3 Suppliers | ~20 |
| Tier 1 Suppliers | ~25 |
| End-users | ~25 |
| Industry Expert/ Panel/ Consultant | ~30 |
| Total | ~100 |
MG Knowledgebase
• Repository of industry blog, newsletter and case studies
• Online platform covering detailed market reports, and company profiles
Forecasting Factors and Models
Forecasting Factors
- Historical Trends – Past market patterns, cycles, and major events that shaped how markets behave over time. Understanding past trends helps predict future behavior.
- Industry Factors – Specific characteristics of the industry like structure, regulations, and innovation cycles that affect market dynamics.
- Macroeconomic Factors – Economic conditions like GDP growth, inflation, and employment rates that affect how much money people have to spend.
- Demographic Factors – Population characteristics like age, income, and location that determine who can buy your product.
- Technology Factors – How quickly people adopt new technology and how much technology infrastructure exists.
- Regulatory Factors – Government rules, laws, and policies that can help or restrict market growth.
- Competitive Factors – Analyzing competition structure such as degree of competition and bargaining power of buyers and suppliers.
Forecasting Models / Techniques
Multiple Regression Analysis
- Identify and quantify factors that drive market changes
- Statistical modeling to establish relationships between market drivers and outcomes
Time Series Analysis – Seasonal Patterns
- Understand regular cyclical patterns in market demand
- Advanced statistical techniques to separate trend, seasonal, and irregular components
Time Series Analysis – Trend Analysis
- Identify underlying market growth patterns and momentum
- Statistical analysis of historical data to project future trends
Expert Opinion – Expert Interviews
- Gather deep industry insights and contextual understanding
- In-depth interviews with key industry stakeholders
Multi-Scenario Development
- Prepare for uncertainty by modeling different possible futures
- Creating optimistic, pessimistic, and most likely scenarios
Time Series Analysis – Moving Averages
- Sophisticated forecasting for complex time series data
- Auto-regressive integrated moving average models with seasonal components
Econometric Models
- Apply economic theory to market forecasting
- Sophisticated economic models that account for market interactions
Expert Opinion – Delphi Method
- Harness collective wisdom of industry experts
- Structured, multi-round expert consultation process
Monte Carlo Simulation
- Quantify uncertainty and probability distributions
- Thousands of simulations with varying input parameters
Research Analysis
Our research framework is built upon the fundamental principle of validating market intelligence from both demand and supply perspectives. This dual-sided approach ensures comprehensive market understanding and reduces the risk of single-source bias.
Demand-Side Analysis: We understand end-user/application behavior, preferences, and market needs along with the penetration of the product for specific application.
Supply-Side Analysis: We estimate overall market revenue, analyze the segmental share along with industry capacity, competitive landscape, and market structure.
Validation & Evaluation
Data triangulation is a validation technique that uses multiple methods, sources, or perspectives to examine the same research question, thereby increasing the credibility and reliability of research findings. In market research, triangulation serves as a quality assurance mechanism that helps identify and minimize bias, validate assumptions, and ensure accuracy in market estimates.
- Data Source Triangulation – Using multiple data sources to examine the same phenomenon
- Methodological Triangulation – Using multiple research methods to study the same research question
- Investigator Triangulation – Using multiple researchers or analysts to examine the same data
- Theoretical Triangulation – Using multiple theoretical perspectives to interpret the same data

Custom Market Research Services
We will customise the research for you, in case the report listed above does not meet your requirements.
Get 10% Free Customisation