Web3 Market Size, Share & Trends Analysis Report by Technology (Blockchain, Decentralized Storage, Smart Contracts, Decentralized Applications (dApps), Non-Fungible Tokens (NFTs), Decentralized Autonomous Organizations (DAOs), Interoperability Solutions, Layer 2 Solutions, Others), Component, Application, Deployment Mode, Organization Size, Network Type, Infrastructure Layer, Token Standard, End-Use Industry, and Geography (North America, Europe, Asia Pacific, Middle East, Africa, and South America) – Global Industry Data, Trends, and Forecasts, 2026–2035
|
|
|
Segmental Data Insights |
|
|
Demand Trends |
|
|
Competitive Landscape |
|
|
Strategic Development |
|
|
Future Outlook & Opportunities |
|
Web3 market Size, Share, and Growth
The global Web3 market is witnessing strong growth, valued at USD 1.5 billion in 2025 and projected to reach USD 65.1 billion by 2035, expanding at a CAGR of 45.8% during the forecast period. The decentralized blockchain protocols, multi-chain platforms, and adaptive smart contracts drive the global Web3 market where enterprises and users can efficiently operate digital assets and conduct secure transactions and interact in real time across interoperable ecosystems.

Seth Young, Chief Executive Officer at High Roller, said: This collaboration allows us to evaluate new engagement frameworks that align with how digital consumers interact today. We’re focused on responsibly testing incentive-driven models that could enhance user engagement and open the door to incremental revenue opportunities within regulated markets.
The global Web3 market is developing fast as it is under the influence of increasing demand of decentralized digital infrastructure, secure peer-to-peer transaction, and transparent asset management in financial, game, and enterprise ecosystems. The blockchain protocols of the next generation, the smart contracts, and decentralized identity solutions are facilitating trustless interaction in real-time and minimizing the use of intermediaries.
State-of-the-art layer-2 scaling solutions, cross-network interoperability, and frameworks of modular dApp enable cross-chain connectivity, expedited settlement of transactions, and scalable deployment of an enterprise, developer, and final user alike. Emerging technologies including tokenized assets, decentralized marketplaces and programmable finance platforms are becoming adopted in a variety of industries.
The adjacent opportunities in the market are with the help of Web3-enabled gaming economies, NFT-based digital assets, decentralized social platforms, and tokenized enterprise solutions. Web3 technologies are changing the latest digital experiences since it brings about user sovereignty, monetization of virtual assets, and accessibility to a global population, which makes it a requisite in technological innovation in all industries.
 Web3 market Dynamics and Trends
Driver: Rising Adoption of Decentralized Finance (DeFi) and Blockchain Applications
-
The market is on the rise because of the growing need of transparent, secure and automated financial solutions as businesses and consumers implement decentralized finance technology to simplify payments, lending and asset management without intermediaries.
- The future of blockchain protocols, such as layer 2 scaling systems and cross-network smart contracts, can support real time settlement of transaction, self-sovereign governance and programmable financial instruments. For instance, in December 2025, Bybit, Mantle, and Aave collaborated to provide institutional-grade DeFi liquidity on-chain to allow cross-chain borrowing, lending, and liquidity access to global users.
- Combining DeFi with conventional finance increases efficiency, transparency, and blockchain solution global adoption.
Restraint: Regulatory Uncertainty and Security Concerns
-
The absence of standardized rules on the global level, diversity of the legal framework in different regions and changing compliance demands are restricting the widespread use of Web3 technologies by both the enterprise and the consumer.
- High operational risks associated with the vulnerability of smart contracts, phishing, and fraudulent programs add security risks, which may be a barrier to developers and investors alike.
- The challenge of implementation Enterprise-grade application of Web3 solutions due to technical complexity, lack of user awareness, and expert skills in cybersecurity presents a barrier to adoption despite the increasing technical potential.
Opportunity: Expansion into Enterprise and Gaming Applications
-
The integration of blockchain, NFTs, and decentralized identity solutions is opening new opportunities in the Web3 market by enabling enterprises to manage digital assets, loyalty programs, and secure transactions across multiple platforms.
- High-level analytics and smart contract interoperability enable real-time tracking of assets, automated governance, and adjustable in-game economies. For instance, in Feb 2025, SuperGaming joined B3 GameChain to develop its Web3 gaming ecosystem, allowing games such as Indus to support blockchain and enable cross-game experiences and in-game economies.
- Multi-platform and cross-game ecosystems enable scalable delivery of virtual goods, improved user interaction, and monetization options of both games and business applications.
Key Trend: Interoperability and Multi-Chain Ecosystems
-
The increase in the number of interconnected blockchain networks is broadening the global Web3 market, as it allows transfers of assets, cross-chain DeFi, and the handling of digital identities across ecosystems.
- The use of AI-based analytics to optimize liquidity, monitor multi-chain activity, and minimize transaction costs is being used increasingly by cross-chain platforms and decentralized protocols. For instance, in Nov 2025, Sig.Network applies native interoperability between Polkadot, Ethereum, Solana and Bitcoin, which allowed developers to access and interact with assets across major blockchains, greatly increasing multi-ecosystems functionality.
- Multi-chain structures allow the deployment of dApps in a scalable manner, and decrease the dependence on a single network, and enhance the flexibility and security.
Web3 Market Analysis and Segmental Data
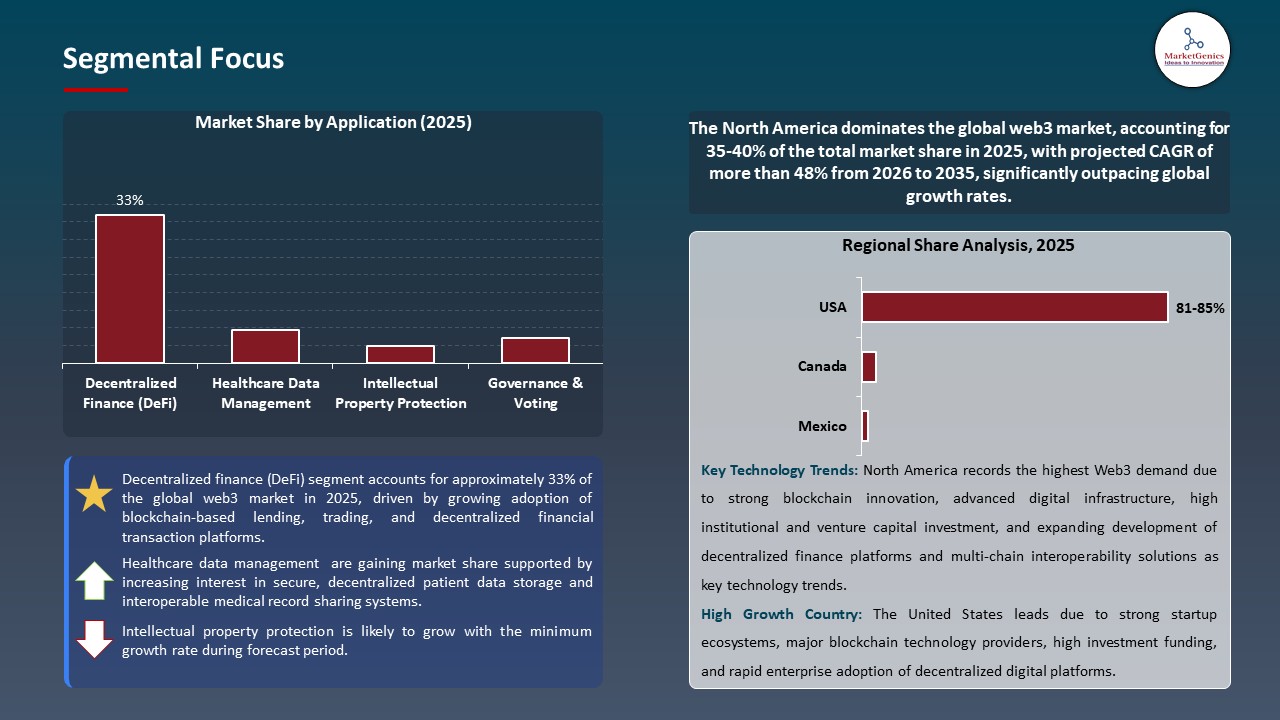
Decentralized Finance (DeFi) Dominate Global Web3 Market
-
Decentralized Finance (DeFi) platforms that are vital in enabling permissionless lending, borrowing, trading, and liquidity provision without traditional financial intermediaries, providing transparency and security and programmable financial products globally dominate the Web3 market.
- Multi-chain DeFi with AI enhancements are quickly implemented in practice, and they enable real-time yield optimization, automatic risk management, and cross-protocol interactions. For instance, in April 2025, Bitget Wallet collaborated with Venus Protocol to add DeFi yield options directly into the wallet allowing users to stake BNB, USDT, and USDC on BNB Chain with up to -10.3343--133700-percent APY in a decentralized lending market.
- Scalability, interoperability, and wallet integration are among the factors that have sustained the presence of DeFi in the global Web3 market.
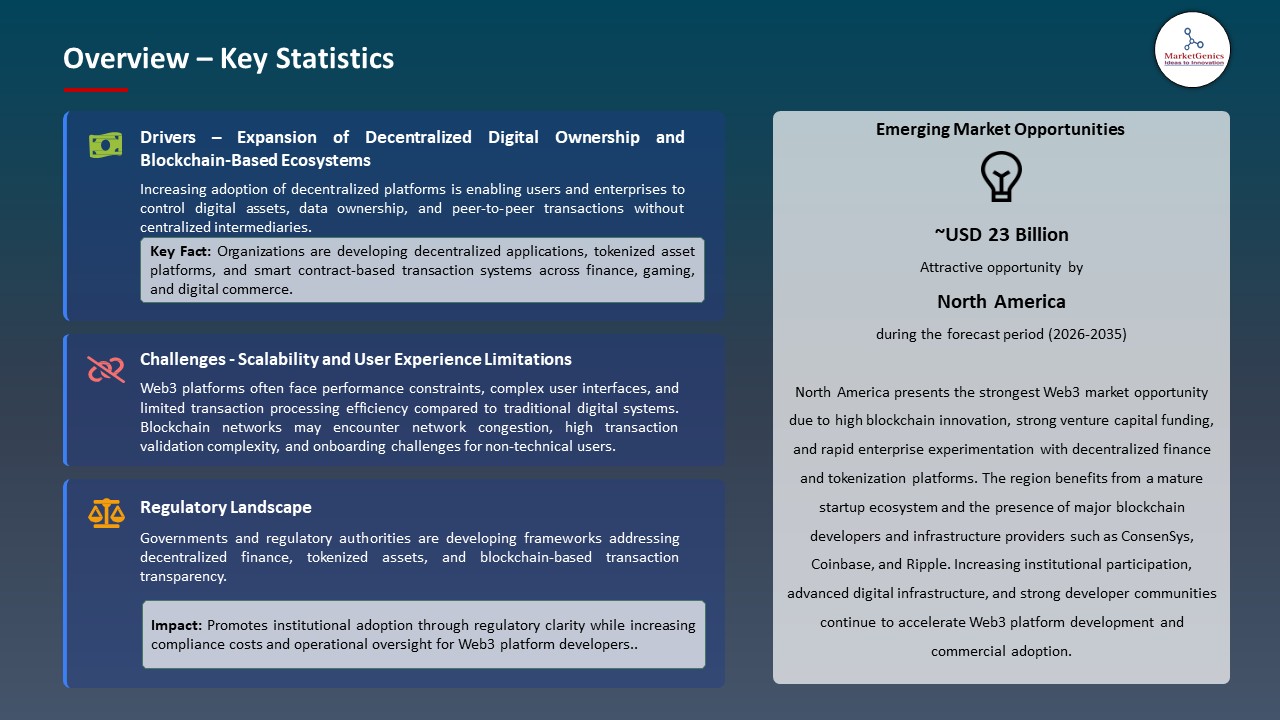
North America Leads Global Web3 Market Demand
-
North America is leads the market because it is the first to embrace blockchain infrastructure, because the rate of crypto wallets and exchanges penetration is high, and because of the significant demand of decentralized finance, NFTs, and enterprise Web3 applications in the U.S. and Canada.
- Web3 solutions based on AI and multi-chain are rapidly growing and allow the creation of secure smart contracts, tokenized assets, and decentralized applications. For instance, in July 2025 , FAIR Data Web3 Accelerator by Brinc to help early-stage projects in the decentralized infrastructure, according to the guidelines of open data and interoperability, and enhance local developer activity and use of enterprises.
- Well-developed venture capital, favorable policies, and an efficient developer community have further solidified the Web3 leadership of North America.
Web3 Market Ecosystem
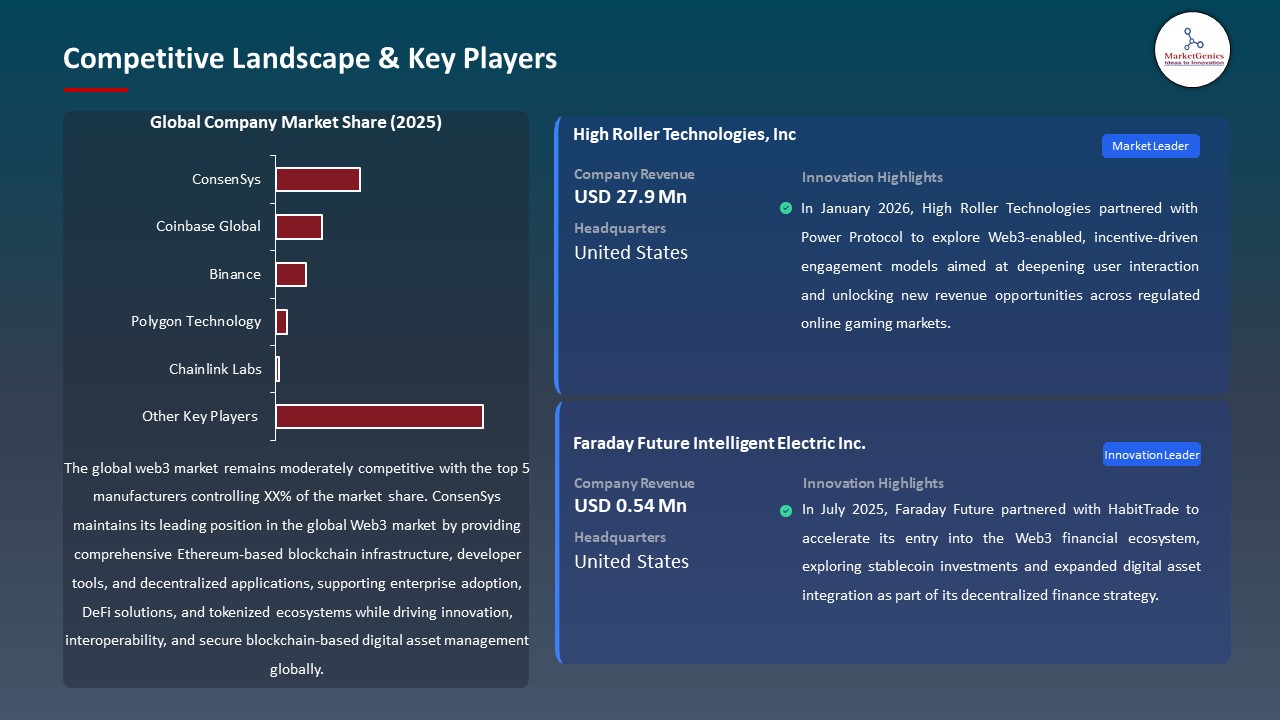
The decentralized finance platforms, blockchain infrastructures, smart contracts protocols, tokenized asset management and decentralized identity systems are moderately consolidated with the level of competition being directed towards them. The market share size can be attributed to the existence of ConsenSys, Coinbase Global, Binance, Polygon Technology, and Chainlink Labs because they provide built-in Web3 ecosystems, which comprise blockchain nodes, smart contract platforms, oracle networks, token standards, developer tools, and governance frameworks.
ConsenSys is creating Ethereum-based infrastructure, enterprise blockchain applications, and developer tools that make it possible to build decentralized applications, NFT ecosystems, and tokenized finance. Coinbase Global continues to expand its exchange, custody and wallet to improve the safe management and trading of digital assets. Binance is based on scalable crypto trading, DeFi solutions, and cross-chain integration. Polygon Technology is the provider of scaling solutions by using Layer 2 and the networks which are interoperable with the blockchain in order to enhance the speed of transactions and minimize the cost. Chainlink Labs is facilitating decentralized oracle networks of real time data feed to bridge blockchain protocols to the external systems to facilitate smart contracts.
Increasing institutional adoption, venture capital funding of blockchain innovation, regulatory encouragement of blockchain innovation, and developer partnerships and enterprise usage are driving the creation of new interoperability, security, and real-time data integration at a rapid pace. These ecosystem interactions help to increase competitive differentiation and offer the deployment of large-scale application and Web3 infrastructure, which works to enhance transparency, security, and decentralized governance across industries.
 Recent Development and Strategic Overview
-
In January 2026, High Roller Technologies collaborated with Power Protocol to consider the models of Web3-related incentive-based engagement to enhance the depth of user interaction and the opportunities to generate new revenues in the regulated online gaming markets.
- In July 2025, Faraday Future collaborated with HabitTrade to expedite its initiation into the Web3 financial ecosystem, and explore stablecoin investments and more comprehensive integration of digital assets into its decentralized finance plan.
Report Scope
|
Detail |
|
|
Market Size in 2025 |
USD 1.5 Bn |
|
Market Forecast Value in 2035 |
USD 65.1 Bn |
|
Growth Rate (CAGR) |
45.8% |
|
Forecast Period |
2026 – 2035 |
|
Historical Data Available for |
2021 – 2024 |
|
Market Size Units |
US$ Billion for Value |
|
Report Format |
Electronic (PDF) + Excel |
|
North America |
Europe |
Asia Pacific |
Middle East |
Africa |
South America |
|
|
|
|
|
|
|
Companies Covered |
|||||
|
|
|
|
|
|
Web3 Market Segmentation and Highlights
|
Segment |
Sub-segment |
|
Web3 Market, By Technology |
|
|
Web3 Market, By Component |
|
|
Web3 Market, By Application |
|
|
Web3 Market, By Deployment Mode |
|
|
Web3 Market, By Organization Size |
|
|
Web3 Market, By Network Type |
|
|
Web3 Market, By Infrastructure Layer |
|
|
Web3 Market, By Token Standard |
|
|
Web3 Market, By End-Use Industry |
|
Frequently Asked Questions
Table of Contents
- 1. Research Methodology and Assumptions
- 1.1. Definitions
- 1.2. Research Design and Approach
- 1.3. Data Collection Methods
- 1.4. Base Estimates and Calculations
- 1.5. Forecasting Models
- 1.5.1. Key Forecast Factors & Impact Analysis
- 1.6. Secondary Research
- 1.6.1. Open Sources
- 1.6.2. Paid Databases
- 1.6.3. Associations
- 1.7. Primary Research
- 1.7.1. Primary Sources
- 1.7.2. Primary Interviews with Stakeholders across Ecosystem
- 2. Executive Summary
- 2.1. Global Web3 Market Outlook
- 2.1.1. Web3 Market Size (Value - US$ Bn), and Forecasts, 2021-2035
- 2.1.2. Compounded Annual Growth Rate Analysis
- 2.1.3. Growth Opportunity Analysis
- 2.1.4. Segmental Share Analysis
- 2.1.5. Geographical Share Analysis
- 2.2. Market Analysis and Facts
- 2.3. Supply-Demand Analysis
- 2.4. Competitive Benchmarking
- 2.5. Go-to- Market Strategy
- 2.5.1. Customer/ End-use Industry Assessment
- 2.5.2. Growth Opportunity Data, 2026-2035
- 2.5.2.1. Regional Data
- 2.5.2.2. Country Data
- 2.5.2.3. Segmental Data
- 2.5.3. Identification of Potential Market Spaces
- 2.5.4. GAP Analysis
- 2.5.5. Potential Attractive Price Points
- 2.5.6. Prevailing Market Risks & Challenges
- 2.5.7. Preferred Sales & Marketing Strategies
- 2.5.8. Key Recommendations and Analysis
- 2.5.9. A Way Forward
- 2.1. Global Web3 Market Outlook
- 3. Industry Data and Premium Insights
- 3.1. Global Industry Overview, 2025
- 3.1.1. Information Technology & Media Industry Ecosystem Analysis
- 3.1.2. Key Trends for Information Technology & Media Industry
- 3.1.3. Regional Distribution for Information Technology & Media Industry
- 3.2. Supplier Customer Data
- 3.3. Technology Roadmap and Developments
- 3.4. Trade Analysis
- 3.4.1. Import & Export Analysis, 2025
- 3.4.2. Top Importing Countries
- 3.4.3. Top Exporting Countries
- 3.5. Trump Tariff Impact Analysis
- 3.5.1. Manufacturer
- 3.5.1.1. Based on the component & Raw material
- 3.5.2. Supply Chain
- 3.5.3. End Consumer
- 3.5.1. Manufacturer
- 3.6. Raw Material Analysis
- 3.1. Global Industry Overview, 2025
- 4. Market Overview
- 4.1. Market Dynamics
- 4.1.1. Drivers
- 4.1.1.1. Rising adoption of decentralized applications supporting peer-to-peer transactions and trustless digital interactions
- 4.1.1.2. Growing enterprise and developer interest in blockchain-based platforms enabling transparency, programmability, and data ownership
- 4.1.1.3. Expanding use of tokenization and smart contracts to support new digital business models.
- 4.1.2. Restraints
- 4.1.2.1. Regulatory uncertainty and compliance challenges across multiple jurisdictions
- 4.1.2.2. Scalability, interoperability, and user experience limitations within decentralized ecosystems.
- 4.1.2.3. Key Trend Analysis
- 4.1.1. Drivers
- 4.2. Regulatory Framework
- 4.2.1. Key Regulations, Norms, and Subsidies, by Key Countries
- 4.2.2. Tariffs and Standards
- 4.2.3. Impact Analysis of Regulations on the Market
- 4.3. Ecosystem Analysis
- 4.4. Porter’s Five Forces Analysis
- 4.5. PESTEL Analysis
- 4.6. Global Web3 Market Demand
- 4.6.1. Historical Market Size – Value (US$ Bn), 2020-2024
- 4.6.2. Current and Future Market Size – Value (US$ Bn), 2026–2035
- 4.6.2.1. Y-o-Y Growth Trends
- 4.6.2.2. Absolute $ Opportunity Assessment
- 4.1. Market Dynamics
- 5. Competition Landscape
- 5.1. Competition structure
- 5.1.1. Fragmented v/s consolidated
- 5.2. Company Share Analysis, 2025
- 5.2.1. Global Company Market Share
- 5.2.2. By Region
- 5.2.2.1. North America
- 5.2.2.2. Europe
- 5.2.2.3. Asia Pacific
- 5.2.2.4. Middle East
- 5.2.2.5. Africa
- 5.2.2.6. South America
- 5.3. Product Comparison Matrix
- 5.3.1. Specifications
- 5.3.2. Market Positioning
- 5.3.3. Pricing
- 5.1. Competition structure
- 6. Global Web3 Market Analysis, by Technology
- 6.1. Key Segment Analysis
- 6.2. Web3 Market Size (Value - US$ Bn), Analysis, and Forecasts, by Technology, 2021-2035
- 6.2.1. Blockchain
- 6.2.1.1. Public Blockchain
- 6.2.1.2. Private Blockchain
- 6.2.1.3. Consortium Blockchain
- 6.2.1.4. Hybrid Blockchain
- 6.2.2. Decentralized Storage
- 6.2.3. Smart Contracts
- 6.2.4. Decentralized Applications (dApps)
- 6.2.5. Non-Fungible Tokens (NFTs)
- 6.2.6. Decentralized Autonomous Organizations (DAOs)
- 6.2.7. Interoperability Solutions
- 6.2.8. Layer 2 Solutions
- 6.2.9. Others
- 6.2.1. Blockchain
- 7. Global Web3 Market Analysis, by Component
- 7.1. Key Segment Analysis
- 7.2. Web3 Market Size (Value - US$ Bn), Analysis, and Forecasts, by Component, 2021-2035
- 7.2.1. Platform
- 7.2.2. Services
- 7.2.2.1. Professional Services
- 7.2.2.1.1. Integration & Deployment
- 7.2.2.1.2. Consulting
- 7.2.2.1.3. Support & Maintenance
- 7.2.2.2. Managed Services
- 7.2.2.1. Professional Services
- 8. Global Web3 Market Analysis, by Application
- 8.1. Key Segment Analysis
- 8.2. Web3 Market Size (Value - US$ Bn), Analysis, and Forecasts, by Application, 2021-2035
- 8.2.1. Digital Identity & Authentication
- 8.2.2. Payments & Transactions
- 8.2.3. Data Storage & Management
- 8.2.4. Supply Chain Management
- 8.2.5. Asset Tokenization
- 8.2.6. Gaming & Metaverse
- 8.2.7. Social Media & Content Creation
- 8.2.8. Decentralized Finance (DeFi)
- 8.2.9. Healthcare Data Management
- 8.2.10. Governance & Voting
- 8.2.11. Intellectual Property Protection
- 8.2.12. Other Applications
- 9. Global Web3 Market Analysis, by Deployment Mode
- 9.1. Key Segment Analysis
- 9.2. Web3 Market Size (Value - US$ Bn), Analysis, and Forecasts, by Deployment Mode, 2021-2035
- 9.2.1. Cloud-based
- 9.2.2. On-premises
- 9.2.3. Hybrid
- 10. Global Web3 Market Analysis, by Organization Size
- 10.1. Key Segment Analysis
- 10.2. Web3 Market Size (Value - US$ Bn), Analysis, and Forecasts, by Organization Size, 2021-2035
- 10.2.1. Large Enterprises
- 10.2.2. Small and Medium Enterprises (SMEs)
- 11. Global Web3 Market Analysis, by Network Type
- 11.1. Key Segment Analysis
- 11.2. Web3 Market Size (Value - US$ Bn), Analysis, and Forecasts, by Network Type, 2021-2035
- 11.2.1. Ethereum
- 11.2.2. Binance Smart Chain
- 11.2.3. Solana
- 11.2.4. Polkadot
- 11.2.5. Cardano
- 11.2.6. Avalanche
- 11.2.7. Polygon
- 11.2.8. Others
- 12. Global Web3 Market Analysis, by Infrastructure Layer
- 12.1. Key Segment Analysis
- 12.2. Web3 Market Size (Value - US$ Bn), Analysis, and Forecasts, by Infrastructure Layer, 2021-2035
- 12.2.1. Protocol Layer
- 12.2.2. Network Layer
- 12.2.3. Application Layer
- 12.2.4. User Interface Layer
- 13. Global Web3 Market Analysis, by Token Standard
- 13.1. Key Segment Analysis
- 13.2. Web3 Market Size (Value - US$ Bn), Analysis, and Forecasts, by Token Standard, 2021-2035
- 13.2.1. ERC-20
- 13.2.2. ERC-721
- 13.2.3. ERC-1155
- 13.2.4. BEP-20
- 13.2.5. Others
- 14. Global Web3 Market Analysis, by End-Use Industry
- 14.1. Key Segment Analysis
- 14.2. Web3 Market Size (Value - US$ Bn), Analysis, and Forecasts, by End-Use Industry, 2021-2035
- 14.2.1. Banking, Financial Services & Insurance (BFSI)
- 14.2.2. Retail & E-commerce
- 14.2.3. Media & Entertainment
- 14.2.4. Gaming
- 14.2.5. Healthcare & Pharmaceuticals
- 14.2.6. Supply Chain & Logistics
- 14.2.7. Real Estate
- 14.2.8. Telecommunications
- 14.2.9. Energy & Utilities
- 14.2.10. Government & Public Sector
- 14.2.11. Education
- 14.2.12. Manufacturing
- 14.2.13. Automotive
- 14.2.14. Travel & Hospitality
- 14.2.15. Legal & Professional Services
- 14.2.16. Others
- 15. Global Web3 Market Analysis and Forecasts, by Region
- 15.1. Key Findings
- 15.2. Web3 Market Size (Value - US$ Bn), Analysis, and Forecasts, by Region, 2021-2035
- 15.2.1. North America
- 15.2.2. Europe
- 15.2.3. Asia Pacific
- 15.2.4. Middle East
- 15.2.5. Africa
- 15.2.6. South America
- 16. North America Web3 Market Analysis
- 16.1. Key Segment Analysis
- 16.2. Regional Snapshot
- 16.3. North America Web3 Market Size (Value - US$ Bn), Analysis, and Forecasts, 2021-2035
- 16.3.1. Technology
- 16.3.2. Component
- 16.3.3. Application
- 16.3.4. Deployment Mode
- 16.3.5. Organization Size
- 16.3.6. Network Type
- 16.3.7. Infrastructure Layer
- 16.3.8. Token Standard
- 16.3.9. End-Use Industry
- 16.3.10. Country
- 16.3.10.1. USA
- 16.3.10.2. Canada
- 16.3.10.3. Mexico
- 16.4. USA Web3 Market
- 16.4.1. Country Segmental Analysis
- 16.4.2. Technology
- 16.4.3. Component
- 16.4.4. Application
- 16.4.5. Deployment Mode
- 16.4.6. Organization Size
- 16.4.7. Network Type
- 16.4.8. Infrastructure Layer
- 16.4.9. Token Standard
- 16.4.10. End-Use Industry
- 16.5. Canada Web3 Market
- 16.5.1. Country Segmental Analysis
- 16.5.2. Technology
- 16.5.3. Component
- 16.5.4. Application
- 16.5.5. Deployment Mode
- 16.5.6. Organization Size
- 16.5.7. Network Type
- 16.5.8. Infrastructure Layer
- 16.5.9. Token Standard
- 16.5.10. End-Use Industry
- 16.6. Mexico Web3 Market
- 16.6.1. Country Segmental Analysis
- 16.6.2. Technology
- 16.6.3. Component
- 16.6.4. Application
- 16.6.5. Deployment Mode
- 16.6.6. Organization Size
- 16.6.7. Network Type
- 16.6.8. Infrastructure Layer
- 16.6.9. Token Standard
- 16.6.10. End-Use Industry
- 17. Europe Web3 Market Analysis
- 17.1. Key Segment Analysis
- 17.2. Regional Snapshot
- 17.3. Europe Web3 Market Size (Value - US$ Bn), Analysis, and Forecasts, 2021-2035
- 17.3.1. Technology
- 17.3.2. Component
- 17.3.3. Application
- 17.3.4. Deployment Mode
- 17.3.5. Organization Size
- 17.3.6. Network Type
- 17.3.7. Infrastructure Layer
- 17.3.8. Token Standard
- 17.3.9. End-Use Industry
- 17.3.10. Country
- 17.3.10.1. Germany
- 17.3.10.2. United Kingdom
- 17.3.10.3. France
- 17.3.10.4. Italy
- 17.3.10.5. Spain
- 17.3.10.6. Netherlands
- 17.3.10.7. Nordic Countries
- 17.3.10.8. Poland
- 17.3.10.9. Russia & CIS
- 17.3.10.10. Rest of Europe
- 17.4. Germany Web3 Market
- 17.4.1. Country Segmental Analysis
- 17.4.2. Technology
- 17.4.3. Component
- 17.4.4. Application
- 17.4.5. Deployment Mode
- 17.4.6. Organization Size
- 17.4.7. Network Type
- 17.4.8. Infrastructure Layer
- 17.4.9. Token Standard
- 17.4.10. End-Use Industry
- 17.5. United Kingdom Web3 Market
- 17.5.1. Country Segmental Analysis
- 17.5.2. Technology
- 17.5.3. Component
- 17.5.4. Application
- 17.5.5. Deployment Mode
- 17.5.6. Organization Size
- 17.5.7. Network Type
- 17.5.8. Infrastructure Layer
- 17.5.9. Token Standard
- 17.5.10. End-Use Industry
- 17.6. France Web3 Market
- 17.6.1. Country Segmental Analysis
- 17.6.2. Technology
- 17.6.3. Component
- 17.6.4. Application
- 17.6.5. Deployment Mode
- 17.6.6. Organization Size
- 17.6.7. Network Type
- 17.6.8. Infrastructure Layer
- 17.6.9. Token Standard
- 17.6.10. End-Use Industry
- 17.7. Italy Web3 Market
- 17.7.1. Country Segmental Analysis
- 17.7.2. Technology
- 17.7.3. Component
- 17.7.4. Application
- 17.7.5. Deployment Mode
- 17.7.6. Organization Size
- 17.7.7. Network Type
- 17.7.8. Infrastructure Layer
- 17.7.9. Token Standard
- 17.7.10. End-Use Industry
- 17.8. Spain Web3 Market
- 17.8.1. Country Segmental Analysis
- 17.8.2. Technology
- 17.8.3. Component
- 17.8.4. Application
- 17.8.5. Deployment Mode
- 17.8.6. Organization Size
- 17.8.7. Network Type
- 17.8.8. Infrastructure Layer
- 17.8.9. Token Standard
- 17.8.10. End-Use Industry
- 17.9. Netherlands Web3 Market
- 17.9.1. Country Segmental Analysis
- 17.9.2. Technology
- 17.9.3. Component
- 17.9.4. Application
- 17.9.5. Deployment Mode
- 17.9.6. Organization Size
- 17.9.7. Network Type
- 17.9.8. Infrastructure Layer
- 17.9.9. Token Standard
- 17.9.10. End-Use Industry
- 17.10. Nordic Countries Web3 Market
- 17.10.1. Country Segmental Analysis
- 17.10.2. Technology
- 17.10.3. Component
- 17.10.4. Application
- 17.10.5. Deployment Mode
- 17.10.6. Organization Size
- 17.10.7. Network Type
- 17.10.8. Infrastructure Layer
- 17.10.9. Token Standard
- 17.10.10. End-Use Industry
- 17.11. Poland Web3 Market
- 17.11.1. Country Segmental Analysis
- 17.11.2. Technology
- 17.11.3. Component
- 17.11.4. Application
- 17.11.5. Deployment Mode
- 17.11.6. Organization Size
- 17.11.7. Network Type
- 17.11.8. Infrastructure Layer
- 17.11.9. Token Standard
- 17.11.10. End-Use Industry
- 17.12. Russia & CIS Web3 Market
- 17.12.1. Country Segmental Analysis
- 17.12.2. Technology
- 17.12.3. Component
- 17.12.4. Application
- 17.12.5. Deployment Mode
- 17.12.6. Organization Size
- 17.12.7. Network Type
- 17.12.8. Infrastructure Layer
- 17.12.9. Token Standard
- 17.12.10. End-Use Industry
- 17.13. Rest of Europe Web3 Market
- 17.13.1. Country Segmental Analysis
- 17.13.2. Technology
- 17.13.3. Component
- 17.13.4. Application
- 17.13.5. Deployment Mode
- 17.13.6. Organization Size
- 17.13.7. Network Type
- 17.13.8. Infrastructure Layer
- 17.13.9. Token Standard
- 17.13.10. End-Use Industry
- 18. Asia Pacific Web3 Market Analysis
- 18.1. Key Segment Analysis
- 18.2. Regional Snapshot
- 18.3. Asia Pacific Web3 Market Size (Value - US$ Bn), Analysis, and Forecasts, 2021-2035
- 18.3.1. Technology
- 18.3.2. Component
- 18.3.3. Application
- 18.3.4. Deployment Mode
- 18.3.5. Organization Size
- 18.3.6. Network Type
- 18.3.7. Infrastructure Layer
- 18.3.8. Token Standard
- 18.3.9. End-Use Industry
- 18.3.10. Country
- 18.3.10.1. China
- 18.3.10.2. India
- 18.3.10.3. Japan
- 18.3.10.4. South Korea
- 18.3.10.5. Australia and New Zealand
- 18.3.10.6. Indonesia
- 18.3.10.7. Malaysia
- 18.3.10.8. Thailand
- 18.3.10.9. Vietnam
- 18.3.10.10. Rest of Asia Pacific
- 18.4. China Web3 Market
- 18.4.1. Country Segmental Analysis
- 18.4.2. Technology
- 18.4.3. Component
- 18.4.4. Application
- 18.4.5. Deployment Mode
- 18.4.6. Organization Size
- 18.4.7. Network Type
- 18.4.8. Infrastructure Layer
- 18.4.9. Token Standard
- 18.4.10. End-Use Industry
- 18.5. India Web3 Market
- 18.5.1. Country Segmental Analysis
- 18.5.2. Technology
- 18.5.3. Component
- 18.5.4. Application
- 18.5.5. Deployment Mode
- 18.5.6. Organization Size
- 18.5.7. Network Type
- 18.5.8. Infrastructure Layer
- 18.5.9. Token Standard
- 18.5.10. End-Use Industry
- 18.6. Japan Web3 Market
- 18.6.1. Country Segmental Analysis
- 18.6.2. Technology
- 18.6.3. Component
- 18.6.4. Application
- 18.6.5. Deployment Mode
- 18.6.6. Organization Size
- 18.6.7. Network Type
- 18.6.8. Infrastructure Layer
- 18.6.9. Token Standard
- 18.6.10. End-Use Industry
- 18.7. South Korea Web3 Market
- 18.7.1. Country Segmental Analysis
- 18.7.2. Technology
- 18.7.3. Component
- 18.7.4. Application
- 18.7.5. Deployment Mode
- 18.7.6. Organization Size
- 18.7.7. Network Type
- 18.7.8. Infrastructure Layer
- 18.7.9. Token Standard
- 18.7.10. End-Use Industry
- 18.8. Australia and New Zealand Web3 Market
- 18.8.1. Country Segmental Analysis
- 18.8.2. Technology
- 18.8.3. Component
- 18.8.4. Application
- 18.8.5. Deployment Mode
- 18.8.6. Organization Size
- 18.8.7. Network Type
- 18.8.8. Infrastructure Layer
- 18.8.9. Token Standard
- 18.8.10. End-Use Industry
- 18.9. Indonesia Web3 Market
- 18.9.1. Country Segmental Analysis
- 18.9.2. Technology
- 18.9.3. Component
- 18.9.4. Application
- 18.9.5. Deployment Mode
- 18.9.6. Organization Size
- 18.9.7. Network Type
- 18.9.8. Infrastructure Layer
- 18.9.9. Token Standard
- 18.9.10. End-Use Industry
- 18.10. Malaysia Web3 Market
- 18.10.1. Country Segmental Analysis
- 18.10.2. Technology
- 18.10.3. Component
- 18.10.4. Application
- 18.10.5. Deployment Mode
- 18.10.6. Organization Size
- 18.10.7. Network Type
- 18.10.8. Infrastructure Layer
- 18.10.9. Token Standard
- 18.10.10. End-Use Industry
- 18.11. Thailand Web3 Market
- 18.11.1. Country Segmental Analysis
- 18.11.2. Technology
- 18.11.3. Component
- 18.11.4. Application
- 18.11.5. Deployment Mode
- 18.11.6. Organization Size
- 18.11.7. Network Type
- 18.11.8. Infrastructure Layer
- 18.11.9. Token Standard
- 18.11.10. End-Use Industry
- 18.12. Vietnam Web3 Market
- 18.12.1. Country Segmental Analysis
- 18.12.2. Technology
- 18.12.3. Component
- 18.12.4. Application
- 18.12.5. Deployment Mode
- 18.12.6. Organization Size
- 18.12.7. Network Type
- 18.12.8. Infrastructure Layer
- 18.12.9. Token Standard
- 18.12.10. End-Use Industry
- 18.13. Rest of Asia Pacific Web3 Market
- 18.13.1. Country Segmental Analysis
- 18.13.2. Technology
- 18.13.3. Component
- 18.13.4. Application
- 18.13.5. Deployment Mode
- 18.13.6. Organization Size
- 18.13.7. Network Type
- 18.13.8. Infrastructure Layer
- 18.13.9. Token Standard
- 18.13.10. End-Use Industry
- 19. Middle East Web3 Market Analysis
- 19.1. Key Segment Analysis
- 19.2. Regional Snapshot
- 19.3. Middle East Web3 Market Size (Value - US$ Bn), Analysis, and Forecasts, 2021-2035
- 19.3.1. Technology
- 19.3.2. Component
- 19.3.3. Application
- 19.3.4. Deployment Mode
- 19.3.5. Organization Size
- 19.3.6. Network Type
- 19.3.7. Infrastructure Layer
- 19.3.8. Token Standard
- 19.3.9. End-Use Industry
- 19.3.10. Country
- 19.3.10.1. Turkey
- 19.3.10.2. UAE
- 19.3.10.3. Saudi Arabia
- 19.3.10.4. Israel
- 19.3.10.5. Rest of Middle East
- 19.4. Turkey Web3 Market
- 19.4.1. Country Segmental Analysis
- 19.4.2. Technology
- 19.4.3. Component
- 19.4.4. Application
- 19.4.5. Deployment Mode
- 19.4.6. Organization Size
- 19.4.7. Network Type
- 19.4.8. Infrastructure Layer
- 19.4.9. Token Standard
- 19.4.10. End-Use Industry
- 19.5. UAE Web3 Market
- 19.5.1. Country Segmental Analysis
- 19.5.2. Technology
- 19.5.3. Component
- 19.5.4. Application
- 19.5.5. Deployment Mode
- 19.5.6. Organization Size
- 19.5.7. Network Type
- 19.5.8. Infrastructure Layer
- 19.5.9. Token Standard
- 19.5.10. End-Use Industry
- 19.6. Saudi Arabia Web3 Market
- 19.6.1. Country Segmental Analysis
- 19.6.2. Technology
- 19.6.3. Component
- 19.6.4. Application
- 19.6.5. Deployment Mode
- 19.6.6. Organization Size
- 19.6.7. Network Type
- 19.6.8. Infrastructure Layer
- 19.6.9. Token Standard
- 19.6.10. End-Use Industry
- 19.7. Israel Web3 Market
- 19.7.1. Country Segmental Analysis
- 19.7.2. Technology
- 19.7.3. Component
- 19.7.4. Application
- 19.7.5. Deployment Mode
- 19.7.6. Organization Size
- 19.7.7. Network Type
- 19.7.8. Infrastructure Layer
- 19.7.9. Token Standard
- 19.7.10. End-Use Industry
- 19.8. Rest of Middle East Web3 Market
- 19.8.1. Country Segmental Analysis
- 19.8.2. Technology
- 19.8.3. Component
- 19.8.4. Application
- 19.8.5. Deployment Mode
- 19.8.6. Organization Size
- 19.8.7. Network Type
- 19.8.8. Infrastructure Layer
- 19.8.9. Token Standard
- 19.8.10. End-Use Industry
- 20. Africa Web3 Market Analysis
- 20.1. Key Segment Analysis
- 20.2. Regional Snapshot
- 20.3. Africa Web3 Market Size (Value - US$ Bn), Analysis, and Forecasts, 2021-2035
- 20.3.1. Technology
- 20.3.2. Component
- 20.3.3. Application
- 20.3.4. Deployment Mode
- 20.3.5. Organization Size
- 20.3.6. Network Type
- 20.3.7. Infrastructure Layer
- 20.3.8. Token Standard
- 20.3.9. End-Use Industry
- 20.3.10. Country
- 20.3.10.1. South Africa
- 20.3.10.2. Egypt
- 20.3.10.3. Nigeria
- 20.3.10.4. Algeria
- 20.3.10.5. Rest of Africa
- 20.4. South Africa Web3 Market
- 20.4.1. Country Segmental Analysis
- 20.4.2. Technology
- 20.4.3. Component
- 20.4.4. Application
- 20.4.5. Deployment Mode
- 20.4.6. Organization Size
- 20.4.7. Network Type
- 20.4.8. Infrastructure Layer
- 20.4.9. Token Standard
- 20.4.10. End-Use Industry
- 20.5. Egypt Web3 Market
- 20.5.1. Country Segmental Analysis
- 20.5.2. Technology
- 20.5.3. Component
- 20.5.4. Application
- 20.5.5. Deployment Mode
- 20.5.6. Organization Size
- 20.5.7. Network Type
- 20.5.8. Infrastructure Layer
- 20.5.9. Token Standard
- 20.5.10. End-Use Industry
- 20.6. Nigeria Web3 Market
- 20.6.1. Country Segmental Analysis
- 20.6.2. Technology
- 20.6.3. Component
- 20.6.4. Application
- 20.6.5. Deployment Mode
- 20.6.6. Organization Size
- 20.6.7. Network Type
- 20.6.8. Infrastructure Layer
- 20.6.9. Token Standard
- 20.6.10. End-Use Industry
- 20.7. Algeria Web3 Market
- 20.7.1. Country Segmental Analysis
- 20.7.2. Technology
- 20.7.3. Component
- 20.7.4. Application
- 20.7.5. Deployment Mode
- 20.7.6. Organization Size
- 20.7.7. Network Type
- 20.7.8. Infrastructure Layer
- 20.7.9. Token Standard
- 20.7.10. End-Use Industry
- 20.8. Rest of Africa Web3 Market
- 20.8.1. Country Segmental Analysis
- 20.8.2. Technology
- 20.8.3. Component
- 20.8.4. Application
- 20.8.5. Deployment Mode
- 20.8.6. Organization Size
- 20.8.7. Network Type
- 20.8.8. Infrastructure Layer
- 20.8.9. Token Standard
- 20.8.10. End-Use Industry
- 21. South America Web3 Market Analysis
- 21.1. Key Segment Analysis
- 21.2. Regional Snapshot
- 21.3. South America Web3 Market Size (Value - US$ Bn), Analysis, and Forecasts, 2021-2035
- 21.3.1. Technology
- 21.3.2. Component
- 21.3.3. Application
- 21.3.4. Deployment Mode
- 21.3.5. Organization Size
- 21.3.6. Network Type
- 21.3.7. Infrastructure Layer
- 21.3.8. Token Standard
- 21.3.9. End-Use Industry
- 21.3.10. Country
- 21.3.10.1. Brazil
- 21.3.10.2. Argentina
- 21.3.10.3. Rest of South America
- 21.4. Brazil Web3 Market
- 21.4.1. Country Segmental Analysis
- 21.4.2. Technology
- 21.4.3. Component
- 21.4.4. Application
- 21.4.5. Deployment Mode
- 21.4.6. Organization Size
- 21.4.7. Network Type
- 21.4.8. Infrastructure Layer
- 21.4.9. Token Standard
- 21.4.10. End-Use Industry
- 21.5. Argentina Web3 Market
- 21.5.1. Country Segmental Analysis
- 21.5.2. Technology
- 21.5.3. Component
- 21.5.4. Application
- 21.5.5. Deployment Mode
- 21.5.6. Organization Size
- 21.5.7. Network Type
- 21.5.8. Infrastructure Layer
- 21.5.9. Token Standard
- 21.5.10. End-Use Industry
- 21.6. Rest of South America Web3 Market
- 21.6.1. Country Segmental Analysis
- 21.6.2. Technology
- 21.6.3. Component
- 21.6.4. Application
- 21.6.5. Deployment Mode
- 21.6.6. Organization Size
- 21.6.7. Network Type
- 21.6.8. Infrastructure Layer
- 21.6.9. Token Standard
- 21.6.10. End-Use Industry
- 22. Key Players/ Company Profile
- 22.1. Aave
- 22.1.1. Company Details/ Overview
- 22.1.2. Company Financials
- 22.1.3. Key Customers and Competitors
- 22.1.4. Business/ Industry Portfolio
- 22.1.5. Product Portfolio/ Specification Details
- 22.1.6. Pricing Data
- 22.1.7. Strategic Overview
- 22.1.8. Recent Developments
- 22.2. Alchemy
- 22.3. Animoca Brands
- 22.4. Axie Infinity (Sky Mavis)
- 22.5. Binance
- 22.6. Chainalysis
- 22.7. Chainlink Labs
- 22.8. Circle Internet Financial
- 22.9. Coinbase Global
- 22.10. ConsenSys
- 22.11. Dapper Labs
- 22.12. Decentraland
- 22.13. Infura
- 22.14. MakerDAO
- 22.15. OpenSea
- 22.16. Polygon Technology
- 22.17. QuickNode
- 22.18. Ripple Labs
- 22.19. The Sandbox
- 22.20. Uniswap Labs
- 22.21. Yuga Labs
- 22.22. Other Key Players
- 22.1. Aave
Note* - This is just tentative list of players. While providing the report, we will cover more number of players based on their revenue and share for each geography
Research Design
Our research design integrates both demand-side and supply-side analysis through a balanced combination of primary and secondary research methodologies. By utilizing both bottom-up and top-down approaches alongside rigorous data triangulation methods, we deliver robust market intelligence that supports strategic decision-making.
MarketGenics' comprehensive research design framework ensures the delivery of accurate, reliable, and actionable market intelligence. Through the integration of multiple research approaches, rigorous validation processes, and expert analysis, we provide our clients with the insights needed to make informed strategic decisions and capitalize on market opportunities.

MarketGenics leverages a dedicated industry panel of experts and a comprehensive suite of paid databases to effectively collect, consolidate, and analyze market intelligence.
Our approach has consistently proven to be reliable and effective in generating accurate market insights, identifying key industry trends, and uncovering emerging business opportunities.
Through both primary and secondary research, we capture and analyze critical company-level data such as manufacturing footprints, including technical centers, R&D facilities, sales offices, and headquarters.
Our expert panel further enhances our ability to estimate market size for specific brands based on validated field-level intelligence.
Our data mining techniques incorporate both parametric and non-parametric methods, allowing for structured data collection, sorting, processing, and cleaning.
Demand projections are derived from large-scale data sets analyzed through proprietary algorithms, culminating in robust and reliable market sizing.
Research Approach
The bottom-up approach builds market estimates by starting with the smallest addressable market units and systematically aggregating them to create comprehensive market size projections.
This method begins with specific, granular data points and builds upward to create the complete market landscape.
Customer Analysis → Segmental Analysis → Geographical Analysis
The top-down approach starts with the broadest possible market data and systematically narrows it down through a series of filters and assumptions to arrive at specific market segments or opportunities.
This method begins with the big picture and works downward to increasingly specific market slices.
TAM → SAM → SOM


Research Methods
Desk / Secondary Research
While analysing the market, we extensively study secondary sources, directories, and databases to identify and collect information useful for this technical, market-oriented, and commercial report. Secondary sources that we utilize are not only the public sources, but it is a combination of Open Source, Associations, Paid Databases, MG Repository & Knowledgebase, and others.
- Company websites, annual reports, financial reports, broker reports, and investor presentations
- National government documents, statistical databases and reports
- News articles, press releases and web-casts specific to the companies operating in the market, Magazines, reports, and others
- We gather information from commercial data sources for deriving company specific data such as segmental revenue, share for geography, product revenue, and others
- Internal and external proprietary databases (industry-specific), relevant patent, and regulatory databases
- Governing Bodies, Government Organizations
- Relevant Authorities, Country-specific Associations for Industries
We also employ the model mapping approach to estimate the product level market data through the players' product portfolio
Primary Research
Primary research/ interviews is vital in analyzing the market. Most of the cases involves paid primary interviews. Primary sources include primary interviews through e-mail interactions, telephonic interviews, surveys as well as face-to-face interviews with the different stakeholders across the value chain including several industry experts.
| Type of Respondents | Number of Primaries |
|---|---|
| Tier 2/3 Suppliers | ~20 |
| Tier 1 Suppliers | ~25 |
| End-users | ~25 |
| Industry Expert/ Panel/ Consultant | ~30 |
| Total | ~100 |
MG Knowledgebase
• Repository of industry blog, newsletter and case studies
• Online platform covering detailed market reports, and company profiles
Forecasting Factors and Models
Forecasting Factors
- Historical Trends – Past market patterns, cycles, and major events that shaped how markets behave over time. Understanding past trends helps predict future behavior.
- Industry Factors – Specific characteristics of the industry like structure, regulations, and innovation cycles that affect market dynamics.
- Macroeconomic Factors – Economic conditions like GDP growth, inflation, and employment rates that affect how much money people have to spend.
- Demographic Factors – Population characteristics like age, income, and location that determine who can buy your product.
- Technology Factors – How quickly people adopt new technology and how much technology infrastructure exists.
- Regulatory Factors – Government rules, laws, and policies that can help or restrict market growth.
- Competitive Factors – Analyzing competition structure such as degree of competition and bargaining power of buyers and suppliers.
Forecasting Models / Techniques
Multiple Regression Analysis
- Identify and quantify factors that drive market changes
- Statistical modeling to establish relationships between market drivers and outcomes
Time Series Analysis – Seasonal Patterns
- Understand regular cyclical patterns in market demand
- Advanced statistical techniques to separate trend, seasonal, and irregular components
Time Series Analysis – Trend Analysis
- Identify underlying market growth patterns and momentum
- Statistical analysis of historical data to project future trends
Expert Opinion – Expert Interviews
- Gather deep industry insights and contextual understanding
- In-depth interviews with key industry stakeholders
Multi-Scenario Development
- Prepare for uncertainty by modeling different possible futures
- Creating optimistic, pessimistic, and most likely scenarios
Time Series Analysis – Moving Averages
- Sophisticated forecasting for complex time series data
- Auto-regressive integrated moving average models with seasonal components
Econometric Models
- Apply economic theory to market forecasting
- Sophisticated economic models that account for market interactions
Expert Opinion – Delphi Method
- Harness collective wisdom of industry experts
- Structured, multi-round expert consultation process
Monte Carlo Simulation
- Quantify uncertainty and probability distributions
- Thousands of simulations with varying input parameters
Research Analysis
Our research framework is built upon the fundamental principle of validating market intelligence from both demand and supply perspectives. This dual-sided approach ensures comprehensive market understanding and reduces the risk of single-source bias.
Demand-Side Analysis: We understand end-user/application behavior, preferences, and market needs along with the penetration of the product for specific application.
Supply-Side Analysis: We estimate overall market revenue, analyze the segmental share along with industry capacity, competitive landscape, and market structure.
Validation & Evaluation
Data triangulation is a validation technique that uses multiple methods, sources, or perspectives to examine the same research question, thereby increasing the credibility and reliability of research findings. In market research, triangulation serves as a quality assurance mechanism that helps identify and minimize bias, validate assumptions, and ensure accuracy in market estimates.
- Data Source Triangulation – Using multiple data sources to examine the same phenomenon
- Methodological Triangulation – Using multiple research methods to study the same research question
- Investigator Triangulation – Using multiple researchers or analysts to examine the same data
- Theoretical Triangulation – Using multiple theoretical perspectives to interpret the same data

Custom Market Research Services
We will customise the research for you, in case the report listed above does not meet your requirements.
Get 10% Free Customisation