3D Printed Packaging Market Size, Share & Trends Analysis Report by Material Type (Polymers, Metals, Composites), Technology Type, Packaging Type, Print Volume/Build Size, Production Capacity, Printing Speed, Layer Resolution/Thickness, Product Complexity, Printer Type, Color Capability, End-Use Industry, and Geography (North America, Europe, Asia Pacific, Middle East, Africa, and South America) – Global Industry Data, Trends, and Forecasts, 2026–2035
|
|
|
Segmental Data Insights |
|
|
Demand Trends |
|
|
Competitive Landscape |
|
|
Strategic Development |
|
|
Future Outlook & Opportunities |
|
3D-Printed-Packaging-Market Size, Share, and Growth
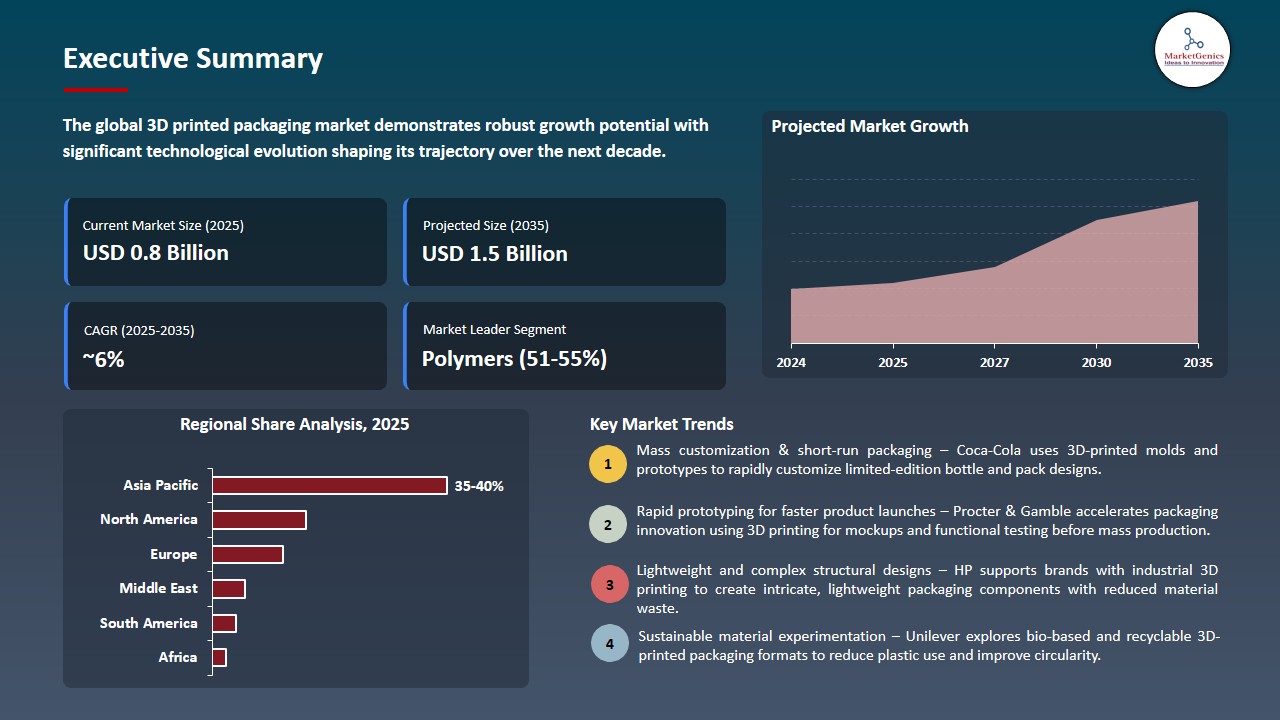
The global 3D printed packaging market is experiencing robust growth, with its estimated value of USD 0.8 billion in the year 2025 and USD 1.5 billion by the period 2035, registering a CAGR of 6.4%, during the forecast period. The global 3D printed packaging market is being influenced by the increased demand in sustainable, individualized, and short-run packaging of consumer goods, electronics, and high-value food and beverage products. The manufacturers are using 3D printing to create customized packaging designs, which lead to a greater brand differentiation, and decreased usage of materials and can quickly change the design without having to invest in conventional tooling, and that is what is being demanded, which is an environmentally friendly and aesthetically pleasing package.
Maurizio Ficcadenti, Global R&D Manager at Baralan, said, Product customization is fundamental for the brand image. With Stratasys’ solution, we can now offer unique and highly recognizable packaging without the need for costly investments in equipment. This approach aligns with our sustainability goals, and it allows us to meet the growing demand for eco-friendly yet distinctive packaging options in the cosmetics industry.
The global 3D printed packaging market is rapidly growing due to the demand among manufacturers of high customizability, low volume, packaging of premium, niche, and specialty goods. The growing needs of individualized packaging design of cosmetics, health supplements, and gourmet foods are increasing adoption since 3D printing can create complex shapes, embossed branding, and batch production without expensive tooling. The trends of urbanization and on the go consumption also drive the necessity of light packaging that is durable and portable and at the same time maintains the product integrity.
The market is being driven by material innovation, in which bio-based polymers, recyclable plastics and hybrid composites are being used to deliver sustainable, regulatory and consumer driven packaging solutions. Enhanced barrier systems, insertable format, and multi-purpose packaging systems are currently underway to safeguard sensitive formulation like drinks, plant-based lines, and dairy substitutes during storing and shipping, as well as to enhance convenience and portability to the user.
Market expansion is increasing due to digital integration and intelligent supply-chain applications, 3D-printed packaging includes QR codes, NFC, and IoT sensors to trace and manage inventory and real-time quality monitoring. These functions help to increase operational efficiency, build brand differentiation, and consumer trust, which makes 3D-printed packaging a high-value, long-term solution in both developed and upcoming markets.
3D-Printed-Packaging-Market Dynamics and Trends
Driver: Rising demand for customized short-run packaging solutions
-
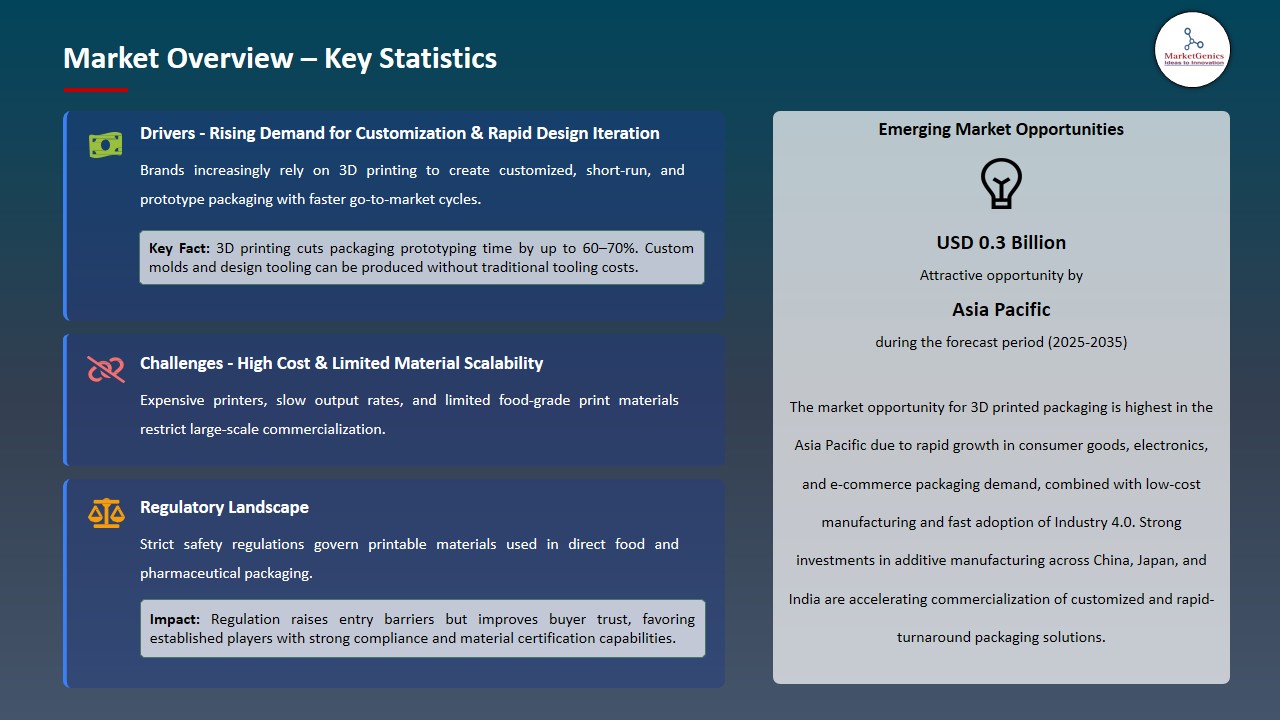
The 3D printed packaging market is gradually being motivated by consumer preference of personalized, small-lot packaging. Increasing demands of niche drinks and specialty food and high-quality consumer care products are also pushing manufacturers to use flexible 3D printing procedures that would allow them to change their design quickly without long lead times or high production volumes.
- Additive manufacturing can be flexible enabling the companies to produce unique shapes, embossed branding, or customized packaging shapes preserving the safety of their products and ensuring their shelf life. This allows it to avoid the reliance on traditional tooling, reduces the cost of setups required in small run productions, and responds promptly to changes in the market or seasonal promotions.
- Creating visually unique and personalized packaging enhances brand contact, perceived value, and loyalty among niche consumers. Based on the capacity to iterate quickly and make items in low amounts, 3D printing accelerates innovation, eliminates inventory risks, and provides a sustainable alternative to low-volume production. Customized packaging is a driving force of growth in both new and established businesses.
Restraint: High cost of 3D printing equipment and materials.
-
High initial expenditure of industrial 3D printers is one of the greatest obstacles in the packaging industry. The high-end systems that are able to print high-resolution and multi-material packaging parts are costly and thus cannot be afforded by the small and mid-sized manufacturers. This restricts their prospects of using 3D printing to develop high-value or personalized packaging.
- Cost of operating also limits adoption. Specialized polymer filaments and bio-based resins that can be used to 3D-print packaging are costly, and high-speed and multi-nozzle printers use a significant amount of electricity and need specialized care. The skilled technicians are also required to perform the machine calibration, quality assurance and post processing which further increases the cost of labor and decreases the ROI especially when the packaging run is short.
- Integrating 3D-packed packaging into existing manufacturing lines, including automation, sterilization, and inspection systems, increases overall costs.
Opportunity: Growth of bio-based and recyclable polymer materials.
-
New possibilities of additive manufacturing have provided a high opportunity of bio-based and recyclable polymer materials in 3D-printed packaging market. Recyclable and reusable 3D-printed packaging can now be manufactured with innovative photopolymer resins made using renewable feedstocks, eliminating the use of petrochemical plastics and promoting the use of a circular-economy.
- The companies are also starting to offer filaments made of recycled content in order to exploit this trend. For instance, KIMYA declared the expansion of high-performance recycled filament, where materials with 70-100 percent recycled plastics have been offered without interfering with the strength or durability of materials, and thus, sustainable 3D-printed packaging solutions with a reduction of carbon emission up to 35 per cent. Short-run production and localized production without environmental harm is further advocated by biodegradable filaments like PLA, which are often mixed with natural additives.
- This development opens up new business opportunities, particularly in nations where consumers and regulators prioritize sustainable packaging.
Key Trend: Adoption of sustainable and recyclable packaging solutions.
-
The bio-based resins and recycled polymer filaments are becoming more accepted in the 3D-printed packaging market as an alternative to the usual virgin plastics. Bio-sourced resin photopolymers are capable of innovation to enable packaging to be 3D printed and then broken down to be re-used again, which will enable a circular economy and can be re-used continuously to create a packaging form.
- Meanwhile, it is also upcycling the post-consumer plastic waste into high-quality 3D-printable filaments. For instance, in April 2024 Filamentive introduced a PLA 3D-printing waste recycling program, which is free, where customers can bring back unused or failed prints, and these are reused to make new filaments. Recent developments also show that the polypropylene and other waste plastics can be washed, recycled and used to make strong packaging materials which can be re-used to make new durable packaging material, making single-use packaging a reusable multiple products.
- The market for 3D-printed packaging is expanding beyond prototypes as sustainable and recyclable materials become available.
3D-Printed-Packaging-Market Analysis and Segmental Data
Polymers Dominate Global 3D Printed Packaging Market
-
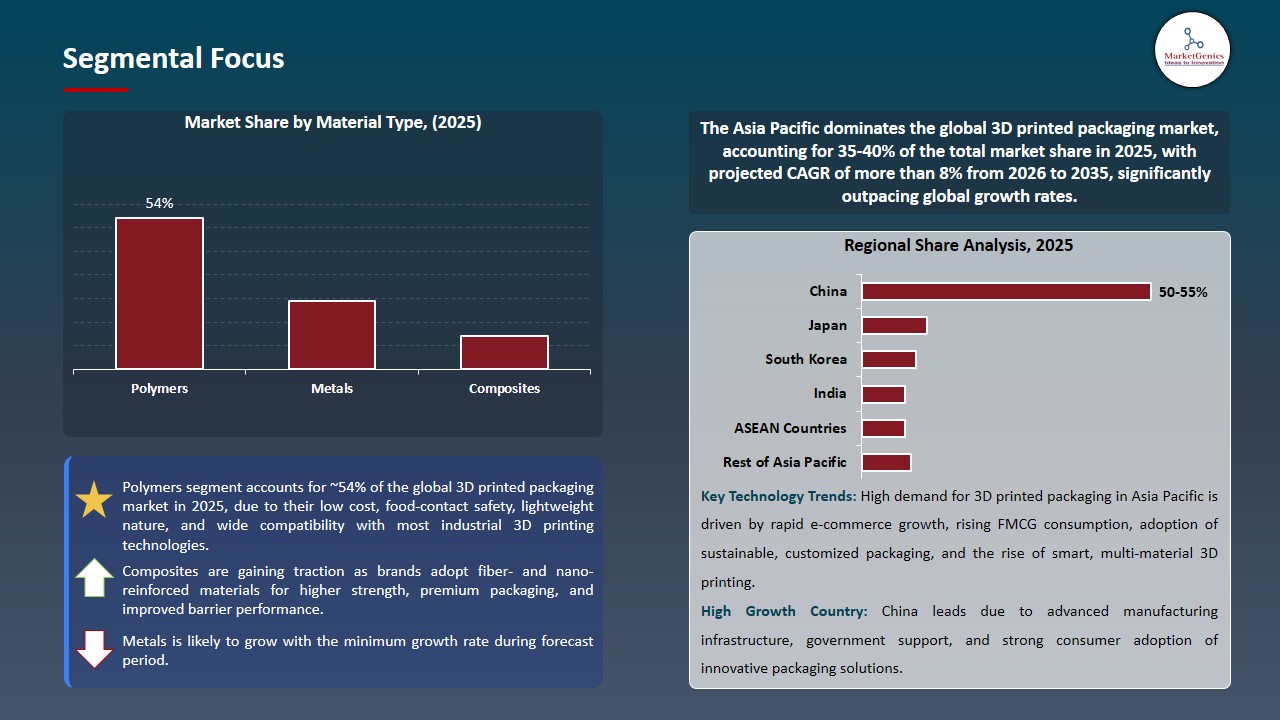
Polymers leads the global 3D-printed packaging market, with most of the share consisting of PLA, PET, and ABS because of their multi-companies, featherweight, resilience, and adaptability to popular technologies of 3D-printing. They are flexible and can produce small-volume or bespoke packaging solutions of custom products in the consumer goods, electronics, cosmetics, and other industries, where traditional processes are not cost-efficient in low-volume or custom production.
- Polymer in 3D-printed packaging is suitable to rapid prototyping, to 3D-printed parts that can be functional, to allow durable inserts, trays, and casings at minimal cost of tooling. In April 2025, researchers have recycled post-consumer polypropylene into high-quality 3D-printing products, showing the dominance of polymers and their position as the solution to cost-effective sustainable packaging. Greener and bio-based alternatives are becoming increasingly popular in the 3D polymer packaging market.
- Environmental and legal concerns are being examined, with bio-polymers such as PLA and recyclable polymers being investigated as alternatives to optimizing usefulness and sustainability in the brand while maintaining the benefits of polymer 3D printing.
Asia Pacific Leads Global 3D Printed Packaging Market Demand
-
Asia Pacific has the highest global 3D printed packaging market because it has a well-developed manufacturing base in the fields of cosmetics, nutraceuticals, electronics, and specialty foods, coupled with an increasing trend in urbanization and premiumization. Widely used short-run, design-intensive, and highly-customized packaging is in demand by brands to deliver products quickly, enable influencer-driven products, and scale-up private-label growth, with conventional tooling being slow and expensive.
- The market is similarly enjoying the increase in localized micro-factories and contract 3D-printing centers, allowing on-demand packaging production requiring minimal tooling and other investment and reduced turnaround times. For instance, November 2024, Baralan created cosmetic containers with polyjet base, 3D printed, to allow fully decorated, multi-color, small-batch high-quality packaging. This brings out the increased trend of customized high-value packaging instead of standardized mass packaging.
- The government's support for smart manufacturing, e-supply chains, and materials, combined with the world's fastest e-commerce penetration, is driving demand for smart, anti-counterfeit, and personalized 3D-printed packaging, ensuring long-term leadership.
3D-Printed-Packaging-Market Ecosystem
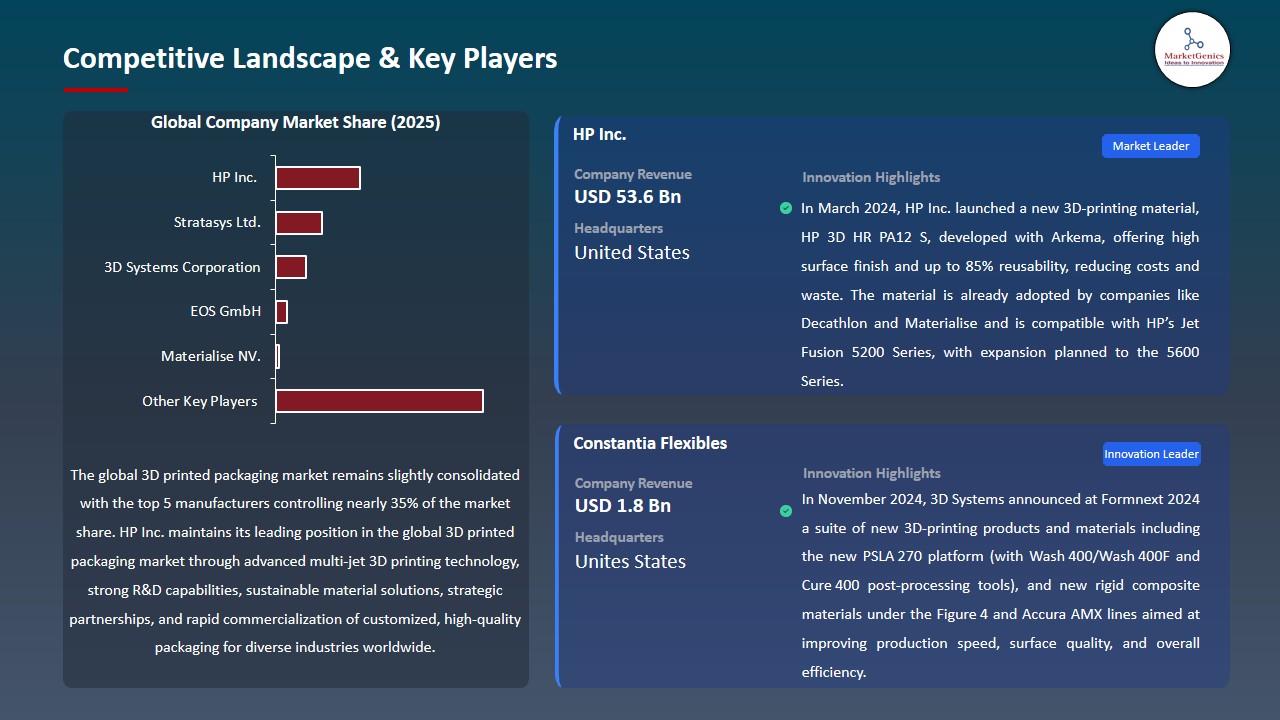
The global 3D-printed packaging market has a moderately consolidated. Players with multinational companies as well as regional and specialized companies competing with various industries of end-use and different price ranges. Tier-1 companies are HP Inc., Stratasys Ltd., 3D Systems Corporation, EOS GmbH, and Materialise NV, which enjoy the benefits of high levels of economies of scale, excellent research and development, and wide international distribution networks. Their technological advantage in the development of 3D printing hardware, software as well as material could enable them offer high precision, multi-material and customized packaging to industries like food, pharmaceutical, cosmetic and luxurious goods.
The ecosystem of the market consists of suppliers of polymers, bio-based resins, and specialty filaments, the 3D printing technologies providers, on-demand production service bureaus, brand owners, and logistics providers all facilitated by digital platforms. The major competitors are investing in verticalization, capacity building and sustainable material development so that they can assure supply security and efficiency in their operation. The increasing use of decentralized micro-factories, mass customization and intelligent solutions of packaging improves the interactions between a brand and its consumer, boosts the speed of product development, and maximizes the profitability over the long term in a competitive market.
Recent Development and Strategic Overview
-
In March 2024, Harpak-ULMA introduced a new tray-package prototyping service, 3D-printed, allowing merchandisers to quickly design and customize tray packages. The service enables companies to produce prototypes within days rather than weeks, save money, material waste and accelerate product development and iteration of food, pharmaceutical and retail packaging.
- In November 2024, Baralan collaborated with Stratasys to introduce a new Cosmetic packaging 3D -printing solution based on PolyJet technology. This enables full-decoration of multi-color and multi-effect glass and plastic containers, multi-color containers that can be made to multiple effects, and the brands can produce customized, low-volume, premium packaging without having to purchase costly tooling.
Report Scope
|
Detail |
|
|
Market Size in 2025 |
USD 0.8 Bn |
|
Market Forecast Value in 2035 |
USD 1.5 Bn |
|
Growth Rate (CAGR) |
6.4% |
|
Forecast Period |
2026 – 2035 |
|
Historical Data Available for |
2021 – 2024 |
|
Market Size Units |
US$ Billion for Value |
|
Report Format |
Electronic (PDF) + Excel |
|
North America |
Europe |
Asia Pacific |
Middle East |
Africa |
South America |
|
|
|
|
|
|
|
Companies Covered |
|||||
|
|
|
|
|
|
3D-Printed-Packaging-Market Segmentation and Highlights
|
Segment |
Sub-segment |
|
3D Printed Packaging Market, By Material Type |
|
|
3D Printed Packaging Market, By Technology Type |
|
|
3D Printed Packaging Market, By Packaging Type |
|
|
3D Printed Packaging Market, By Print Volume/Build Size |
|
|
3D Printed Packaging Market, By Production Capacity |
|
|
3D Printed Packaging Market, By Printing Speed |
|
|
3D Printed Packaging Market, By Layer Resolution/Thickness |
|
|
3D Printed Packaging Market, By Product Complexity |
|
|
3D Printed Packaging Market, By Printer Type |
|
|
3D Printed Packaging Market, By Color Capability |
|
|
3D Printed Packaging Market, By End-Use Industry |
|
Frequently Asked Questions
Table of Contents
- 1. Research Methodology and Assumptions
- 1.1. Definitions
- 1.2. Research Design and Approach
- 1.3. Data Collection Methods
- 1.4. Base Estimates and Calculations
- 1.5. Forecasting Models
- 1.5.1. Key Forecast Factors & Impact Analysis
- 1.6. Secondary Research
- 1.6.1. Open Sources
- 1.6.2. Paid Databases
- 1.6.3. Associations
- 1.7. Primary Research
- 1.7.1. Primary Sources
- 1.7.2. Primary Interviews with Stakeholders across Ecosystem
- 2. Executive Summary
- 2.1. Global 3D Printed Packaging Market Outlook
- 2.1.1. 3D Printed Packaging Market Size Value (US$ Bn), and Forecasts, 2021-2035
- 2.1.2. Compounded Annual Growth Rate Analysis
- 2.1.3. Growth Opportunity Analysis
- 2.1.4. Segmental Share Analysis
- 2.1.5. Geographical Share Analysis
- 2.2. Market Analysis and Facts
- 2.3. Supply-Demand Analysis
- 2.4. Competitive Benchmarking
- 2.5. Go-to- Market Strategy
- 2.5.1. Customer/ End-use Industry Assessment
- 2.5.2. Growth Opportunity Data, 2026-2035
- 2.5.2.1. Regional Data
- 2.5.2.2. Country Data
- 2.5.2.3. Segmental Data
- 2.5.3. Identification of Potential Market Spaces
- 2.5.4. GAP Analysis
- 2.5.5. Potential Attractive Price Points
- 2.5.6. Prevailing Market Risks & Challenges
- 2.5.7. Preferred Sales & Marketing Strategies
- 2.5.8. Key Recommendations and Analysis
- 2.5.9. A Way Forward
- 2.1. Global 3D Printed Packaging Market Outlook
- 3. Industry Data and Premium Insights
- 3.1. Global Packaging Industry Overview, 2025
- 3.1.1. Industry Ecosystem Analysis
- 3.1.2. Key Trends for Packaging Industry
- 3.1.3. Regional Distribution for Packaging Industry
- 3.2. Supplier Customer Data
- 3.3. Technology Roadmap and Developments
- 3.4. Trade Analysis
- 3.4.1. Import & Export Analysis, 2025
- 3.4.2. Top Importing Countries
- 3.4.3. Top Exporting Countries
- 3.5. Trump Tariff Impact Analysis
- 3.5.1. Manufacturer
- 3.5.1.1. Based on the component & Raw material
- 3.5.2. Supply Chain
- 3.5.3. End Consumer
- 3.5.1. Manufacturer
- 3.6. Raw Material Analysis
- 3.1. Global Packaging Industry Overview, 2025
- 4. Market Overview
- 4.1. Market Dynamics
- 4.1.1. Drivers
- 4.1.1.1. Increasing demand for customized and on-demand packaging solutions.
- 4.1.1.2. Growing adoption of sustainable and lightweight packaging materials.
- 4.1.1.3. Technological advancements in 3D printing and additive manufacturing.
- 4.1.2. Restraints
- 4.1.2.1. High initial investment and equipment costs.
- 4.1.2.2. Limited production speed compared to conventional packaging methods.
- 4.1.1. Drivers
- 4.2. Key Trend Analysis
- 4.3. Regulatory Framework
- 4.3.1. Key Regulations, Norms, and Subsidies, by Key Countries
- 4.3.2. Tariffs and Standards
- 4.3.3. Impact Analysis of Regulations on the Market
- 4.4. Value Chain Analysis
- 4.4.1. Raw Material Suppliers
- 4.4.2. Manufacturing
- 4.4.3. Distribution
- 4.4.4. End-Use
- 4.5. Porter’s Five Forces Analysis
- 4.6. PESTEL Analysis
- 4.7. Global 3D Printed Packaging Market Demand
- 4.7.1. Historical Market Size – Value (US$ Bn), 2020-2024
- 4.7.2. Current and Future Market Size – Value (US$ Bn), 2026–2035
- 4.7.2.1. Y-o-Y Growth Trends
- 4.7.2.2. Absolute $ Opportunity Assessment
- 4.1. Market Dynamics
- 5. Competition Landscape
- 5.1. Competition structure
- 5.1.1. Fragmented v/s consolidated
- 5.2. Company Share Analysis, 2025
- 5.2.1. Global Company Market Share
- 5.2.2. By Region
- 5.2.2.1. North America
- 5.2.2.2. Europe
- 5.2.2.3. Asia Pacific
- 5.2.2.4. Middle East
- 5.2.2.5. Africa
- 5.2.2.6. South America
- 5.3. Product Comparison Matrix
- 5.3.1. Specifications
- 5.3.2. Market Positioning
- 5.3.3. Pricing
- 5.1. Competition structure
- 6. Global 3D Printed Packaging Market Analysis, by Material Type
- 6.1. Key Segment Analysis
- 6.2. 3D Printed Packaging Market Size Value (US$ Bn), Analysis, and Forecasts, by Material Type, 2021-2035
- 6.2.1. Polymers
- 6.2.1.1. Polylactic Acid (PLA)
- 6.2.1.2. Acrylonitrile Butadiene Styrene (ABS)
- 6.2.1.3. Polyethylene Terephthalate Glycol (PETG)
- 6.2.1.4. Thermoplastic Polyurethane (TPU)
- 6.2.1.5. Nylon/Polyamide
- 6.2.1.6. Others
- 6.2.2. Metals
- 6.2.2.1. Stainless Steel
- 6.2.2.2. Aluminum
- 6.2.2.3. Titanium
- 6.2.2.4. Others
- 6.2.3. Composites
- 6.2.3.1. Carbon Fiber Reinforced
- 6.2.3.2. Glass Fiber Reinforced
- 6.2.3.3. Bio-based Materials
- 6.2.3.4. Others
- 6.2.1. Polymers
- 7. Global 3D Printed Packaging Market Analysis, by Technology Type
- 7.1. Key Segment Analysis
- 7.2. 3D Printed Packaging Market Size Value (US$ Bn), Analysis, and Forecasts, by Technology Type, 2021-2035
- 7.2.1. Fused Deposition Modeling (FDM)
- 7.2.2. Stereolithography (SLA)
- 7.2.3. Selective Laser Sintering (SLS)
- 7.2.4. Digital Light Processing (DLP)
- 7.2.5. Multi Jet Fusion (MJF)
- 7.2.6. Binder Jetting
- 7.2.7. Material Jetting
- 7.2.8. Direct Energy Deposition
- 7.2.9. Others
- 8. Global 3D Printed Packaging Market Analysis, by Packaging Type
- 8.1. Key Segment Analysis
- 8.2. 3D Printed Packaging Market Size Value (US$ Bn), Analysis, and Forecasts, by Packaging Type, 2021-2035
- 8.2.1. Primary Packaging
- 8.2.1.1. Bottles & Containers
- 8.2.1.2. Caps & Closures
- 8.2.1.3. Tubes
- 8.2.1.4. Jars
- 8.2.1.5. Others
- 8.2.2. Secondary Packaging
- 8.2.2.1. Boxes
- 8.2.2.2. Trays
- 8.2.2.3. Inserts
- 8.2.2.4. Dividers
- 8.2.2.5. Others
- 8.2.3. Tertiary Packaging
- 8.2.3.1. Pallets
- 8.2.3.2. Crates
- 8.2.3.3. Others
- 8.2.4. Protective Packaging
- 8.2.5. Display Packaging
- 8.2.1. Primary Packaging
- 9. Global 3D Printed Packaging Market Analysis, by Print Volume/Build Size
- 9.1. Key Segment Analysis
- 9.2. 3D Printed Packaging Market Size Value (US$ Bn), Analysis, and Forecasts, by Print Volume/Build Size, 2021-2035
- 9.2.1. Small Scale (< 200mm³)
- 9.2.2. Medium Scale (200-500mm³)
- 9.2.3. Large Scale (> 500mm³)
- 10. Global 3D Printed Packaging Market Analysis, by Production Capacity
- 10.1. Key Segment Analysis
- 10.2. 3D Printed Packaging Market Size Value (US$ Bn), Analysis, and Forecasts, by Production Capacity, 2021-2035
- 10.2.1. < 100 units/day
- 10.2.2. 100-500 units/day
- 10.2.3. > 500 units/day
- 11. Global 3D Printed Packaging Market Analysis, by Printing Speed
- 11.1. Key Segment Analysis
- 11.2. 3D Printed Packaging Market Size Value (US$ Bn), Analysis, and Forecasts, by Printing Speed, 2021-2035
- 11.2.1. Low Speed (< 50mm/s)
- 11.2.2. Medium Speed (50-150mm/s)
- 11.2.3. High Speed (> 150mm/s)
- 12. Global 3D Printed Packaging Market Analysis, by Layer Resolution/Thickness
- 12.1. Key Segment Analysis
- 12.2. 3D Printed Packaging Market Size Value (US$ Bn), Analysis, and Forecasts, by Layer Resolution/Thickness, 2021-2035
- 12.2.1. < 50 microns
- 12.2.2. 50-200 microns
- 12.2.3. > 200 microns
- 13. Global 3D Printed Packaging Market Analysis, by Product Complexity
- 13.1. Key Segment Analysis
- 13.2. 3D Printed Packaging Market Size Value (US$ Bn), Analysis, and Forecasts, by Product Complexity, 2021-2035
- 13.2.1. Simple Geometry
- 13.2.2. Moderate Complexity
- 13.2.3. High Complexity (with lattice structures)
- 13.2.4. Custom/Personalized Designs
- 14. Global 3D Printed Packaging Market Analysis, by Printer Type
- 14.1. Key Segment Analysis
- 14.2. 3D Printed Packaging Market Size Value (US$ Bn), Analysis, and Forecasts, by Printer Type, 2021-2035
- 14.2.1. Desktop 3D Printers
- 14.2.2. Industrial 3D Printers
- 14.2.3. Professional 3D Printers
- 15. Global 3D Printed Packaging Market Analysis, by Color Capability
- 15.1. Key Segment Analysis
- 15.2. 3D Printed Packaging Market Size Value (US$ Bn), Analysis, and Forecasts, by Color Capability, 2021-2035
- 15.2.1. Single Color
- 15.2.2. Multi-Color
- 15.2.3. Full Color
- 16. Global 3D Printed Packaging Market Analysis, by End-Use Industry
- 16.1. Key Segment Analysis
- 16.2. 3D Printed Packaging Market Size Value (US$ Bn), Analysis, and Forecasts, by Color Capability, 2021-2035
- 16.2.1. Food & Beverage
- 16.2.1.1. Custom Bottle Design
- 16.2.1.2. Personalized Labels & Containers
- 16.2.1.3. Specialized Closures
- 16.2.1.4. Prototype Packaging
- 16.2.1.5. Limited Edition Packaging
- 16.2.1.6. Temperature-Controlled Packaging
- 16.2.1.7. Others
- 16.2.2. Pharmaceutical & Healthcare
- 16.2.2.1. Child-Resistant Packaging
- 16.2.2.2. Medication Dispensers
- 16.2.2.3. Blister Packs
- 16.2.2.4. Medical Device Packaging
- 16.2.2.5. Clinical Trial Packaging
- 16.2.2.6. Compliance Packaging
- 16.2.2.7. Sterile Packaging
- 16.2.2.8. Others
- 16.2.3. Cosmetics & Personal Care
- 16.2.3.1. Luxury Packaging
- 16.2.3.2. Custom Perfume Bottles
- 16.2.3.3. Sample Containers
- 16.2.3.4. Travel-Sized Packaging
- 16.2.3.5. Refillable Containers
- 16.2.3.6. Limited Edition Collections
- 16.2.3.7. Others
- 16.2.4. Consumer Electronics
- 16.2.4.1. Custom Device Cases
- 16.2.4.2. Protective Inserts
- 16.2.4.3. Cable Management Solutions
- 16.2.4.4. Display Packaging
- 16.2.4.5. Spare Parts Packaging
- 16.2.4.6. Shock-Absorbing Packaging
- 16.2.4.7. Others
- 16.2.5. Automotive
- 16.2.5.1. Spare Parts Packaging
- 16.2.5.2. Component Protection
- 16.2.5.3. Tool Packaging
- 16.2.5.4. Custom Fitments
- 16.2.5.5. Shipping Containers
- 16.2.5.6. Others
- 16.2.6. E-commerce & Retail
- 16.2.6.1. Custom Shipping Boxes
- 16.2.6.2. Product Inserts
- 16.2.6.3. Branded Packaging
- 16.2.6.4. Unboxing Experience Packaging
- 16.2.6.5. Return Packaging
- 16.2.6.6. Gift Packaging
- 16.2.6.7. Others
- 16.2.7. Industrial & Manufacturing
- 16.2.7.1. Tool Holders
- 16.2.7.2. Jigs & Fixtures Packaging
- 16.2.7.3. Heavy Equipment Parts Packaging
- 16.2.7.4. Calibration Equipment Packaging
- 16.2.7.5. Others
- 16.2.8. Jewelry & Luxury Goods
- 16.2.8.1. Custom Ring Boxes
- 16.2.8.2. Watch Cases
- 16.2.8.3. Display Cases
- 16.2.8.4. Gift Boxes
- 16.2.8.5. Security Packaging
- 16.2.8.6. Others
- 16.2.9. Aerospace & Defense
- 16.2.9.1. Sensitive Equipment Packaging
- 16.2.9.2. Custom Component Cases
- 16.2.9.3. Transport Containers
- 16.2.9.4. Calibrated Instrument Packaging
- 16.2.9.5. Others
- 16.2.10. Sports & Leisure
- 16.2.10.1. Equipment Protection
- 16.2.10.2. Custom Storage Solutions
- 16.2.10.3. Collectible Packaging
- 16.2.10.4. Event Merchandise Packaging
- 16.2.10.5. Others
- 16.2.11. Other Industries
- 16.2.1. Food & Beverage
- 17. Global 3D Printed Packaging Market Analysis and Forecasts, by Region
- 17.1. Key Findings
- 17.2. 3D Printed Packaging Market Size Value (US$ Bn), Analysis, and Forecasts, by Region, 2021-2035
- 17.2.1. North America
- 17.2.2. Europe
- 17.2.3. Asia Pacific
- 17.2.4. Middle East
- 17.2.5. Africa
- 17.2.6. South America
- 18. North America 3D Printed Packaging Market Analysis
- 18.1. Key Segment Analysis
- 18.2. Regional Snapshot
- 18.3. North America 3D Printed Packaging Market Size- Value (US$ Bn), Analysis, and Forecasts, 2021-2035
- 18.3.1. Material Type
- 18.3.2. Technology Type
- 18.3.3. Packaging Type
- 18.3.4. Print Volume/Build Size
- 18.3.5. Production Capacity
- 18.3.6. Printing Speed
- 18.3.7. Layer Resolution/Thickness
- 18.3.8. Product Complexity
- 18.3.9. Printer Type
- 18.3.10. Color Capability
- 18.3.11. End-Use Industry
- 18.3.12. Country
- 18.3.12.1. USA
- 18.3.12.2. Canada
- 18.3.12.3. Mexico
- 18.4. USA 3D Printed Packaging Market
- 18.4.1. Country Segmental Analysis
- 18.4.2. Material Type
- 18.4.3. Technology Type
- 18.4.4. Packaging Type
- 18.4.5. Print Volume/Build Size
- 18.4.6. Production Capacity
- 18.4.7. Printing Speed
- 18.4.8. Layer Resolution/Thickness
- 18.4.9. Product Complexity
- 18.4.10. Printer Type
- 18.4.11. Color Capability
- 18.4.12. End-Use Industry
- 18.5. Canada 3D Printed Packaging Market
- 18.5.1. Country Segmental Analysis
- 18.5.2. Material Type
- 18.5.3. Technology Type
- 18.5.4. Packaging Type
- 18.5.5. Print Volume/Build Size
- 18.5.6. Production Capacity
- 18.5.7. Printing Speed
- 18.5.8. Layer Resolution/Thickness
- 18.5.9. Product Complexity
- 18.5.10. Printer Type
- 18.5.11. Color Capability
- 18.5.12. End-Use Industry
- 18.6. Mexico 3D Printed Packaging Market
- 18.6.1. Country Segmental Analysis
- 18.6.2. Material Type
- 18.6.3. Technology Type
- 18.6.4. Packaging Type
- 18.6.5. Print Volume/Build Size
- 18.6.6. Production Capacity
- 18.6.7. Printing Speed
- 18.6.8. Layer Resolution/Thickness
- 18.6.9. Product Complexity
- 18.6.10. Printer Type
- 18.6.11. Color Capability
- 18.6.12. End-Use Industry
- 19. Europe 3D Printed Packaging Market Analysis
- 19.1. Key Segment Analysis
- 19.2. Regional Snapshot
- 19.3. Europe 3D Printed Packaging Market Size Value (US$ Bn), Analysis, and Forecasts, 2021-2035
- 19.3.1. Material Type
- 19.3.2. Technology Type
- 19.3.3. Packaging Type
- 19.3.4. Print Volume/Build Size
- 19.3.5. Production Capacity
- 19.3.6. Printing Speed
- 19.3.7. Layer Resolution/Thickness
- 19.3.8. Product Complexity
- 19.3.9. Printer Type
- 19.3.10. Color Capability
- 19.3.11. End-Use Industry
- 19.3.12. Country
- 19.3.12.1. Germany
- 19.3.12.2. United Kingdom
- 19.3.12.3. France
- 19.3.12.4. Italy
- 19.3.12.5. Spain
- 19.3.12.6. Netherlands
- 19.3.12.7. Nordic Countries
- 19.3.12.8. Poland
- 19.3.12.9. Russia & CIS
- 19.3.12.10. Rest of Europe
- 19.4. Germany 3D Printed Packaging Market
- 19.4.1. Country Segmental Analysis
- 19.4.2. Material Type
- 19.4.3. Technology Type
- 19.4.4. Packaging Type
- 19.4.5. Print Volume/Build Size
- 19.4.6. Production Capacity
- 19.4.7. Printing Speed
- 19.4.8. Layer Resolution/Thickness
- 19.4.9. Product Complexity
- 19.4.10. Printer Type
- 19.4.11. Color Capability
- 19.4.12. End-Use Industry
- 19.5. United Kingdom 3D Printed Packaging Market
- 19.5.1. Country Segmental Analysis
- 19.5.2. Material Type
- 19.5.3. Technology Type
- 19.5.4. Packaging Type
- 19.5.5. Print Volume/Build Size
- 19.5.6. Production Capacity
- 19.5.7. Printing Speed
- 19.5.8. Layer Resolution/Thickness
- 19.5.9. Product Complexity
- 19.5.10. Printer Type
- 19.5.11. Color Capability
- 19.5.12. End-Use Industry
- 19.6. France 3D Printed Packaging Market
- 19.6.1. Country Segmental Analysis
- 19.6.2. Material Type
- 19.6.3. Technology Type
- 19.6.4. Packaging Type
- 19.6.5. Print Volume/Build Size
- 19.6.6. Production Capacity
- 19.6.7. Printing Speed
- 19.6.8. Layer Resolution/Thickness
- 19.6.9. Product Complexity
- 19.6.10. Printer Type
- 19.6.11. Color Capability
- 19.6.12. End-Use Industry
- 19.7. Italy 3D Printed Packaging Market
- 19.7.1. Country Segmental Analysis
- 19.7.2. Material Type
- 19.7.3. Technology Type
- 19.7.4. Packaging Type
- 19.7.5. Print Volume/Build Size
- 19.7.6. Production Capacity
- 19.7.7. Printing Speed
- 19.7.8. Layer Resolution/Thickness
- 19.7.9. Product Complexity
- 19.7.10. Printer Type
- 19.7.11. Color Capability
- 19.7.12. End-Use Industry
- 19.8. Spain 3D Printed Packaging Market
- 19.8.1. Country Segmental Analysis
- 19.8.2. Material Type
- 19.8.3. Technology Type
- 19.8.4. Packaging Type
- 19.8.5. Print Volume/Build Size
- 19.8.6. Production Capacity
- 19.8.7. Printing Speed
- 19.8.8. Layer Resolution/Thickness
- 19.8.9. Product Complexity
- 19.8.10. Printer Type
- 19.8.11. Color Capability
- 19.8.12. End-Use Industry
- 19.9. Netherlands 3D Printed Packaging Market
- 19.9.1. Country Segmental Analysis
- 19.9.2. Material Type
- 19.9.3. Technology Type
- 19.9.4. Packaging Type
- 19.9.5. Print Volume/Build Size
- 19.9.6. Production Capacity
- 19.9.7. Printing Speed
- 19.9.8. Layer Resolution/Thickness
- 19.9.9. Product Complexity
- 19.9.10. Printer Type
- 19.9.11. Color Capability
- 19.9.12. End-Use Industry
- 19.10. Nordic Countries 3D Printed Packaging Market
- 19.10.1. Country Segmental Analysis
- 19.10.2. Material Type
- 19.10.3. Technology Type
- 19.10.4. Packaging Type
- 19.10.5. Print Volume/Build Size
- 19.10.6. Production Capacity
- 19.10.7. Printing Speed
- 19.10.8. Layer Resolution/Thickness
- 19.10.9. Product Complexity
- 19.10.10. Printer Type
- 19.10.11. Color Capability
- 19.10.12. End-Use Industry
- 19.11. Poland 3D Printed Packaging Market
- 19.11.1. Country Segmental Analysis
- 19.11.2. Material Type
- 19.11.3. Technology Type
- 19.11.4. Packaging Type
- 19.11.5. Print Volume/Build Size
- 19.11.6. Production Capacity
- 19.11.7. Printing Speed
- 19.11.8. Layer Resolution/Thickness
- 19.11.9. Product Complexity
- 19.11.10. Printer Type
- 19.11.11. Color Capability
- 19.11.12. End-Use Industry
- 19.12. Russia & CIS 3D Printed Packaging Market
- 19.12.1. Country Segmental Analysis
- 19.12.2. Material Type
- 19.12.3. Technology Type
- 19.12.4. Packaging Type
- 19.12.5. Print Volume/Build Size
- 19.12.6. Production Capacity
- 19.12.7. Printing Speed
- 19.12.8. Layer Resolution/Thickness
- 19.12.9. Product Complexity
- 19.12.10. Printer Type
- 19.12.11. Color Capability
- 19.12.12. End-Use Industry
- 19.13. Rest of Europe 3D Printed Packaging Market
- 19.13.1. Country Segmental Analysis
- 19.13.2. Material Type
- 19.13.3. Technology Type
- 19.13.4. Packaging Type
- 19.13.5. Print Volume/Build Size
- 19.13.6. Production Capacity
- 19.13.7. Printing Speed
- 19.13.8. Layer Resolution/Thickness
- 19.13.9. Product Complexity
- 19.13.10. Printer Type
- 19.13.11. Color Capability
- 19.13.12. End-Use Industry
- 20. Asia Pacific 3D Printed Packaging Market Analysis
- 20.1. Key Segment Analysis
- 20.2. Regional Snapshot
- 20.3. Asia Pacific 3D Printed Packaging Market Size Value (US$ Bn), Analysis, and Forecasts, 2021-2035
- 20.3.1. Material Type
- 20.3.2. Technology Type
- 20.3.3. Packaging Type
- 20.3.4. Print Volume/Build Size
- 20.3.5. Production Capacity
- 20.3.6. Printing Speed
- 20.3.7. Layer Resolution/Thickness
- 20.3.8. Product Complexity
- 20.3.9. Printer Type
- 20.3.10. Color Capability
- 20.3.11. End-Use Industry
- 20.3.12. Country
- 20.3.12.1. China
- 20.3.12.2. India
- 20.3.12.3. Japan
- 20.3.12.4. South Korea
- 20.3.12.5. Australia and New Zealand
- 20.3.12.6. Indonesia
- 20.3.12.7. Malaysia
- 20.3.12.8. Thailand
- 20.3.12.9. Vietnam
- 20.3.12.10. Rest of Asia Pacific
- 20.4. China 3D Printed Packaging Market
- 20.4.1. Country Segmental Analysis
- 20.4.2. Material Type
- 20.4.3. Technology Type
- 20.4.4. Packaging Type
- 20.4.5. Print Volume/Build Size
- 20.4.6. Production Capacity
- 20.4.7. Printing Speed
- 20.4.8. Layer Resolution/Thickness
- 20.4.9. Product Complexity
- 20.4.10. Printer Type
- 20.4.11. Color Capability
- 20.4.12. End-Use Industry
- 20.5. India 3D Printed Packaging Market
- 20.5.1. Country Segmental Analysis
- 20.5.2. Material Type
- 20.5.3. Technology Type
- 20.5.4. Packaging Type
- 20.5.5. Print Volume/Build Size
- 20.5.6. Production Capacity
- 20.5.7. Printing Speed
- 20.5.8. Layer Resolution/Thickness
- 20.5.9. Product Complexity
- 20.5.10. Printer Type
- 20.5.11. Color Capability
- 20.5.12. End-Use Industry
- 20.6. Japan 3D Printed Packaging Market
- 20.6.1. Country Segmental Analysis
- 20.6.2. Material Type
- 20.6.3. Technology Type
- 20.6.4. Packaging Type
- 20.6.5. Print Volume/Build Size
- 20.6.6. Production Capacity
- 20.6.7. Printing Speed
- 20.6.8. Layer Resolution/Thickness
- 20.6.9. Product Complexity
- 20.6.10. Printer Type
- 20.6.11. Color Capability
- 20.6.12. End-Use Industry
- 20.7. South Korea 3D Printed Packaging Market
- 20.7.1. Country Segmental Analysis
- 20.7.2. Material Type
- 20.7.3. Technology Type
- 20.7.4. Packaging Type
- 20.7.5. Print Volume/Build Size
- 20.7.6. Production Capacity
- 20.7.7. Printing Speed
- 20.7.8. Layer Resolution/Thickness
- 20.7.9. Product Complexity
- 20.7.10. Printer Type
- 20.7.11. Color Capability
- 20.7.12. End-Use Industry
- 20.8. Australia and New Zealand 3D Printed Packaging Market
- 20.8.1. Country Segmental Analysis
- 20.8.2. Material Type
- 20.8.3. Technology Type
- 20.8.4. Packaging Type
- 20.8.5. Print Volume/Build Size
- 20.8.6. Production Capacity
- 20.8.7. Printing Speed
- 20.8.8. Layer Resolution/Thickness
- 20.8.9. Product Complexity
- 20.8.10. Printer Type
- 20.8.11. Color Capability
- 20.8.12. End-Use Industry
- 20.9. Indonesia 3D Printed Packaging Market
- 20.9.1. Country Segmental Analysis
- 20.9.2. Material Type
- 20.9.3. Technology Type
- 20.9.4. Packaging Type
- 20.9.5. Print Volume/Build Size
- 20.9.6. Production Capacity
- 20.9.7. Printing Speed
- 20.9.8. Layer Resolution/Thickness
- 20.9.9. Product Complexity
- 20.9.10. Printer Type
- 20.9.11. Color Capability
- 20.9.12. End-Use Industry
- 20.10. Malaysia 3D Printed Packaging Market
- 20.10.1. Country Segmental Analysis
- 20.10.2. Material Type
- 20.10.3. Technology Type
- 20.10.4. Packaging Type
- 20.10.5. Print Volume/Build Size
- 20.10.6. Production Capacity
- 20.10.7. Printing Speed
- 20.10.8. Layer Resolution/Thickness
- 20.10.9. Product Complexity
- 20.10.10. Printer Type
- 20.10.11. Color Capability
- 20.10.12. End-Use Industry
- 20.11. Thailand 3D Printed Packaging Market
- 20.11.1. Country Segmental Analysis
- 20.11.2. Material Type
- 20.11.3. Technology Type
- 20.11.4. Packaging Type
- 20.11.5. Print Volume/Build Size
- 20.11.6. Production Capacity
- 20.11.7. Printing Speed
- 20.11.8. Layer Resolution/Thickness
- 20.11.9. Product Complexity
- 20.11.10. Printer Type
- 20.11.11. Color Capability
- 20.11.12. End-Use Industry
- 20.12. Vietnam 3D Printed Packaging Market
- 20.12.1. Country Segmental Analysis
- 20.12.2. Material Type
- 20.12.3. Technology Type
- 20.12.4. Packaging Type
- 20.12.5. Print Volume/Build Size
- 20.12.6. Production Capacity
- 20.12.7. Printing Speed
- 20.12.8. Layer Resolution/Thickness
- 20.12.9. Product Complexity
- 20.12.10. Printer Type
- 20.12.11. Color Capability
- 20.12.12. End-Use Industry
- 20.13. Rest of Asia Pacific 3D Printed Packaging Market
- 20.13.1. Country Segmental Analysis
- 20.13.2. Material Type
- 20.13.3. Technology Type
- 20.13.4. Packaging Type
- 20.13.5. Print Volume/Build Size
- 20.13.6. Production Capacity
- 20.13.7. Printing Speed
- 20.13.8. Layer Resolution/Thickness
- 20.13.9. Product Complexity
- 20.13.10. Printer Type
- 20.13.11. Color Capability
- 20.13.12. End-Use Industry
- 21. Middle East 3D Printed Packaging Market Analysis
- 21.1. Key Segment Analysis
- 21.2. Regional Snapshot
- 21.3. Middle East 3D Printed Packaging Market Size Value (US$ Bn), Analysis, and Forecasts, 2021-2035
- 21.3.1. Material Type
- 21.3.2. Technology Type
- 21.3.3. Packaging Type
- 21.3.4. Print Volume/Build Size
- 21.3.5. Production Capacity
- 21.3.6. Printing Speed
- 21.3.7. Layer Resolution/Thickness
- 21.3.8. Product Complexity
- 21.3.9. Printer Type
- 21.3.10. Color Capability
- 21.3.11. End-Use Industry
- 21.3.12. Country
- 21.3.12.1. Turkey
- 21.3.12.2. UAE
- 21.3.12.3. Saudi Arabia
- 21.3.12.4. Israel
- 21.3.12.5. Rest of Middle East
- 21.4. Turkey 3D Printed Packaging Market
- 21.4.1. Country Segmental Analysis
- 21.4.2. Material Type
- 21.4.3. Technology Type
- 21.4.4. Packaging Type
- 21.4.5. Print Volume/Build Size
- 21.4.6. Production Capacity
- 21.4.7. Printing Speed
- 21.4.8. Layer Resolution/Thickness
- 21.4.9. Product Complexity
- 21.4.10. Printer Type
- 21.4.11. Color Capability
- 21.4.12. End-Use Industry
- 21.5. UAE 3D Printed Packaging Market
- 21.5.1. Country Segmental Analysis
- 21.5.2. Material Type
- 21.5.3. Technology Type
- 21.5.4. Packaging Type
- 21.5.5. Print Volume/Build Size
- 21.5.6. Production Capacity
- 21.5.7. Printing Speed
- 21.5.8. Layer Resolution/Thickness
- 21.5.9. Product Complexity
- 21.5.10. Printer Type
- 21.5.11. Color Capability
- 21.5.12. End-Use Industry
- 21.6. Saudi Arabia 3D Printed Packaging Market
- 21.6.1. Country Segmental Analysis
- 21.6.2. Material Type
- 21.6.3. Technology Type
- 21.6.4. Packaging Type
- 21.6.5. Print Volume/Build Size
- 21.6.6. Production Capacity
- 21.6.7. Printing Speed
- 21.6.8. Layer Resolution/Thickness
- 21.6.9. Product Complexity
- 21.6.10. Printer Type
- 21.6.11. Color Capability
- 21.6.12. End-Use Industry
- 21.7. Israel 3D Printed Packaging Market
- 21.7.1. Country Segmental Analysis
- 21.7.2. Material Type
- 21.7.3. Technology Type
- 21.7.4. Packaging Type
- 21.7.5. Print Volume/Build Size
- 21.7.6. Production Capacity
- 21.7.7. Printing Speed
- 21.7.8. Layer Resolution/Thickness
- 21.7.9. Product Complexity
- 21.7.10. Printer Type
- 21.7.11. Color Capability
- 21.7.12. End-Use Industry
- 21.8. Rest of Middle East 3D Printed Packaging Market
- 21.8.1. Country Segmental Analysis
- 21.8.2. Material Type
- 21.8.3. Technology Type
- 21.8.4. Packaging Type
- 21.8.5. Print Volume/Build Size
- 21.8.6. Production Capacity
- 21.8.7. Printing Speed
- 21.8.8. Layer Resolution/Thickness
- 21.8.9. Product Complexity
- 21.8.10. Printer Type
- 21.8.11. Color Capability
- 21.8.12. End-Use Industry
- 22. Africa 3D Printed Packaging Market Analysis
- 22.1. Key Segment Analysis
- 22.2. Regional Snapshot
- 22.3. Africa 3D Printed Packaging Market Size Value (US$ Bn), Analysis, and Forecasts, 2021-2035
- 22.3.1. Material Type
- 22.3.2. Technology Type
- 22.3.3. Packaging Type
- 22.3.4. Print Volume/Build Size
- 22.3.5. Production Capacity
- 22.3.6. Printing Speed
- 22.3.7. Layer Resolution/Thickness
- 22.3.8. Product Complexity
- 22.3.9. Printer Type
- 22.3.10. Color Capability
- 22.3.11. End-Use Industry
- 22.3.11.1. South Africa
- 22.3.11.2. Egypt
- 22.3.11.3. Nigeria
- 22.3.11.4. Algeria
- 22.3.11.5. Rest of Africa
- 22.4. South Africa 3D Printed Packaging Market
- 22.4.1. Country Segmental Analysis
- 22.4.2. Material Type
- 22.4.3. Technology Type
- 22.4.4. Packaging Type
- 22.4.5. Print Volume/Build Size
- 22.4.6. Production Capacity
- 22.4.7. Printing Speed
- 22.4.8. Layer Resolution/Thickness
- 22.4.9. Product Complexity
- 22.4.10. Printer Type
- 22.4.11. Color Capability
- 22.4.12. End-Use Industry
- 22.5. Egypt 3D Printed Packaging Market
- 22.5.1. Country Segmental Analysis
- 22.5.2. Material Type
- 22.5.3. Technology Type
- 22.5.4. Packaging Type
- 22.5.5. Print Volume/Build Size
- 22.5.6. Production Capacity
- 22.5.7. Printing Speed
- 22.5.8. Layer Resolution/Thickness
- 22.5.9. Product Complexity
- 22.5.10. Printer Type
- 22.5.11. Color Capability
- 22.5.12. End-Use Industry
- 22.6. Nigeria 3D Printed Packaging Market
- 22.6.1. Country Segmental Analysis
- 22.6.2. Material Type
- 22.6.3. Technology Type
- 22.6.4. Packaging Type
- 22.6.5. Print Volume/Build Size
- 22.6.6. Production Capacity
- 22.6.7. Printing Speed
- 22.6.8. Layer Resolution/Thickness
- 22.6.9. Product Complexity
- 22.6.10. Printer Type
- 22.6.11. Color Capability
- 22.6.12. End-Use Industry
- 22.7. Algeria 3D Printed Packaging Market
- 22.7.1. Country Segmental Analysis
- 22.7.2. Material Type
- 22.7.3. Technology Type
- 22.7.4. Packaging Type
- 22.7.5. Print Volume/Build Size
- 22.7.6. Production Capacity
- 22.7.7. Printing Speed
- 22.7.8. Layer Resolution/Thickness
- 22.7.9. Product Complexity
- 22.7.10. Printer Type
- 22.7.11. Color Capability
- 22.7.12. End-Use Industry
- 22.8. Rest of Africa 3D Printed Packaging Market
- 22.8.1. Country Segmental Analysis
- 22.8.2. Material Type
- 22.8.3. Technology Type
- 22.8.4. Packaging Type
- 22.8.5. Print Volume/Build Size
- 22.8.6. Production Capacity
- 22.8.7. Printing Speed
- 22.8.8. Layer Resolution/Thickness
- 22.8.9. Product Complexity
- 22.8.10. Printer Type
- 22.8.11. Color Capability
- 22.8.12. End-Use Industry
- 23. South America 3D Printed Packaging Market Analysis
- 23.1. Key Segment Analysis
- 23.2. Regional Snapshot
- 23.3. South America 3D Printed Packaging Market Size Value (US$ Bn), Analysis, and Forecasts, 2021-2035
- 23.3.1. Material Type
- 23.3.2. Technology Type
- 23.3.3. Packaging Type
- 23.3.4. Print Volume/Build Size
- 23.3.5. Production Capacity
- 23.3.6. Printing Speed
- 23.3.7. Layer Resolution/Thickness
- 23.3.8. Product Complexity
- 23.3.9. Printer Type
- 23.3.10. Color Capability
- 23.3.11. End-Use Industry
- 23.3.12. Country
- 23.3.12.1. Brazil
- 23.3.12.2. Argentina
- 23.3.12.3. Rest of South America
- 23.4. Brazil 3D Printed Packaging Market
- 23.4.1. Country Segmental Analysis
- 23.4.2. Material Type
- 23.4.3. Technology Type
- 23.4.4. Packaging Type
- 23.4.5. Print Volume/Build Size
- 23.4.6. Production Capacity
- 23.4.7. Printing Speed
- 23.4.8. Layer Resolution/Thickness
- 23.4.9. Product Complexity
- 23.4.10. Printer Type
- 23.4.11. Color Capability
- 23.4.12. End-Use Industry
- 23.5. Argentina 3D Printed Packaging Market
- 23.5.1. Country Segmental Analysis
- 23.5.2. Material Type
- 23.5.3. Technology Type
- 23.5.4. Packaging Type
- 23.5.5. Print Volume/Build Size
- 23.5.6. Production Capacity
- 23.5.7. Printing Speed
- 23.5.8. Layer Resolution/Thickness
- 23.5.9. Product Complexity
- 23.5.10. Printer Type
- 23.5.11. Color Capability
- 23.5.12. End-Use Industry
- 23.6. Rest of South America 3D Printed Packaging Market
- 23.6.1. Country Segmental Analysis
- 23.6.2. Material Type
- 23.6.3. Technology Type
- 23.6.4. Packaging Type
- 23.6.5. Print Volume/Build Size
- 23.6.6. Production Capacity
- 23.6.7. Printing Speed
- 23.6.8. Layer Resolution/Thickness
- 23.6.9. Product Complexity
- 23.6.10. Printer Type
- 23.6.11. Color Capability
- 23.6.12. End-Use Industry
- 24. Key Players/ Company Profile
- 24.1. 3D Systems Corporation
- 24.1.1. Company Details/ Overview
- 24.1.2. Company Financials
- 24.1.3. Key Customers and Competitors
- 24.1.4. Business/ Industry Portfolio
- 24.1.5. Product Portfolio/ Specification Details
- 24.1.6. Pricing Data
- 24.1.7. Strategic Overview
- 24.1.8. Recent Developments
- 24.2. Arcam AB (GE Additive)
- 24.3. BeAM (AddUp)
- 24.4. BigRep GmbH
- 24.5. Canon Inc.
- 24.6. Carbon, Inc.
- 24.7. CELLINK (BICO Group)
- 24.8. EnvisionTEC (Desktop Metal)
- 24.9. EOS GmbH
- 24.10. ExOne Company (Desktop Metal)
- 24.11. Formlabs Inc.
- 24.12. HP Inc.
- 24.13. Kornit Digital Ltd.
- 24.14. Markforged Inc.
- 24.15. Massivit 3D Printing Technologies
- 24.16. Materialise NV
- 24.17. Nexa3D Inc.
- 24.18. Optomec Inc.
- 24.19. Prodways Group
- 24.20. Proto Labs Inc.
- 24.21. Renishaw plc
- 24.22. Ricoh Company Ltd.
- 24.23. Sculpteo (BASF)
- 24.24. Shapeways Inc.
- 24.25. SLM Solutions Group AG
- 24.26. Stratasys Ltd.
- 24.27. Ultimaker BV
- 24.28. Voxeljet AG
- 24.29. Xerox Corporation
- 24.30. Xometry Inc.
- 24.31. Other Key Players
- 24.1. 3D Systems Corporation
Note* - This is just tentative list of players. While providing the report, we will cover more number of players based on their revenue and share for each geography
Research Design
Our research design integrates both demand-side and supply-side analysis through a balanced combination of primary and secondary research methodologies. By utilizing both bottom-up and top-down approaches alongside rigorous data triangulation methods, we deliver robust market intelligence that supports strategic decision-making.
MarketGenics' comprehensive research design framework ensures the delivery of accurate, reliable, and actionable market intelligence. Through the integration of multiple research approaches, rigorous validation processes, and expert analysis, we provide our clients with the insights needed to make informed strategic decisions and capitalize on market opportunities.

MarketGenics leverages a dedicated industry panel of experts and a comprehensive suite of paid databases to effectively collect, consolidate, and analyze market intelligence.
Our approach has consistently proven to be reliable and effective in generating accurate market insights, identifying key industry trends, and uncovering emerging business opportunities.
Through both primary and secondary research, we capture and analyze critical company-level data such as manufacturing footprints, including technical centers, R&D facilities, sales offices, and headquarters.
Our expert panel further enhances our ability to estimate market size for specific brands based on validated field-level intelligence.
Our data mining techniques incorporate both parametric and non-parametric methods, allowing for structured data collection, sorting, processing, and cleaning.
Demand projections are derived from large-scale data sets analyzed through proprietary algorithms, culminating in robust and reliable market sizing.
Research Approach
The bottom-up approach builds market estimates by starting with the smallest addressable market units and systematically aggregating them to create comprehensive market size projections.
This method begins with specific, granular data points and builds upward to create the complete market landscape.
Customer Analysis → Segmental Analysis → Geographical Analysis
The top-down approach starts with the broadest possible market data and systematically narrows it down through a series of filters and assumptions to arrive at specific market segments or opportunities.
This method begins with the big picture and works downward to increasingly specific market slices.
TAM → SAM → SOM


Research Methods
Desk / Secondary Research
While analysing the market, we extensively study secondary sources, directories, and databases to identify and collect information useful for this technical, market-oriented, and commercial report. Secondary sources that we utilize are not only the public sources, but it is a combination of Open Source, Associations, Paid Databases, MG Repository & Knowledgebase, and others.
- Company websites, annual reports, financial reports, broker reports, and investor presentations
- National government documents, statistical databases and reports
- News articles, press releases and web-casts specific to the companies operating in the market, Magazines, reports, and others
- We gather information from commercial data sources for deriving company specific data such as segmental revenue, share for geography, product revenue, and others
- Internal and external proprietary databases (industry-specific), relevant patent, and regulatory databases
- Governing Bodies, Government Organizations
- Relevant Authorities, Country-specific Associations for Industries
We also employ the model mapping approach to estimate the product level market data through the players' product portfolio
Primary Research
Primary research/ interviews is vital in analyzing the market. Most of the cases involves paid primary interviews. Primary sources include primary interviews through e-mail interactions, telephonic interviews, surveys as well as face-to-face interviews with the different stakeholders across the value chain including several industry experts.
| Type of Respondents | Number of Primaries |
|---|---|
| Tier 2/3 Suppliers | ~20 |
| Tier 1 Suppliers | ~25 |
| End-users | ~25 |
| Industry Expert/ Panel/ Consultant | ~30 |
| Total | ~100 |
MG Knowledgebase
• Repository of industry blog, newsletter and case studies
• Online platform covering detailed market reports, and company profiles
Forecasting Factors and Models
Forecasting Factors
- Historical Trends – Past market patterns, cycles, and major events that shaped how markets behave over time. Understanding past trends helps predict future behavior.
- Industry Factors – Specific characteristics of the industry like structure, regulations, and innovation cycles that affect market dynamics.
- Macroeconomic Factors – Economic conditions like GDP growth, inflation, and employment rates that affect how much money people have to spend.
- Demographic Factors – Population characteristics like age, income, and location that determine who can buy your product.
- Technology Factors – How quickly people adopt new technology and how much technology infrastructure exists.
- Regulatory Factors – Government rules, laws, and policies that can help or restrict market growth.
- Competitive Factors – Analyzing competition structure such as degree of competition and bargaining power of buyers and suppliers.
Forecasting Models / Techniques
Multiple Regression Analysis
- Identify and quantify factors that drive market changes
- Statistical modeling to establish relationships between market drivers and outcomes
Time Series Analysis – Seasonal Patterns
- Understand regular cyclical patterns in market demand
- Advanced statistical techniques to separate trend, seasonal, and irregular components
Time Series Analysis – Trend Analysis
- Identify underlying market growth patterns and momentum
- Statistical analysis of historical data to project future trends
Expert Opinion – Expert Interviews
- Gather deep industry insights and contextual understanding
- In-depth interviews with key industry stakeholders
Multi-Scenario Development
- Prepare for uncertainty by modeling different possible futures
- Creating optimistic, pessimistic, and most likely scenarios
Time Series Analysis – Moving Averages
- Sophisticated forecasting for complex time series data
- Auto-regressive integrated moving average models with seasonal components
Econometric Models
- Apply economic theory to market forecasting
- Sophisticated economic models that account for market interactions
Expert Opinion – Delphi Method
- Harness collective wisdom of industry experts
- Structured, multi-round expert consultation process
Monte Carlo Simulation
- Quantify uncertainty and probability distributions
- Thousands of simulations with varying input parameters
Research Analysis
Our research framework is built upon the fundamental principle of validating market intelligence from both demand and supply perspectives. This dual-sided approach ensures comprehensive market understanding and reduces the risk of single-source bias.
Demand-Side Analysis: We understand end-user/application behavior, preferences, and market needs along with the penetration of the product for specific application.
Supply-Side Analysis: We estimate overall market revenue, analyze the segmental share along with industry capacity, competitive landscape, and market structure.
Validation & Evaluation
Data triangulation is a validation technique that uses multiple methods, sources, or perspectives to examine the same research question, thereby increasing the credibility and reliability of research findings. In market research, triangulation serves as a quality assurance mechanism that helps identify and minimize bias, validate assumptions, and ensure accuracy in market estimates.
- Data Source Triangulation – Using multiple data sources to examine the same phenomenon
- Methodological Triangulation – Using multiple research methods to study the same research question
- Investigator Triangulation – Using multiple researchers or analysts to examine the same data
- Theoretical Triangulation – Using multiple theoretical perspectives to interpret the same data

Custom Market Research Services
We will customise the research for you, in case the report listed above does not meet your requirements.
Get 10% Free Customisation