Returnable Packaging Market Size, Share & Trends Analysis Report by Material Type (Plastic, Metal, Wood, Fabric/Textile, Composite Materials), Product Type, Capacity Range, Load Capacity/Rated Capacity, Design Type, Application Type, Tracking Technology Integration, Distribution Channel, End-Use Industry, and Geography (North America, Europe, Asia Pacific, Middle East, Africa, and South America) – Global Industry Data, Trends, and Forecasts, 2026–2035
|
|
|
Segmental Data Insights |
|
|
Demand Trends |
|
|
Competitive Landscape |
|
|
Strategic Development |
|
|
Future Outlook & Opportunities |
|
Returnable Packaging Market Size, Share, and Growth
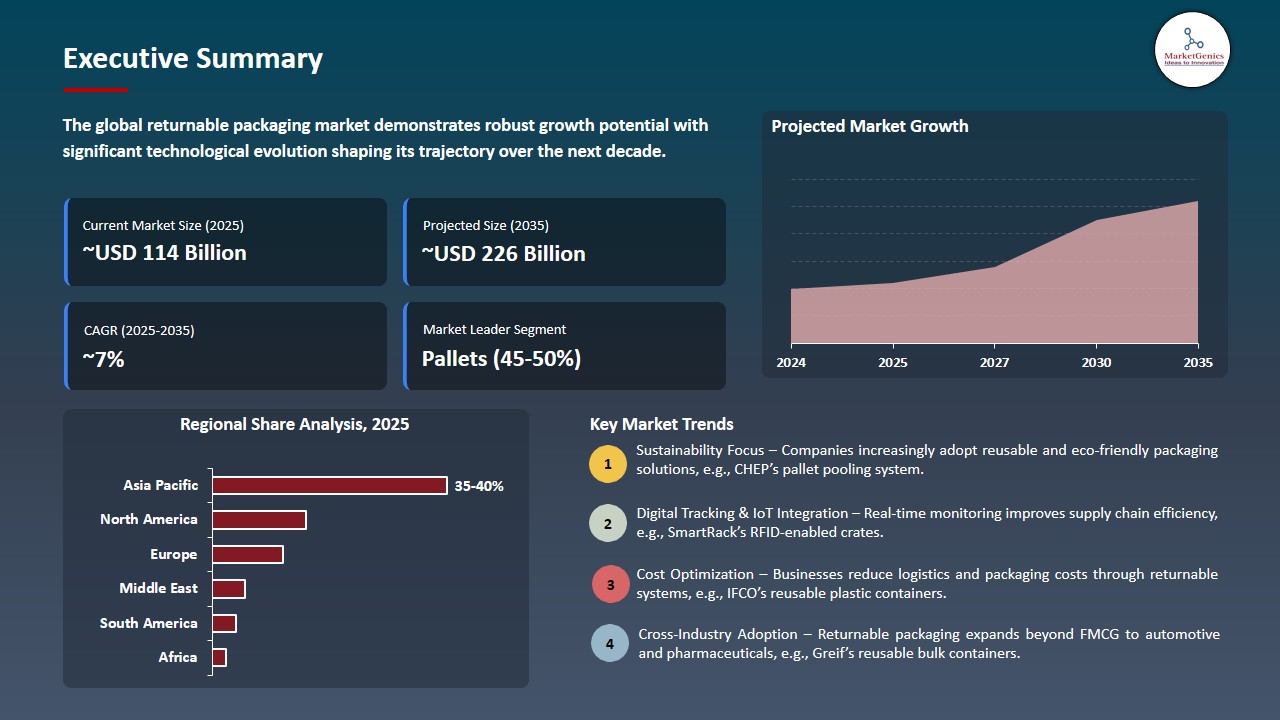
The global returnable packaging market is experiencing robust growth, with its estimated value of USD 113.7 billion in the year 2025 and USD 225.8 billion by the period 2035, registering a CAGR of 7.1%, during the forecast period. An increase in demand of durable, reusable and cost effective packaging solutions in food, beverage and consumer goods markets is driving the global returnable packaging market. Manufacturers are targeting at multi-use crates, pallets, and containers that protect the integrity of the products, have a long shelf life and allow safe and convenient transportation and storage especially of ready-to-drink beverages, dairy, plant-based drinks, and ambient-stable foods.
Erich Jaquemar, Strategic Account Manager at Vetropack in Austria, explains, The bottle is around 30 per cent lighter than a traditional reusable bottle and has at least the same or better pressure and impact resistance. The stability of the lightweight glass bottle has been proven in extensive tests. Due to fewer scuff marks on the contact surfaces, it can achieve around 20 per cent more refill loops compared to conventional containers. At the same time, the bottle's stability offers a plus in food safety.
The returnable packaging market is experiencing faster expansion in high density retail, food and beverage distribution channels because of the demand to have cost-effective packaging solutions, durable and reusable. For instance, in July 2025 Bonson Packaging announced a two-year trial partnership with New World supermarkets, in which reusable deli-food containers with a tap-to-borrow feature would be introduced in order to cut single-use packaging waste. The growing consumer demand towards convenient and environmentally-friendly packaging, and the pressure on manufacturers to limit single-use plastics, is forcing manufacturers to implement modular crates, foldable pallets, and multi-use containers that maximize their transport and storage efficiency.
Technological progress in materials and design is the center of the market development. Firms are adopting high-strength plastics, recycled plastics, and lightweight metals to design solutions that can be reused, but still preserve the integrity of products with limited effects on the environment. For instance, in 2025, AeroFlexx collaborated with Chemipack to come up with eco-friendly liquid packaging solutions in Europe, integrating flexible packaging systems with scalable filling systems to cut down on the use of virgin plastic and improve on the recyclability. Its more sophisticated systems of tracking, RFID tagging, automated washing and monitoring technologies are further increasing the lifecycle management, losses in the short and turnaround times.
Digital supply-chain integration, the development of e-commerce, and the regionalized pooling models are also influencing the market. The trends allow the brands and distributors to achieve lower logistics, grow asset management, and enhance the practices of the circle economy, making the reusable packaging a strategic and sustainable measure in the mature and developing markets.
Returnable Packaging Market Dynamics and Trends
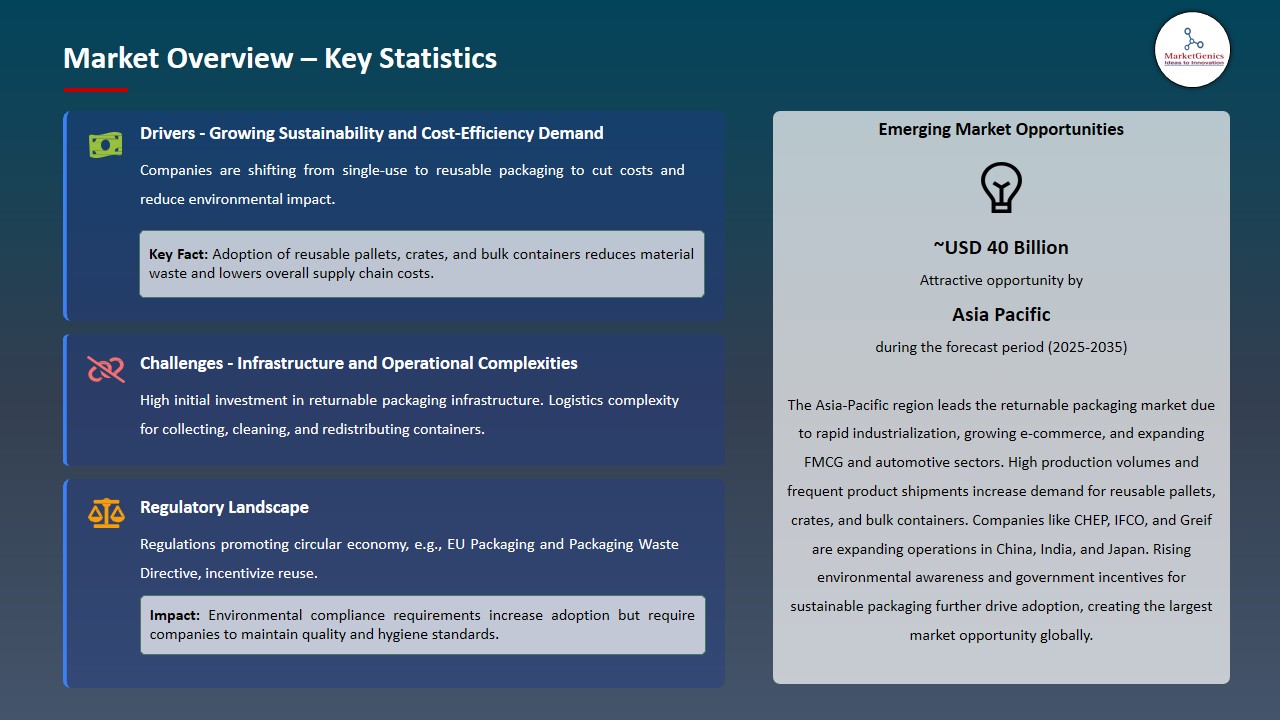
Driver: Growing demand for multi-use and cost-efficient packaging
-
The returnable packaging market becomes more and more associated with manufacturers and retailers who are interested in optimization of supply chains, minimization of single-use waste, and decreased packaging costs in general. Multi-purpose crates, fold-up pallets and modular containers enable the re-use of the transport and storage cycles, which not only minimize the per-trip costs but also provide the protection of the product across different distribution outlets.
- To satisfy this demand, companies are coming up with innovative approaches to the demand by offering durable, lightweight as well as stackable packaging designs. For instance, in 2025, IFCO released its Dora reusable plastic pallet, which is aimed at reuse in pooling systems to enhance logistics efficiency and lower the costs. RFID-tagged high-strength polymer and metal pallets are also making it possible to track the usage of the assets very carefully to reduce losses and maximize the turnaround efficiency and hygienic and intact products in a variety of trips.
- Returnable and modular packaging is becoming the new standard in the retail, food, beverage, and consumer goods industries, aligning with the circular economy and prioritizing convenience, economy, and sustainability.
Restraint: High investment and maintenance costs of reusable packaging.
-
Implementation of reusable packaging systems is costly in terms of initial capital. Durable crates, modular pallets and special totes need to be ordered in large quantities to form workable pooling networks. Small and medium-sized manufacturers do not easily have the means to invest in these, restricting entry to the market and rate of adoption in cost-sensitive markets.
- Other cost factors that limit growth include operational and maintenance costs. Food and beverage industries are one of the areas where pooled packaging needs to be cleaned, inspected and repaired regularly to ensure hygiene and functionality. Washing and tracking systems that reuse assets and labour to handle the latter, as well as automation to operate them, contribute to continuous spending, making their cost of ownership higher and their short-term ROI decreased.
- Implementing reusable packaging in present supply chains needs adjustments to shipping, storage, and reverse-collection systems
Opportunity: Expansion of pooled and modular packaging systems
-
Returnable Packaging market is moving towards pooled and modular system whereby several companies can use the durable pallets, crates and containers. These systems decrease the amount of units required, cut down the logistics expenses, and enhance the use of the assets in the supply chains, which form an attractive growth opportunity in particular regions with high-density consumption and scattered retail chains.
- Companies are investing in intelligent pooling systems and flexible packaging, which can be reconfigured to suit new types of products and transportation requirements. For instance, in November 2025, PRS Pooling declared its intention to expand its services to South-East Europe in terms of pallet-pooling so that pallets could be actively recovered, repaired, and reused in new markets. Modular crates and foldable pallets allow efficient storage, transport and reverse logistics whilst maintaining hygiene and durability. Inventory optimization, shortening of turnaround times and reduction of losses can be achieved by strategic investments in local pooling centers and tracking technologies.
- Pooled and modular packaging systems can enhance a brand's sustainability profile, reduce costs, and strengthen supply chain resilience, enabling long-term expansion in global and emerging markets.
Key Trend: Adoption of reusable and sustainable packaging solutions.
-
The returnable packaging market is shifting more towards durable multi-use systems of recycled high-strength polymer or metals. Stackable crates, foldable pallets, and modular totes and the innovations enable companies to produce less waste, lower transportation expenses, and enhance supply-chain efficiencies, whilst contributing to the efforts of a circular-economy.
- A number of manufacturers are launching closed-loop systems to decrease the use of single-use packaging. For instance, in March 2025, Schoeller Allibert together with Tetra Pak introduced transport crates that are created out of recycled beverage cartons that substitute tens of thousands of single-use crates without altering their durability or functionality. Continuing innovations also indicate that the single-use packaging can be transformed into a new, more sustainable and multi-use products by cleaning, processing, and reusing of polypropylene and other waste plastics to create components of a durable packaging.
- With the introduction of reusable and sustainable packaging, brands are becoming more efficient, fulfilling environmental requirements and competitive positioning has been enhanced in the retail, food, and beverages markets.
Returnable-Packaging-Market Analysis and Segmental Data
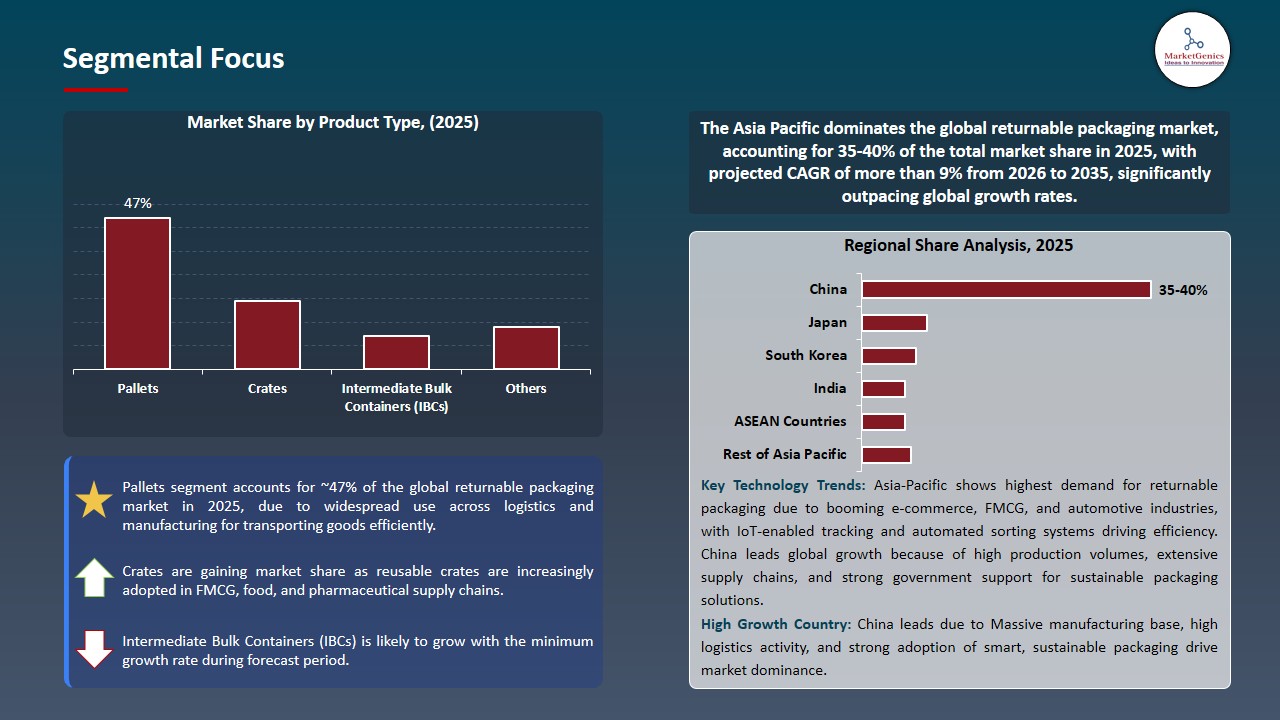
Pallets Dominate Global Returnable Packaging Market
-
Pallets dominate the global returnable packaging market, as they are the workhorse of the contemporary supply-chain logistics. They are designed in a standard format and have a load bearing capacity that makes them beneficial to stack, store and transport goods in any industry such as food and beverage or even automotive and retail. Pallets are always among the highest in the percentage of products by type, as they are universally useful in distribution system and warehouses.
- Plastic and metal pallets are replacing the wooden ones because of the improved durability, hygiene, and automation. For instance, in November 2025, ORBIS launched a redesigned plant in Greenville, Texas, to manufacture reusable pallets and containers, and the company points out that it is investing in scaleable, shared returnable packaging. This facilitates the repetitions of reuse and cost efficiency in the long term.
- The pallet segment is growing due to sustainability, waste reduction laws, and the use of shared or closed-loop pallet systems. These features solidify pallets as the most attractive logistical resource, making them an important facilitator of the circular-economy approach to the worldwide returnable packaging market.
Asia Pacific Leads Global Returnable Packaging Market Demand
-
Asia Pacific dominates the returnable packaging market as a fast moving production and distribution center in the food, beverages, consumer goods and electronic sector. The high human density and short shelf life of products make single-use packaging ineffective, which forces the use of reusable crates, pallets, and intermediate bulk containers to reduce expenses and stabilize large-volume supply chains.
- One of its key structural incentives is the platform-based retail and hyperlocal logistics model of the region. Huge groceries platforms, quick-commerce platforms, and fresh-food aggregators use closed-loop crate and tote platforms to allow them to provide fast last-mile delivery and reverse collection on the same day. For instance, a pilot project by WWF-Singapore in partnership with UOB, SingPost and Better Packaging to advance reusable e-commerce packaging, whereby customers could also reuse crates and totes through various channels, represented a demonstration of scalable solutions of the circular economy in high-density urban environments.
- High-durability, multi-trip packaging is becoming more popular due to rising polymer costs, resource efficiency concerns, and regulatory regulations on plastic recycling. Automated washing, inspection, and RFID monitoring improve turnaround time, prevent loss, and increase lifecycle transparency, strengthening Asia Pacific's leadership in the returnable packaging market.
Returnable-Packaging-Market Ecosystem
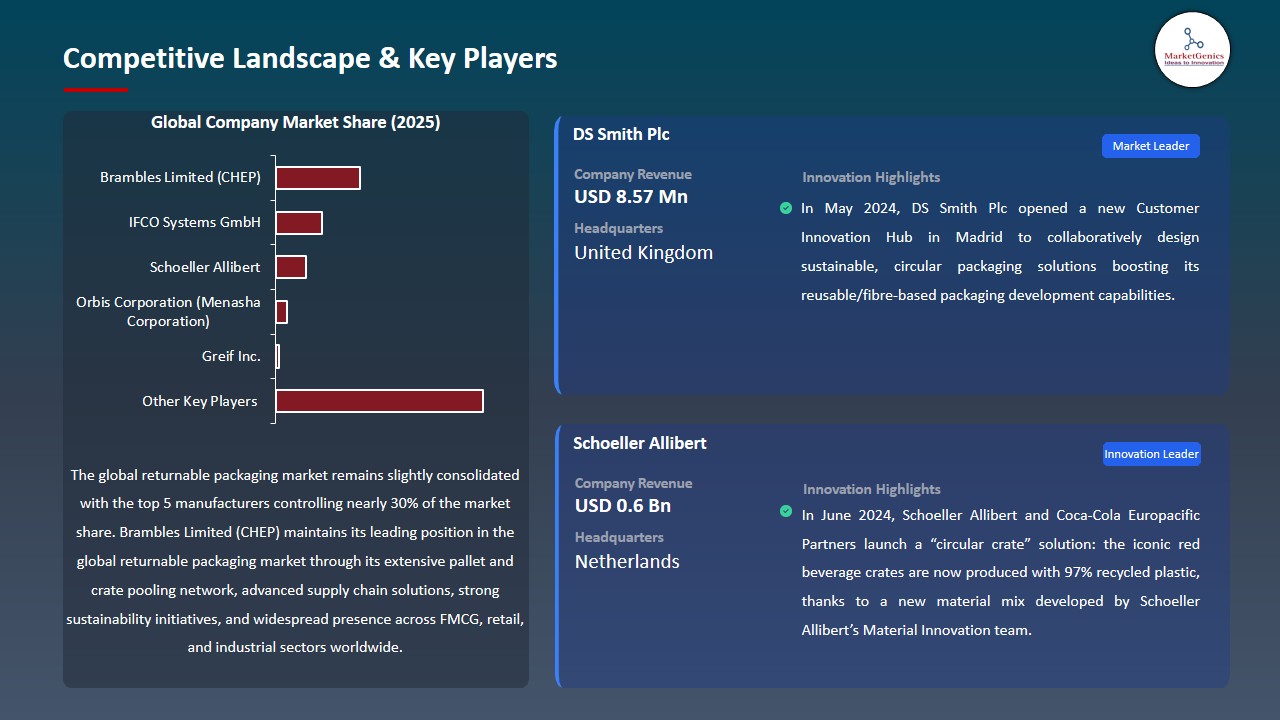
The global returnable packaging market is slightly fragmented which is marked by the existence of big multinational solution companies and small regional experts that serve different end-use sectors like food and beverage, automotive, retail, agriculture, and pharmaceuticals. The Tier-1 competitive environment is comprised of Brambles Limited (CHEP), IFCO Systems GmbH, Schoeller Allibert, Orbis Corporation, and Greif Inc. These businesses enjoy substantial pooled network of assets, in-house container designs, digitalized tracking of their assets, and long-term contracts of international retailers, automobile manufacturers, and food processors.
The value chain includes polymer and recycled resin suppliers, returnable crates and pallets manufacturers, pooling and asset-management service providers, brand owners, logistics service providers, and reverse-logistics partners that are becoming increasingly backed by IoT, RFID and cloud-based tracking applications.
The key players are investing heavily in closed-loop pooling, automated cleaning and repair facilities, lightweight and high-durability polymers, and geographical asset pooling to reduce empty backhaul. Simultaneously, data-driven fleet optimization, reusable packaging as-a-service models, and retailer-integrated recovery networks are increasing supply chain visibility, asset use rates, and long-term profitability in an efficiency-driven market.
Recent Development and Strategic Overview
-
In May 2025, choeller Allibert declared a new platinum partnership with Transoplast Group in order to enhance distribution of returnable packaging solutions. The cooperation allows working with quicker delivery, inventory handling, and containerization of reusable crates, pallets, and containers. It also supports the sustainability initiatives by advancing recyclable and circular-economy packages.
- In February 2024, Vetropack Group, presented a new glass bottle, 0.33 litre, which is a lightweight and returnable glass bottle, as a typical solution to the Austrian brewing sector. The new bottle weighs approximately 30% less than the traditional returnable bottles yet it is strong and resistant to pressure. This innovation assists in creating transport emission reductions, enhancing the performance of refill-cycle, and promotes the cycle packaging of Austria.
Report Scope
|
Detail |
|
|
Market Size in 2025 |
USD 113.7 Bn |
|
Market Forecast Value in 2035 |
USD 225.8 Bn |
|
Growth Rate (CAGR) |
7.1% |
|
Forecast Period |
2026 – 2035 |
|
Historical Data Available for |
2021 – 2024 |
|
Market Size Units |
US$ Billion for Value |
|
Report Format |
Electronic (PDF) + Excel |
|
North America |
Europe |
Asia Pacific |
Middle East |
Africa |
South America |
|
|
|
|
|
|
|
Companies Covered |
|||||
|
|
|
|
|
|
Returnable-Packaging-Market Segmentation and Highlights
|
Segment |
Sub-segment |
|
Returnable Packaging Market, By Returnable Packaging |
|
|
Returnable Packaging Market, By Product Type |
|
|
Returnable Packaging Market, By Capacity Range |
|
|
Returnable Packaging Market, By Load Capacity/Rated Capacity |
|
|
Returnable Packaging Market, By Design Type |
|
|
Returnable Packaging Market, By Application Type |
|
|
Returnable Packaging Market, By Tracking Technology Integration |
|
|
Returnable Packaging Market, By Tracking Technology Integration |
|
|
Returnable Packaging Market, By Distribution Channel |
|
|
Returnable Packaging Market, By End-Use Industry |
|
Frequently Asked Questions
Table of Contents
- 1. Research Methodology and Assumptions
- 1.1. Definitions
- 1.2. Research Design and Approach
- 1.3. Data Collection Methods
- 1.4. Base Estimates and Calculations
- 1.5. Forecasting Models
- 1.5.1. Key Forecast Factors & Impact Analysis
- 1.6. Secondary Research
- 1.6.1. Open Sources
- 1.6.2. Paid Databases
- 1.6.3. Associations
- 1.7. Primary Research
- 1.7.1. Primary Sources
- 1.7.2. Primary Interviews with Stakeholders across Ecosystem
- 2. Executive Summary
- 2.1. Global Returnable Packaging Market Outlook
- 2.1.1. Returnable Packaging Market Size Value (US$ Bn), and Forecasts, 2021-2035
- 2.1.2. Compounded Annual Growth Rate Analysis
- 2.1.3. Growth Opportunity Analysis
- 2.1.4. Segmental Share Analysis
- 2.1.5. Geographical Share Analysis
- 2.2. Market Analysis and Facts
- 2.3. Supply-Demand Analysis
- 2.4. Competitive Benchmarking
- 2.5. Go-to- Market Strategy
- 2.5.1. Customer/ End-use Industry Assessment
- 2.5.2. Growth Opportunity Data, 2026-2035
- 2.5.2.1. Regional Data
- 2.5.2.2. Country Data
- 2.5.2.3. Segmental Data
- 2.5.3. Identification of Potential Market Spaces
- 2.5.4. GAP Analysis
- 2.5.5. Potential Attractive Price Points
- 2.5.6. Prevailing Market Risks & Challenges
- 2.5.7. Preferred Sales & Marketing Strategies
- 2.5.8. Key Recommendations and Analysis
- 2.5.9. A Way Forward
- 2.1. Global Returnable Packaging Market Outlook
- 3. Industry Data and Premium Insights
- 3.1. Global Packaging Industry Overview, 2025
- 3.1.1. Packaging Industry Ecosystem Analysis
- 3.1.2. Key Trends for Packaging Industry
- 3.1.3. Regional Distribution for Packaging Industry
- 3.2. Supplier Customer Data
- 3.3. Technology Roadmap and Developments
- 3.4. Trade Analysis
- 3.4.1. Import & Export Analysis, 2025
- 3.4.2. Top Importing Countries
- 3.4.3. Top Exporting Countries
- 3.5. Trump Tariff Impact Analysis
- 3.5.1. Manufacturer
- 3.5.1.1. Based on the component & Raw material
- 3.5.2. Supply Chain
- 3.5.3. End Consumer
- 3.5.1. Manufacturer
- 3.6. Raw Material Analysis
- 3.1. Global Packaging Industry Overview, 2025
- 4. Market Overview
- 4.1. Market Dynamics
- 4.1.1. Drivers
- 4.1.1.1. Rising focus on sustainability and circular economy practices.
- 4.1.1.2. Cost savings from repeated use over long supply cycles.
- 4.1.1.3. Growing demand from food & beverage, automotive, and retail logistics sectors.
- 4.1.2. Restraints
- 4.1.2.1. High initial investment and asset tracking costs.
- 4.1.2.2. Reverse logistics and cleaning infrastructure challenges.
- 4.1.1. Drivers
- 4.2. Key Trend Analysis
- 4.3. Regulatory Framework
- 4.3.1. Key Regulations, Norms, and Subsidies, by Key Countries
- 4.3.2. Tariffs and Standards
- 4.3.3. Impact Analysis of Regulations on the Market
- 4.4. Value Chain Analysis
- 4.4.1. Raw Material Suppliers
- 4.4.2. Manufacturing
- 4.4.3. Distribution
- 4.4.4. End-Use
- 4.5. Porter’s Five Forces Analysis
- 4.6. PESTEL Analysis
- 4.7. Global Returnable Packaging Market Demand
- 4.7.1. Historical Market Size – Value (US$ Bn), 2020-2024
- 4.7.2. Current and Future Market Size – Value (US$ Bn), 2026–2035
- 4.7.2.1. Y-o-Y Growth Trends
- 4.7.2.2. Absolute $ Opportunity Assessment
- 4.1. Market Dynamics
- 5. Competition Landscape
- 5.1. Competition structure
- 5.1.1. Fragmented v/s consolidated
- 5.2. Company Share Analysis, 2025
- 5.2.1. Global Company Market Share
- 5.2.2. By Region
- 5.2.2.1. North America
- 5.2.2.2. Europe
- 5.2.2.3. Asia Pacific
- 5.2.2.4. Middle East
- 5.2.2.5. Africa
- 5.2.2.6. South America
- 5.3. Product Comparison Matrix
- 5.3.1. Specifications
- 5.3.2. Market Positioning
- 5.3.3. Pricing
- 5.1. Competition structure
- 6. Global Returnable Packaging Market Analysis, by Material Type
- 6.1. Key Segment Analysis
- 6.2. Returnable Packaging Market Size Value (US$ Bn), Analysis, and Forecasts, by Material Type, 2021-2035
- 6.2.1. Plastic
- 6.2.1.1. Polypropylene (PP)
- 6.2.1.2. Polyethylene (PE)
- 6.2.1.3. High-Density Polyethylene (HDPE)
- 6.2.1.4. Polystyrene (PS)
- 6.2.1.5. ABS (Acrylonitrile Butadiene Styrene)
- 6.2.1.6. Others
- 6.2.2. Metal
- 6.2.2.1. Steel
- 6.2.2.2. Aluminum
- 6.2.2.3. Stainless Steel
- 6.2.2.4. Others
- 6.2.3. Wood
- 6.2.3.1. Hardwood
- 6.2.3.2. Softwood
- 6.2.3.3. Plywood
- 6.2.3.4. Others
- 6.2.4. Fabric/Textile
- 6.2.5. Composite Materials
- 6.2.1. Plastic
- 7. Global Returnable Packaging Market Analysis, by Product Type
- 7.1. Key Segment Analysis
- 7.2. Returnable Packaging Market Size Value (US$ Bn), Analysis, and Forecasts, by Product Type, 2021-2035
- 7.2.1. Pallets
- 7.2.1.1. Plastic Pallets
- 7.2.1.2. Metal Pallets
- 7.2.1.3. Wood Pallets
- 7.2.1.4. Others
- 7.2.2. Crates
- 7.2.2.1. Collapsible Crates
- 7.2.2.2. Fixed Crates
- 7.2.2.3. Stackable Crates
- 7.2.2.4. Others
- 7.2.3. Intermediate Bulk Containers (IBCs)
- 7.2.3.1. Drums & Barrels
- 7.2.3.2. Bottles & Containers
- 7.2.3.3. Dunnage
- 7.2.3.4. Trays
- 7.2.3.5. Racks
- 7.2.3.6. Dividers
- 7.2.3.7. Others
- 7.2.4. Bulk Boxes
- 7.2.5. Totes & Bins
- 7.2.1. Pallets
- 8. Global Returnable Packaging Market Analysis, by Capacity Range
- 8.1. Key Segment Analysis
- 8.2. Returnable Packaging Market Size Value (US$ Bn), Analysis, and Forecasts, by Capacity Range, 2021-2035
- 8.2.1. Less than 50 Liters
- 8.2.2. 50-500 Liters
- 8.2.3. 500-1000 Liters
- 8.2.4. Above 1000 Liters
- 9. Global Returnable Packaging Market Analysis, by Load Capacity/Rated Capacity
- 9.1. Key Segment Analysis
- 9.2. Returnable Packaging Market Size Value (US$ Bn), Analysis, and Forecasts, by Load Capacity/Rated Capacity, 2021-2035
- 9.2.1. Up to 500 kg
- 9.2.2. 500-1000 kg
- 9.2.3. 1000-2000 kg
- 9.2.4. Above 2000 kg
- 10. Global Returnable Packaging Market Analysis, by Design Type
- 10.1. Key Segment Analysis
- 10.2. Returnable Packaging Market Size Value (US$ Bn), Analysis, and Forecasts, by Design Type, 2021-2035
- 10.2.1. Collapsible/Foldable
- 10.2.2. Stackable
- 10.2.3. Nestable
- 10.2.4. Rigid/Fixed
- 10.2.5. Modular
- 11. Global Returnable Packaging Market Analysis, by Application Type
- 11.1. Key Segment Analysis
- 11.2. Returnable Packaging Market Size Value (US$ Bn), Analysis, and Forecasts, by Application Type, 2021-2035
- 11.2.1. Storage
- 11.2.2. Transportation
- 11.2.3. Display & Retail
- 11.2.4. Handling & Distribution
- 11.2.5. Reverse Logistics
- 12. Global Returnable Packaging Market Analysis, by Tracking Technology Integration
- 12.1. Key Segment Analysis
- 12.2. Returnable Packaging Market Size Value (US$ Bn), Analysis, and Forecasts, by Tracking Technology Integration, 2021-2035
- 12.2.1. RFID Enabled
- 12.2.2. Barcode Enabled
- 12.2.3. GPS Enabled
- 12.2.4. IoT Enabled
- 12.2.5. Non-Tracked/Standard
- 13. Global Returnable Packaging Market Analysis, by Distribution Channel
- 13.1. Key Segment Analysis
- 13.2. Returnable Packaging Market Size Value (US$ Bn), Analysis, and Forecasts, by Distribution Channel, 2021-2035
- 13.2.1. Direct Sales
- 13.2.2. Distributors
- 13.2.3. Online Channels
- 13.2.4. Rental/Leasing Services
- 14. Global Returnable Packaging Market Analysis, by End-Use Industry
- 14.1. Key Segment Analysis
- 14.2. Returnable Packaging Market Size Value (US$ Bn), Analysis, and Forecasts, by End-Use Industry, 2021-2035
- 14.2.1. Automotive Industry
- 14.2.1.1. Engine Parts Storage
- 14.2.1.2. Component Transportation
- 14.2.1.3. Assembly Line Logistics
- 14.2.1.4. Aftermarket Parts Distribution
- 14.2.1.5. Reverse Logistics/Returns
- 14.2.1.6. Others
- 14.2.2. Food & Beverage Industry
- 14.2.2.1. Fresh Produce Transportation
- 14.2.2.2. Dairy Products Handling
- 14.2.2.3. Beverage Distribution
- 14.2.2.4. Meat & Seafood Logistics
- 14.2.2.5. Bakery & Confectionery
- 14.2.2.6. Cold Chain Storage
- 14.2.2.7. Others
- 14.2.3. Pharmaceutical & Healthcare
- 14.2.3.1. Drug Distribution
- 14.2.3.2. Medical Device Transportation
- 14.2.3.3. Vaccine & Biologics Cold Chain
- 14.2.3.4. Hospital Supply Management
- 14.2.3.5. Clinical Trial Materials
- 14.2.3.6. Others
- 14.2.4. Retail & E-commerce
- 14.2.4.1. In-Store Display
- 14.2.4.2. Distribution Center Operations
- 14.2.4.3. Last-Mile Delivery
- 14.2.4.4. Returns Management
- 14.2.4.5. Cross-Docking Operations
- 14.2.4.6. Others
- 14.2.5. Electronics & Electrical
- 14.2.5.1. Component Protection
- 14.2.5.2. Finished Goods Distribution
- 14.2.5.3. Sensitive Equipment Handling
- 14.2.5.4. White Goods Transportation
- 14.2.5.5. Consumer Electronics Retail
- 14.2.5.6. Others
- 14.2.6. Chemical & Petrochemical
- 14.2.6.1. Hazardous Material Containment
- 14.2.6.2. Bulk Chemical Transportation
- 14.2.6.3. Industrial Chemical Storage
- 14.2.6.4. Laboratory Supply Management
- 14.2.6.5. Others
- 14.2.7. Agriculture & Horticulture
- 14.2.7.1. Harvest Collection
- 14.2.7.2. Farm-to-Market Transportation
- 14.2.7.3. Seed & Fertilizer Distribution
- 14.2.7.4. Livestock Feed Handling
- 14.2.7.5. Others
- 14.2.8. Manufacturing & Industrial
- 14.2.8.1. Work-in-Progress Handling
- 14.2.8.2. Raw Material Storage
- 14.2.8.3. Finished Goods Distribution
- 14.2.8.4. Inter-Plant Logistics
- 14.2.8.5. Tool & Equipment Management
- 14.2.8.6. Others
- 14.2.9. Logistics & Warehousing
- 14.2.9.1. Cross-Docking Operations
- 14.2.9.2. Third-Party Logistics (3PL)
- 14.2.9.3. Distribution Center Management
- 14.2.9.4. Inventory Management
- 14.2.9.5. Order Fulfillment
- 14.2.9.6. Others
- 14.2.10. Aerospace & Defense
- 14.2.10.1. Aircraft Component Transportation
- 14.2.10.2. Military Equipment Logistics
- 14.2.10.3. Precision Parts Handling
- 14.2.10.4. Maintenance & Repair Operations
- 14.2.10.5. Others
- 14.2.11. Other Industries
- 14.2.1. Automotive Industry
- 15. Global Returnable Packaging Market Analysis and Forecasts, by Region
- 15.1. Key Findings
- 15.2. Returnable Packaging Market Size Value (US$ Bn), Analysis, and Forecasts, by Region, 2021-2035
- 15.2.1. North America
- 15.2.2. Europe
- 15.2.3. Asia Pacific
- 15.2.4. Middle East
- 15.2.5. Africa
- 15.2.6. South America
- 16. North America Returnable Packaging Market Analysis
- 16.1. Key Segment Analysis
- 16.2. Regional Snapshot
- 16.3. North America Returnable Packaging Market Size- Value (US$ Bn), Analysis, and Forecasts, 2021-2035
- 16.3.1. Material Type
- 16.3.2. Product Type
- 16.3.3. Capacity Range
- 16.3.4. Load Capacity/Rated Capacity
- 16.3.5. Design Type
- 16.3.6. Application Type
- 16.3.7. Tracking Technology Integration
- 16.3.8. Distribution Channel
- 16.3.9. End-Use Industry
- 16.3.10. Country
- 16.3.10.1. USA
- 16.3.10.2. Canada
- 16.3.10.3. Mexico
- 16.4. USA Returnable Packaging Market
- 16.4.1. Country Segmental Analysis
- 16.4.2. Material Type
- 16.4.3. Product Type
- 16.4.4. Capacity Range
- 16.4.5. Load Capacity/Rated Capacity
- 16.4.6. Design Type
- 16.4.7. Application Type
- 16.4.8. Tracking Technology Integration
- 16.4.9. Distribution Channel
- 16.4.10. End-Use Industry
- 16.5. Canada Returnable Packaging Market
- 16.5.1. Country Segmental Analysis
- 16.5.2. Material Type
- 16.5.3. Product Type
- 16.5.4. Capacity Range
- 16.5.5. Load Capacity/Rated Capacity
- 16.5.6. Design Type
- 16.5.7. Application Type
- 16.5.8. Tracking Technology Integration
- 16.5.9. Distribution Channel
- 16.5.10. End-Use Industry
- 16.6. Mexico Returnable Packaging Market
- 16.6.1. Country Segmental Analysis
- 16.6.2. Material Type
- 16.6.3. Product Type
- 16.6.4. Capacity Range
- 16.6.5. Load Capacity/Rated Capacity
- 16.6.6. Design Type
- 16.6.7. Application Type
- 16.6.8. Tracking Technology Integration
- 16.6.9. Distribution Channel
- 16.6.10. End-Use Industry
- 17. Europe Returnable Packaging Market Analysis
- 17.1. Key Segment Analysis
- 17.2. Regional Snapshot
- 17.3. Europe Returnable Packaging Market Size Value (US$ Bn), Analysis, and Forecasts, 2021-2035
- 17.3.1. Material Type
- 17.3.2. Product Type
- 17.3.3. Capacity Range
- 17.3.4. Load Capacity/Rated Capacity
- 17.3.5. Design Type
- 17.3.6. Application Type
- 17.3.7. Tracking Technology Integration
- 17.3.8. Distribution Channel
- 17.3.9. End-Use Industry
- 17.3.10. Country
- 17.3.10.1. Germany
- 17.3.10.2. United Kingdom
- 17.3.10.3. France
- 17.3.10.4. Italy
- 17.3.10.5. Spain
- 17.3.10.6. Netherlands
- 17.3.10.7. Nordic Countries
- 17.3.10.8. Poland
- 17.3.10.9. Russia & CIS
- 17.3.10.10. Rest of Europe
- 17.4. Germany Returnable Packaging Market
- 17.4.1. Country Segmental Analysis
- 17.4.2. Material Type
- 17.4.3. Product Type
- 17.4.4. Capacity Range
- 17.4.5. Load Capacity/Rated Capacity
- 17.4.6. Design Type
- 17.4.7. Application Type
- 17.4.8. Tracking Technology Integration
- 17.4.9. Distribution Channel
- 17.4.10. End-Use Industry
- 17.5. United Kingdom Returnable Packaging Market
- 17.5.1. Country Segmental Analysis
- 17.5.2. Material Type
- 17.5.3. Product Type
- 17.5.4. Capacity Range
- 17.5.5. Load Capacity/Rated Capacity
- 17.5.6. Design Type
- 17.5.7. Application Type
- 17.5.8. Tracking Technology Integration
- 17.5.9. Distribution Channel
- 17.5.10. End-Use Industry
- 17.6. France Returnable Packaging Market
- 17.6.1. Country Segmental Analysis
- 17.6.2. Material Type
- 17.6.3. Product Type
- 17.6.4. Capacity Range
- 17.6.5. Load Capacity/Rated Capacity
- 17.6.6. Design Type
- 17.6.7. Application Type
- 17.6.8. Tracking Technology Integration
- 17.6.9. Distribution Channel
- 17.6.10. End-Use Industry
- 17.7. Italy Returnable Packaging Market
- 17.7.1. Country Segmental Analysis
- 17.7.2. Material Type
- 17.7.3. Product Type
- 17.7.4. Capacity Range
- 17.7.5. Load Capacity/Rated Capacity
- 17.7.6. Design Type
- 17.7.7. Application Type
- 17.7.8. Tracking Technology Integration
- 17.7.9. Distribution Channel
- 17.7.10. End-Use Industry
- 17.8. Spain Returnable Packaging Market
- 17.8.1. Country Segmental Analysis
- 17.8.2. Material Type
- 17.8.3. Product Type
- 17.8.4. Capacity Range
- 17.8.5. Load Capacity/Rated Capacity
- 17.8.6. Design Type
- 17.8.7. Application Type
- 17.8.8. Tracking Technology Integration
- 17.8.9. Distribution Channel
- 17.8.10. End-Use Industry
- 17.9. Netherlands Returnable Packaging Market
- 17.9.1. Country Segmental Analysis
- 17.9.2. Material Type
- 17.9.3. Product Type
- 17.9.4. Capacity Range
- 17.9.5. Load Capacity/Rated Capacity
- 17.9.6. Design Type
- 17.9.7. Application Type
- 17.9.8. Tracking Technology Integration
- 17.9.9. Distribution Channel
- 17.9.10. End-Use Industry
- 17.10. Nordic Countries Returnable Packaging Market
- 17.10.1. Country Segmental Analysis
- 17.10.2. Material Type
- 17.10.3. Product Type
- 17.10.4. Capacity Range
- 17.10.5. Load Capacity/Rated Capacity
- 17.10.6. Design Type
- 17.10.7. Application Type
- 17.10.8. Tracking Technology Integration
- 17.10.9. Distribution Channel
- 17.10.10. End-Use Industry
- 17.11. Poland Returnable Packaging Market
- 17.11.1. Country Segmental Analysis
- 17.11.2. Material Type
- 17.11.3. Product Type
- 17.11.4. Capacity Range
- 17.11.5. Load Capacity/Rated Capacity
- 17.11.6. Design Type
- 17.11.7. Application Type
- 17.11.8. Tracking Technology Integration
- 17.11.9. Distribution Channel
- 17.11.10. End-Use Industry
- 17.12. Russia & CIS Returnable Packaging Market
- 17.12.1. Country Segmental Analysis
- 17.12.2. Material Type
- 17.12.3. Product Type
- 17.12.4. Capacity Range
- 17.12.5. Load Capacity/Rated Capacity
- 17.12.6. Design Type
- 17.12.7. Application Type
- 17.12.8. Tracking Technology Integration
- 17.12.9. Distribution Channel
- 17.12.10. End-Use Industry
- 17.13. Rest of Europe Returnable Packaging Market
- 17.13.1. Country Segmental Analysis
- 17.13.2. Material Type
- 17.13.3. Product Type
- 17.13.4. Capacity Range
- 17.13.5. Load Capacity/Rated Capacity
- 17.13.6. Design Type
- 17.13.7. Application Type
- 17.13.8. Tracking Technology Integration
- 17.13.9. Distribution Channel
- 17.13.10. End-Use Industry
- 18. Asia Pacific Returnable Packaging Market Analysis
- 18.1. Key Segment Analysis
- 18.2. Regional Snapshot
- 18.3. Asia Pacific Returnable Packaging Market Size Value (US$ Bn), Analysis, and Forecasts, 2021-2035
- 18.3.1. Material Type
- 18.3.2. Product Type
- 18.3.3. Capacity Range
- 18.3.4. Load Capacity/Rated Capacity
- 18.3.5. Design Type
- 18.3.6. Application Type
- 18.3.7. Tracking Technology Integration
- 18.3.8. Distribution Channel
- 18.3.9. End-Use Industry
- 18.3.10. Country
- 18.3.10.1. China
- 18.3.10.2. India
- 18.3.10.3. Japan
- 18.3.10.4. South Korea
- 18.3.10.5. Australia and New Zealand
- 18.3.10.6. Indonesia
- 18.3.10.7. Malaysia
- 18.3.10.8. Thailand
- 18.3.10.9. Vietnam
- 18.3.10.10. Rest of Asia Pacific
- 18.4. China Returnable Packaging Market
- 18.4.1. Country Segmental Analysis
- 18.4.2. Material Type
- 18.4.3. Product Type
- 18.4.4. Capacity Range
- 18.4.5. Load Capacity/Rated Capacity
- 18.4.6. Design Type
- 18.4.7. Application Type
- 18.4.8. Tracking Technology Integration
- 18.4.9. Distribution Channel
- 18.4.10. End-Use Industry
- 18.5. India Returnable Packaging Market
- 18.5.1. Country Segmental Analysis
- 18.5.2. Material Type
- 18.5.3. Product Type
- 18.5.4. Capacity Range
- 18.5.5. Load Capacity/Rated Capacity
- 18.5.6. Design Type
- 18.5.7. Application Type
- 18.5.8. Tracking Technology Integration
- 18.5.9. Distribution Channel
- 18.5.10. End-Use Industry
- 18.6. Japan Returnable Packaging Market
- 18.6.1. Country Segmental Analysis
- 18.6.2. Material Type
- 18.6.3. Product Type
- 18.6.4. Capacity Range
- 18.6.5. Load Capacity/Rated Capacity
- 18.6.6. Design Type
- 18.6.7. Application Type
- 18.6.8. Tracking Technology Integration
- 18.6.9. Distribution Channel
- 18.6.10. End-Use Industry
- 18.7. South Korea Returnable Packaging Market
- 18.7.1. Country Segmental Analysis
- 18.7.2. Material Type
- 18.7.3. Product Type
- 18.7.4. Capacity Range
- 18.7.5. Load Capacity/Rated Capacity
- 18.7.6. Design Type
- 18.7.7. Application Type
- 18.7.8. Tracking Technology Integration
- 18.7.9. Distribution Channel
- 18.7.10. End-Use Industry
- 18.8. Australia and New Zealand Returnable Packaging Market
- 18.8.1. Country Segmental Analysis
- 18.8.2. Material Type
- 18.8.3. Product Type
- 18.8.4. Capacity Range
- 18.8.5. Load Capacity/Rated Capacity
- 18.8.6. Design Type
- 18.8.7. Application Type
- 18.8.8. Tracking Technology Integration
- 18.8.9. Distribution Channel
- 18.8.10. End-Use Industry
- 18.9. Indonesia Returnable Packaging Market
- 18.9.1. Country Segmental Analysis
- 18.9.2. Material Type
- 18.9.3. Product Type
- 18.9.4. Capacity Range
- 18.9.5. Load Capacity/Rated Capacity
- 18.9.6. Design Type
- 18.9.7. Application Type
- 18.9.8. Tracking Technology Integration
- 18.9.9. Distribution Channel
- 18.9.10. End-Use Industry
- 18.10. Malaysia Returnable Packaging Market
- 18.10.1. Country Segmental Analysis
- 18.10.2. Material Type
- 18.10.3. Product Type
- 18.10.4. Capacity Range
- 18.10.5. Load Capacity/Rated Capacity
- 18.10.6. Design Type
- 18.10.7. Application Type
- 18.10.8. Tracking Technology Integration
- 18.10.9. Distribution Channel
- 18.10.10. End-Use Industry
- 18.11. Thailand Returnable Packaging Market
- 18.11.1. Country Segmental Analysis
- 18.11.2. Material Type
- 18.11.3. Product Type
- 18.11.4. Capacity Range
- 18.11.5. Load Capacity/Rated Capacity
- 18.11.6. Design Type
- 18.11.7. Application Type
- 18.11.8. Tracking Technology Integration
- 18.11.9. Distribution Channel
- 18.11.10. End-Use Industry
- 18.12. Vietnam Returnable Packaging Market
- 18.12.1. Country Segmental Analysis
- 18.12.2. Material Type
- 18.12.3. Product Type
- 18.12.4. Capacity Range
- 18.12.5. Load Capacity/Rated Capacity
- 18.12.6. Design Type
- 18.12.7. Application Type
- 18.12.8. Tracking Technology Integration
- 18.12.9. Distribution Channel
- 18.12.10. End-Use Industry
- 18.13. Rest of Asia Pacific Returnable Packaging Market
- 18.13.1. Country Segmental Analysis
- 18.13.2. Material Type
- 18.13.3. Product Type
- 18.13.4. Capacity Range
- 18.13.5. Load Capacity/Rated Capacity
- 18.13.6. Design Type
- 18.13.7. Application Type
- 18.13.8. Tracking Technology Integration
- 18.13.9. Distribution Channel
- 18.13.10. End-Use Industry
- 19. Middle East Returnable Packaging Market Analysis
- 19.1. Key Segment Analysis
- 19.2. Regional Snapshot
- 19.3. Middle East Returnable Packaging Market Size Value (US$ Bn), Analysis, and Forecasts, 2021-2035
- 19.3.1. Material Type
- 19.3.2. Product Type
- 19.3.3. Capacity Range
- 19.3.4. Load Capacity/Rated Capacity
- 19.3.5. Design Type
- 19.3.6. Application Type
- 19.3.7. Tracking Technology Integration
- 19.3.8. Distribution Channel
- 19.3.9. End-Use Industry
- 19.3.10. Country
- 19.3.10.1. Turkey
- 19.3.10.2. UAE
- 19.3.10.3. Saudi Arabia
- 19.3.10.4. Israel
- 19.3.10.5. Rest of Middle East
- 19.4. Turkey Returnable Packaging Market
- 19.4.1. Country Segmental Analysis
- 19.4.2. Material Type
- 19.4.3. Product Type
- 19.4.4. Capacity Range
- 19.4.5. Load Capacity/Rated Capacity
- 19.4.6. Design Type
- 19.4.7. Application Type
- 19.4.8. Tracking Technology Integration
- 19.4.9. Distribution Channel
- 19.4.10. End-Use Industry
- 19.5. UAE Returnable Packaging Market
- 19.5.1. Country Segmental Analysis
- 19.5.2. Material Type
- 19.5.3. Product Type
- 19.5.4. Capacity Range
- 19.5.5. Load Capacity/Rated Capacity
- 19.5.6. Design Type
- 19.5.7. Application Type
- 19.5.8. Tracking Technology Integration
- 19.5.9. Distribution Channel
- 19.5.10. End-Use Industry
- 19.6. Saudi Arabia Returnable Packaging Market
- 19.6.1. Country Segmental Analysis
- 19.6.2. Material Type
- 19.6.3. Product Type
- 19.6.4. Capacity Range
- 19.6.5. Load Capacity/Rated Capacity
- 19.6.6. Design Type
- 19.6.7. Application Type
- 19.6.8. Tracking Technology Integration
- 19.6.9. Distribution Channel
- 19.6.10. End-Use Industry
- 19.7. Israel Returnable Packaging Market
- 19.7.1. Country Segmental Analysis
- 19.7.2. Material Type
- 19.7.3. Product Type
- 19.7.4. Capacity Range
- 19.7.5. Load Capacity/Rated Capacity
- 19.7.6. Design Type
- 19.7.7. Application Type
- 19.7.8. Tracking Technology Integration
- 19.7.9. Distribution Channel
- 19.7.10. End-Use Industry
- 19.8. Rest of Middle East Returnable Packaging Market
- 19.8.1. Country Segmental Analysis
- 19.8.2. Material Type
- 19.8.3. Product Type
- 19.8.4. Capacity Range
- 19.8.5. Load Capacity/Rated Capacity
- 19.8.6. Design Type
- 19.8.7. Application Type
- 19.8.8. Tracking Technology Integration
- 19.8.9. Distribution Channel
- 19.8.10. End-Use Industry
- 20. Africa Returnable Packaging Market Analysis
- 20.1. Key Segment Analysis
- 20.2. Regional Snapshot
- 20.3. Africa Returnable Packaging Market Size Value (US$ Bn), Analysis, and Forecasts, 2021-2035
- 20.3.1. Material Type
- 20.3.2. Product Type
- 20.3.3. Capacity Range
- 20.3.4. Load Capacity/Rated Capacity
- 20.3.5. Design Type
- 20.3.6. Application Type
- 20.3.7. Tracking Technology Integration
- 20.3.8. Distribution Channel
- 20.3.9. End-Use Industry
- 20.3.10. Country
- 20.3.10.1. South Africa
- 20.3.10.2. Egypt
- 20.3.10.3. Nigeria
- 20.3.10.4. Algeria
- 20.3.10.5. Rest of Africa
- 20.4. South Africa Returnable Packaging Market
- 20.4.1. Country Segmental Analysis
- 20.4.2. Material Type
- 20.4.3. Product Type
- 20.4.4. Capacity Range
- 20.4.5. Load Capacity/Rated Capacity
- 20.4.6. Design Type
- 20.4.7. Application Type
- 20.4.8. Tracking Technology Integration
- 20.4.9. Distribution Channel
- 20.4.10. End-Use Industry
- 20.5. Egypt Returnable Packaging Market
- 20.5.1. Country Segmental Analysis
- 20.5.2. Material Type
- 20.5.3. Product Type
- 20.5.4. Capacity Range
- 20.5.5. Load Capacity/Rated Capacity
- 20.5.6. Design Type
- 20.5.7. Application Type
- 20.5.8. Tracking Technology Integration
- 20.5.9. Distribution Channel
- 20.5.10. End-Use Industry
- 20.6. Nigeria Returnable Packaging Market
- 20.6.1. Country Segmental Analysis
- 20.6.2. Material Type
- 20.6.3. Product Type
- 20.6.4. Capacity Range
- 20.6.5. Load Capacity/Rated Capacity
- 20.6.6. Design Type
- 20.6.7. Application Type
- 20.6.8. Tracking Technology Integration
- 20.6.9. Distribution Channel
- 20.6.10. End-Use Industry
- 20.7. Algeria Returnable Packaging Market
- 20.7.1. Country Segmental Analysis
- 20.7.2. Material Type
- 20.7.3. Product Type
- 20.7.4. Capacity Range
- 20.7.5. Load Capacity/Rated Capacity
- 20.7.6. Design Type
- 20.7.7. Application Type
- 20.7.8. Tracking Technology Integration
- 20.7.9. Distribution Channel
- 20.7.10. End-Use Industry
- 20.8. Rest of Africa Returnable Packaging Market
- 20.8.1. Country Segmental Analysis
- 20.8.2. Material Type
- 20.8.3. Product Type
- 20.8.4. Capacity Range
- 20.8.5. Load Capacity/Rated Capacity
- 20.8.6. Design Type
- 20.8.7. Application Type
- 20.8.8. Tracking Technology Integration
- 20.8.9. Distribution Channel
- 20.8.10. End-Use Industry
- 21. South America Returnable Packaging Market Analysis
- 21.1. Key Segment Analysis
- 21.2. Regional Snapshot
- 21.3. South America Returnable Packaging Market Size Value (US$ Bn), Analysis, and Forecasts, 2021-2035
- 21.3.1. Material Type
- 21.3.2. Product Type
- 21.3.3. Capacity Range
- 21.3.4. Load Capacity/Rated Capacity
- 21.3.5. Design Type
- 21.3.6. Application Type
- 21.3.7. Tracking Technology Integration
- 21.3.8. Distribution Channel
- 21.3.9. End-Use Industry
- 21.3.10. Country
- 21.3.10.1. Brazil
- 21.3.10.2. Argentina
- 21.3.10.3. Rest of South America
- 21.4. Brazil Returnable Packaging Market
- 21.4.1. Country Segmental Analysis
- 21.4.2. Material Type
- 21.4.3. Product Type
- 21.4.4. Capacity Range
- 21.4.5. Load Capacity/Rated Capacity
- 21.4.6. Design Type
- 21.4.7. Application Type
- 21.4.8. Tracking Technology Integration
- 21.4.9. Distribution Channel
- 21.4.10. End-Use Industry
- 21.5. Argentina Returnable Packaging Market
- 21.5.1. Country Segmental Analysis
- 21.5.2. Material Type
- 21.5.3. Product Type
- 21.5.4. Capacity Range
- 21.5.5. Load Capacity/Rated Capacity
- 21.5.6. Design Type
- 21.5.7. Application Type
- 21.5.8. Tracking Technology Integration
- 21.5.9. Distribution Channel
- 21.5.10. End-Use Industry
- 21.6. Rest of South America Returnable Packaging Market
- 21.6.1. Country Segmental Analysis
- 21.6.2. Material Type
- 21.6.3. Product Type
- 21.6.4. Capacity Range
- 21.6.5. Load Capacity/Rated Capacity
- 21.6.6. Design Type
- 21.6.7. Application Type
- 21.6.8. Tracking Technology Integration
- 21.6.9. Distribution Channel
- 21.6.10. End-Use Industry
- 22. Key Players/ Company Profile
- 22.1. Alfa Plastics S.r.l.
- 22.1.1. Company Details/ Overview
- 22.1.2. Company Financials
- 22.1.3. Key Customers and Competitors
- 22.1.4. Business/ Industry Portfolio
- 22.1.5. Product Portfolio/ Specification Details
- 22.1.6. Pricing Data
- 22.1.7. Strategic Overview
- 22.1.8. Recent Developments
- 22.2. Amatech Inc.
- 22.3. Brambles Limited (CHEP)
- 22.4. Buckhorn Inc.
- 22.5. CABKA Group
- 22.6. DS Smith Plc
- 22.7. Enko Plastics
- 22.8. Enlightening Pallet Industry Co. Ltd.
- 22.9. Georg Utz Holding AG
- 22.10. Greif Inc.
- 22.11. IFCO Systems GmbH
- 22.12. IPL Plastics Inc.
- 22.13. Loadhog Limited
- 22.14. Mauser Packaging Solutions
- 22.15. Myers Industries Inc.
- 22.16. Nefab Group
- 22.17. Orbis Corporation (Menasha Corporation)
- 22.18. Polymer Logistics
- 22.19. Rehrig Pacific Company
- 22.20. RPP Containers
- 22.21. Schoeller Allibert
- 22.22. Schutz GmbH & Co. KGaA
- 22.23. Sintex Plastics Technology Limited
- 22.24. Supreme Industries Limited
- 22.25. TranPak Inc.
- 22.26. WALTHER Folding Box Corporation
- 22.27. Other Key Players
- 22.1. Alfa Plastics S.r.l.
Note* - This is just tentative list of players. While providing the report, we will cover more number of players based on their revenue and share for each geography
Research Design
Our research design integrates both demand-side and supply-side analysis through a balanced combination of primary and secondary research methodologies. By utilizing both bottom-up and top-down approaches alongside rigorous data triangulation methods, we deliver robust market intelligence that supports strategic decision-making.
MarketGenics' comprehensive research design framework ensures the delivery of accurate, reliable, and actionable market intelligence. Through the integration of multiple research approaches, rigorous validation processes, and expert analysis, we provide our clients with the insights needed to make informed strategic decisions and capitalize on market opportunities.

MarketGenics leverages a dedicated industry panel of experts and a comprehensive suite of paid databases to effectively collect, consolidate, and analyze market intelligence.
Our approach has consistently proven to be reliable and effective in generating accurate market insights, identifying key industry trends, and uncovering emerging business opportunities.
Through both primary and secondary research, we capture and analyze critical company-level data such as manufacturing footprints, including technical centers, R&D facilities, sales offices, and headquarters.
Our expert panel further enhances our ability to estimate market size for specific brands based on validated field-level intelligence.
Our data mining techniques incorporate both parametric and non-parametric methods, allowing for structured data collection, sorting, processing, and cleaning.
Demand projections are derived from large-scale data sets analyzed through proprietary algorithms, culminating in robust and reliable market sizing.
Research Approach
The bottom-up approach builds market estimates by starting with the smallest addressable market units and systematically aggregating them to create comprehensive market size projections.
This method begins with specific, granular data points and builds upward to create the complete market landscape.
Customer Analysis → Segmental Analysis → Geographical Analysis
The top-down approach starts with the broadest possible market data and systematically narrows it down through a series of filters and assumptions to arrive at specific market segments or opportunities.
This method begins with the big picture and works downward to increasingly specific market slices.
TAM → SAM → SOM


Research Methods
Desk / Secondary Research
While analysing the market, we extensively study secondary sources, directories, and databases to identify and collect information useful for this technical, market-oriented, and commercial report. Secondary sources that we utilize are not only the public sources, but it is a combination of Open Source, Associations, Paid Databases, MG Repository & Knowledgebase, and others.
- Company websites, annual reports, financial reports, broker reports, and investor presentations
- National government documents, statistical databases and reports
- News articles, press releases and web-casts specific to the companies operating in the market, Magazines, reports, and others
- We gather information from commercial data sources for deriving company specific data such as segmental revenue, share for geography, product revenue, and others
- Internal and external proprietary databases (industry-specific), relevant patent, and regulatory databases
- Governing Bodies, Government Organizations
- Relevant Authorities, Country-specific Associations for Industries
We also employ the model mapping approach to estimate the product level market data through the players' product portfolio
Primary Research
Primary research/ interviews is vital in analyzing the market. Most of the cases involves paid primary interviews. Primary sources include primary interviews through e-mail interactions, telephonic interviews, surveys as well as face-to-face interviews with the different stakeholders across the value chain including several industry experts.
| Type of Respondents | Number of Primaries |
|---|---|
| Tier 2/3 Suppliers | ~20 |
| Tier 1 Suppliers | ~25 |
| End-users | ~25 |
| Industry Expert/ Panel/ Consultant | ~30 |
| Total | ~100 |
MG Knowledgebase
• Repository of industry blog, newsletter and case studies
• Online platform covering detailed market reports, and company profiles
Forecasting Factors and Models
Forecasting Factors
- Historical Trends – Past market patterns, cycles, and major events that shaped how markets behave over time. Understanding past trends helps predict future behavior.
- Industry Factors – Specific characteristics of the industry like structure, regulations, and innovation cycles that affect market dynamics.
- Macroeconomic Factors – Economic conditions like GDP growth, inflation, and employment rates that affect how much money people have to spend.
- Demographic Factors – Population characteristics like age, income, and location that determine who can buy your product.
- Technology Factors – How quickly people adopt new technology and how much technology infrastructure exists.
- Regulatory Factors – Government rules, laws, and policies that can help or restrict market growth.
- Competitive Factors – Analyzing competition structure such as degree of competition and bargaining power of buyers and suppliers.
Forecasting Models / Techniques
Multiple Regression Analysis
- Identify and quantify factors that drive market changes
- Statistical modeling to establish relationships between market drivers and outcomes
Time Series Analysis – Seasonal Patterns
- Understand regular cyclical patterns in market demand
- Advanced statistical techniques to separate trend, seasonal, and irregular components
Time Series Analysis – Trend Analysis
- Identify underlying market growth patterns and momentum
- Statistical analysis of historical data to project future trends
Expert Opinion – Expert Interviews
- Gather deep industry insights and contextual understanding
- In-depth interviews with key industry stakeholders
Multi-Scenario Development
- Prepare for uncertainty by modeling different possible futures
- Creating optimistic, pessimistic, and most likely scenarios
Time Series Analysis – Moving Averages
- Sophisticated forecasting for complex time series data
- Auto-regressive integrated moving average models with seasonal components
Econometric Models
- Apply economic theory to market forecasting
- Sophisticated economic models that account for market interactions
Expert Opinion – Delphi Method
- Harness collective wisdom of industry experts
- Structured, multi-round expert consultation process
Monte Carlo Simulation
- Quantify uncertainty and probability distributions
- Thousands of simulations with varying input parameters
Research Analysis
Our research framework is built upon the fundamental principle of validating market intelligence from both demand and supply perspectives. This dual-sided approach ensures comprehensive market understanding and reduces the risk of single-source bias.
Demand-Side Analysis: We understand end-user/application behavior, preferences, and market needs along with the penetration of the product for specific application.
Supply-Side Analysis: We estimate overall market revenue, analyze the segmental share along with industry capacity, competitive landscape, and market structure.
Validation & Evaluation
Data triangulation is a validation technique that uses multiple methods, sources, or perspectives to examine the same research question, thereby increasing the credibility and reliability of research findings. In market research, triangulation serves as a quality assurance mechanism that helps identify and minimize bias, validate assumptions, and ensure accuracy in market estimates.
- Data Source Triangulation – Using multiple data sources to examine the same phenomenon
- Methodological Triangulation – Using multiple research methods to study the same research question
- Investigator Triangulation – Using multiple researchers or analysts to examine the same data
- Theoretical Triangulation – Using multiple theoretical perspectives to interpret the same data

Custom Market Research Services
We will customise the research for you, in case the report listed above does not meet your requirements.
Get 10% Free Customisation