Active Packaging Market Size, Share & Trends Analysis Report by Technology Type (Oxygen Scavenging Systems, Ethylene Absorbers, Antimicrobial Packaging, Temperature Management Systems, Moisture Control Systems, Carbon Dioxide Emitters/Absorbers, Flavor & Aroma Release Systems), Material Type, Packaging Format, Capacity, Product Shelf-Life Extension, Distribution Channel, End-Use Industry, and Geography (North America, Europe, Asia Pacific, Middle East, Africa, and South America) – Global Industry Data, Trends, and Forecasts, 2026–2035
Active Packaging Market Summary:
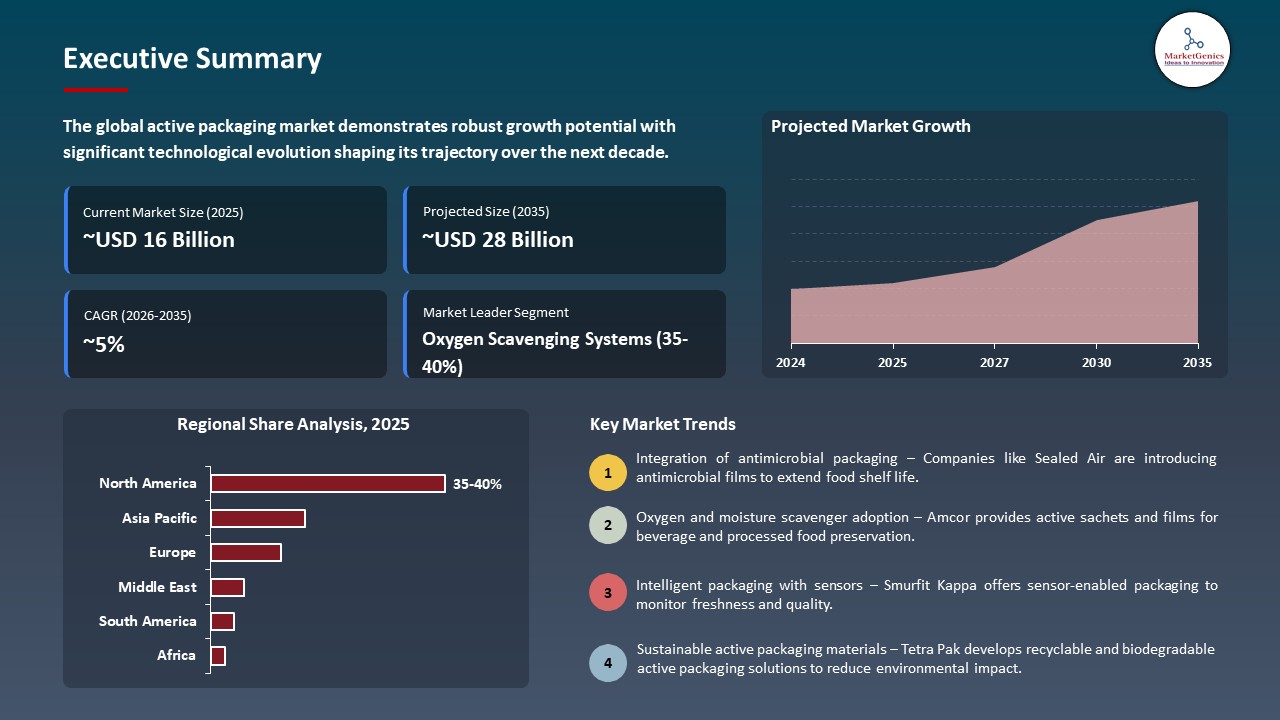
The global active packaging market is witnessing strong growth, valued at USD 16.3 billion in 2025 and projected to reach USD 27.6 billion by 2035, expanding at a CAGR of 5.4% during the forecast period.
|
|
|
Segmental Data Insights |
|
|
Demand Trends |
|
|
Competitive Landscape |
|
|
Strategic Development |
|
|
Future Outlook & Opportunities |
|
Active Packaging Market Size, Share, and Growth
Asia Pacific is the fastest-growing active packaging market due to the rapid expansion of the food processing industry, rising demand for packaged and convenience foods, and increasing adoption of advanced packaging technologies to extend shelf life and ensure food safety.
Tobias Grasso, SEE's President of the Americas Region, said, “SEE is proud to bring to market the first compostable packaging tray designed to run on existing processor production lines, The CRYOVAC brand compostable overwrap tray is a breakthrough innovation that is better for the environment than traditional trays and helps our customers meet their sustainability goals.”
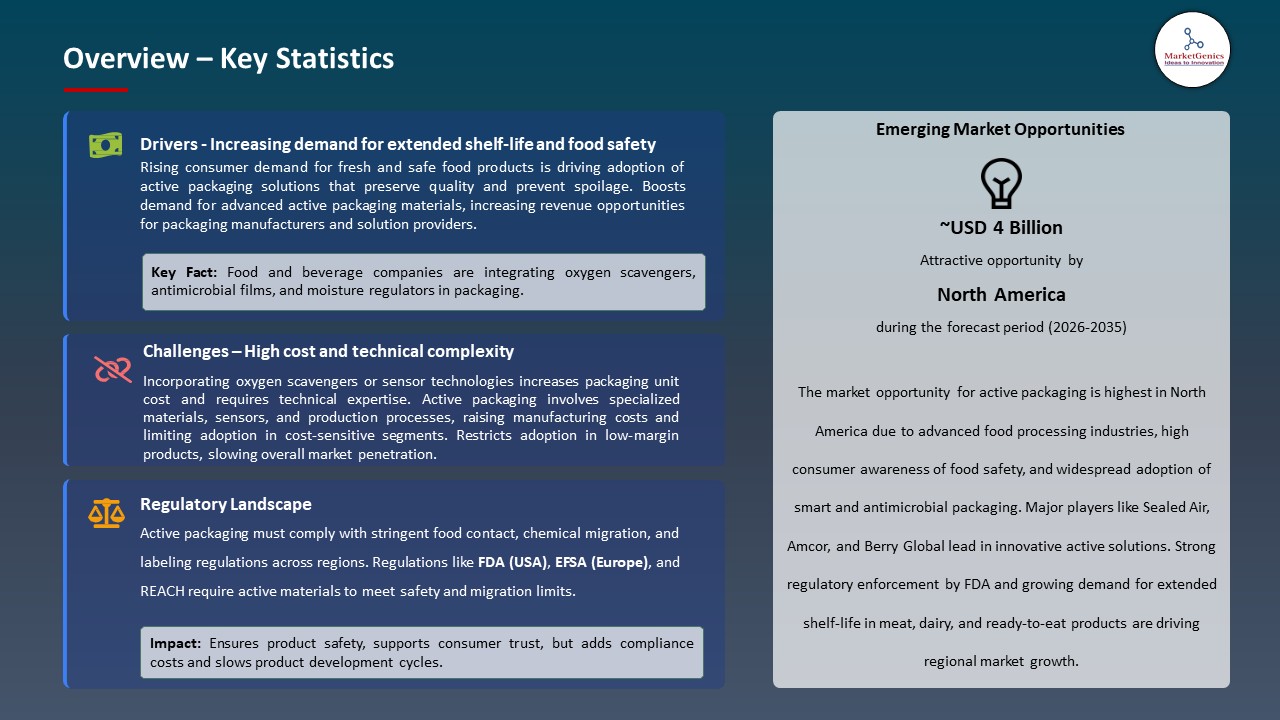
The need to have a long shelf life, food safety and maintain quality of packaged food and beverage products is highly propelling the use of active packaging technologies. To lower the spoilage and preserve the freshness of food during distribution and storage, food manufacturers are introducing more oxygen scavengers, moisture regulating, and antimicrobial packaging elements.
Increasing the consumption of ready-to-eat food, fresh products, and packaged meats are also positively influencing the application of intelligent packaging systems that actively monitor the internal package environments. Moreover, stringent food safety laws and initiatives to curb food waste through supply chains are driving active packaging material and systems innovations.
Large packaging companies are investing in high technologies to facilitate these changing requirements. As an example, Amcor plc in February 2025 launched a series of powerful moisture-controlling active packaging solutions to increase the shelf life of fresh food stuffs.
Adjacent opportunities to the active packaging market include intelligent packaging technologies, modified atmosphere packaging (MAP), sustainable packaging materials, cold chain packaging solutions, and food freshness monitoring sensors. These sectors support advanced preservation, real-time product monitoring, and waste reduction across food, pharmaceutical, and logistics industries.
 Active Packaging Market Dynamics and Trends
Driver: Growing Demand for Food Waste Reduction and Sustainable Packaging Solutions
-
Active packaging technologies are being adopted largely because of increasing global concerns on food waste. Food producers and retailers are embracing use of oxygen absorbers, ethylene scavengers as well as antimicrobial package systems that reduce the degradation of products and the loss of food freshness during storage and transportation.
- Increasing regulatory pressure and sustainability responsiveness experienced in the entire food industry is also promoting the adoption of innovative packaging solutions that prolong shelf life and reduce spoilage of products along the supply chain.
- In January 2024 SEE (Sealed Air) launched the CRYOVAC compostable protein packaging tray which is a 54% bio-based resin comprising of renewable wood cellulose.
- Increasing interest in food waste management and sustainable packaging is driving the uptake of innovative active packaging initiatives worldwide in food supply chains.
Restraint: High Technology Costs and Complex Regulatory Approval Processes Limiting Adoption
-
Active packaging technology makes use of specialized materials including oxygen scavengers, antimicrobial agents, and moisture-absorbing materials which are very expensive to manufacture and make packaging. These new materials tend to necessitate an adjustment in either the traditional packaging system or production, thus, would be costlier to adopt than traditional packaging solutions, especially to small and medium-sized food processors.
- Besides this, active packaging solutions which react with the food should meet rigid regulatory requirements pertaining to food safety, chemical migration criteria and product-material compatibility. The long product development process, certification and regulatory approvals can consume time during product development and commercialization, reducing the ability to introduce advanced active packaging technologies quickly in the market.
- High costs of production and the extreme stringency of regulatory approvals remain barriers that have acted as slowing factors to the mainstream adoption of high-technology in active packaging technologies.
Opportunity: Rapid Expansion of Pharmaceutical and Healthcare Packaging Creating Growth Opportunities
-
The active packaging is finding good prospects in the rapidly expanding pharmaceutical production and distribution of health care products worldwide. Drying agents, oxygen scavengers, and moisture absorbers are becoming more popular as tools to ensure that sensitive medicines, biologics and diagnostic products are not exposed to the environment.
- Rising temperature sensitive drugs, vaccines and long-distance pharmaceutical distribution are also driving pharmaceutical industry towards adopting more advanced active packaging methods that will keep the product stable, legal as also offer longer shelf life during storage and transportation.
- In November 2025, ACG introduced DryPod, a cold-form laminate pharmaceutical blister packaging made of desiccants to preserve extremely moisture-sensitive drug molecules.
- The growth of pharmaceutical supply chain and pressure to ensure stability of drugs is speeding up the use of active packaging technology in healthcare sector that is state of art.
Key Trend: Integration of Smart Sensors and Intelligent Materials Transforming Active Packaging Systems
-
The developments in sensor-related technologies and smart materials are also changing the functioning of actively-operating packaging systems. The smart packaging can currently track the temperature, humidity, oxygen concentration, and freshness of the products in real time, thereby assisting manufacturers to maintain good and safe quality of the products they supply across the channels.
- These innovations are being more and more combined with digital tracking and IoT-enabled processes to allow more visibility of the supply chain, more comprehensive monitoring of products, and less spoilage in food, pharmaceutical, and healthcare packaging solutions.
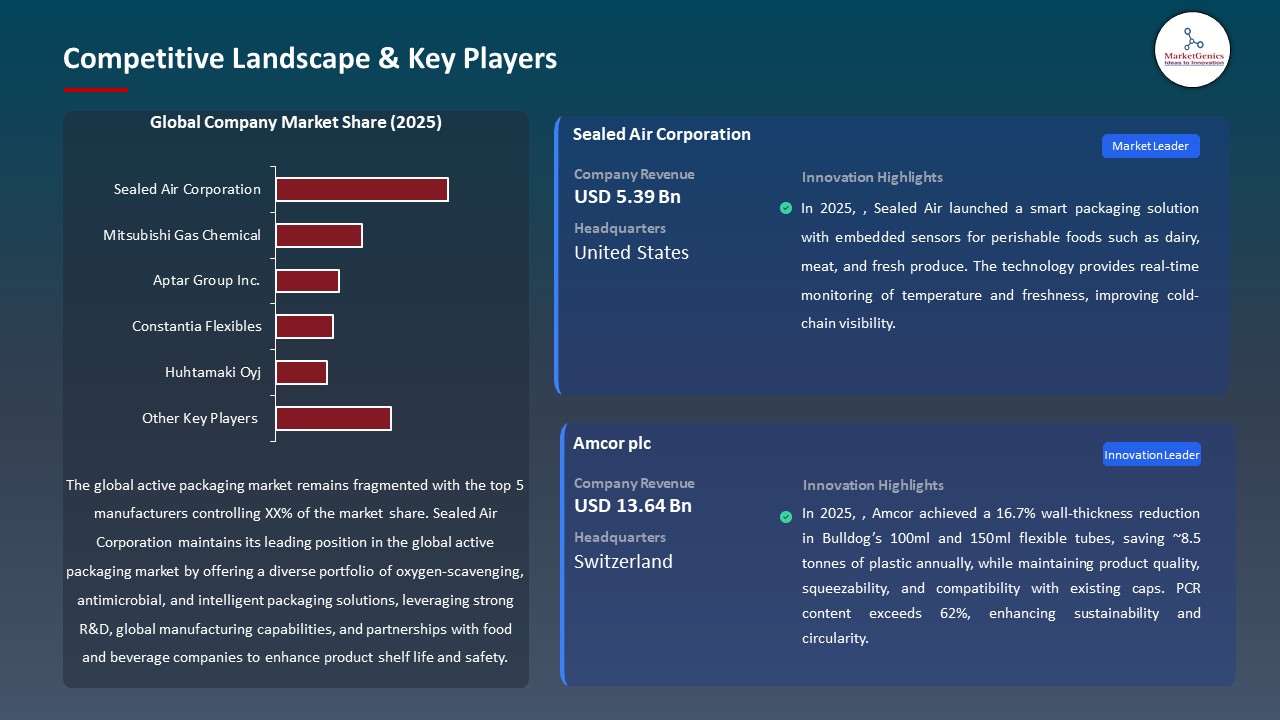
- In November 2025, Sealed Air introduced a smart packaging device with embedded sensors in perishable materials i.e. dairy, meat and fresh produce. The technology is capable of real time tracking of the temperature and freshness which enhances cold-chain visibility.
- The incorporation of smart sensors and smart materials is hastening development of active packaging to become data-centered systems to increase the safety of products, transparency in supply chain, and prevent spoilage.
 Active-Packaging-Market Analysis and Segmental Data
Oxygen Scavenging Systems Dominate Global Active Packaging Market
-
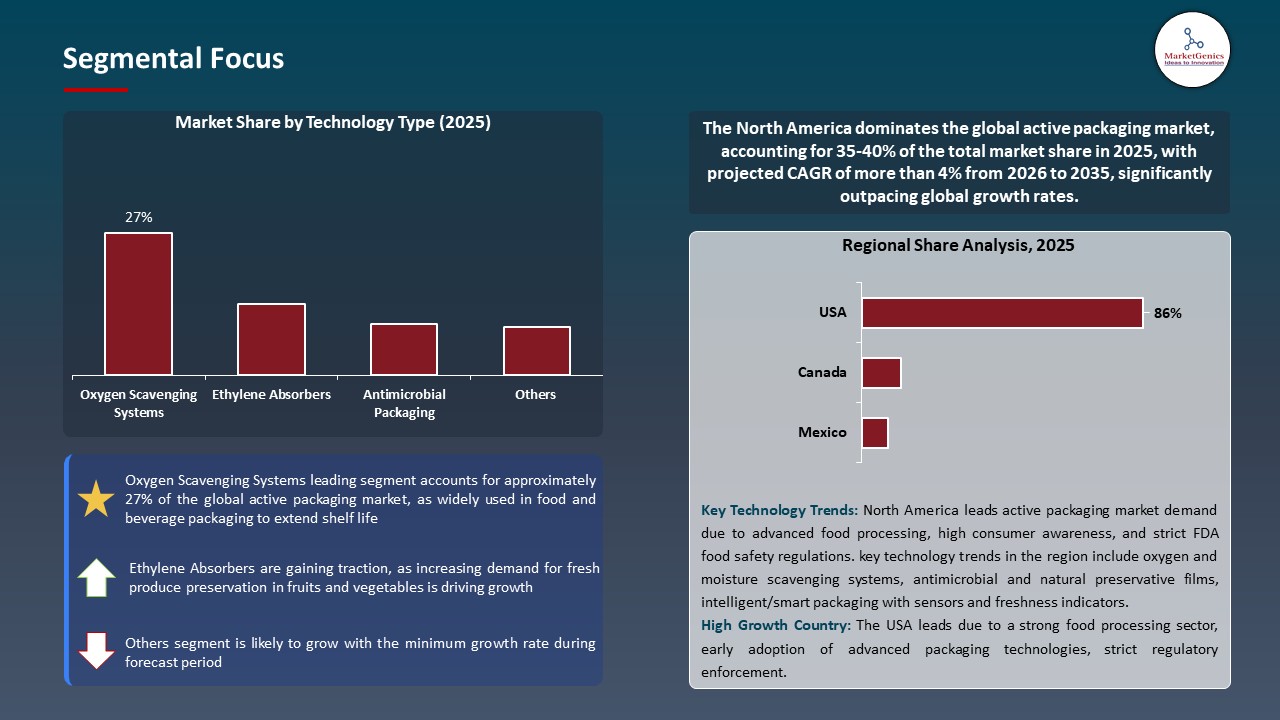
The oxygen scavenging systems segment dominates the active packaging market globally and comprises the highest amount of share, as it is an important element in enhancing the shelf life and quality of products. The systems have proven to be effective eliminating residual oxygen in packaging deterring oxidation and food spoilage in beverages, drugs and other products that are affected by oxygen.
- Increased consumer demand on fresh, high quality, and minimally processed foods has led to increased usage of oxygen scavengers especially in packaged foods, including baked goods, snacks, meat, and ready-to-eat foods. These systems are being incorporated in flexible films, trays, and bottles by the manufacturers to ensure the integrity of products during storage and transport.
- Oxygen scavenging systems are pushing the market of active packaging as it guarantees a longer shelf life, product freshness and less spoilage in industries.
North America Leads Global Active Packaging Market Demand
-
North America dominates the global active packaging market due to the region’s highly developed food, pharmaceutical, and healthcare industries, where demand for extended shelf life, product safety, and regulatory compliance is paramount. The presence of advanced cold chain infrastructure, strong e-commerce penetration, and consumer preference for fresh, high-quality products further fuels adoption of active packaging solutions such as oxygen scavengers, moisture absorbers, and antimicrobial systems.
- Major market participants are undertaking an active innovation in the region, where solutions aimed at improving product stability, sustainability and operational efficiency have been introduced. Strict food safety laws, growing interest in minimizing food waste, and investment in smart packaging solutions also make North America an important center in the further development of active packaging on the international market.
- The well-developed infrastructure and regulatory conditions in North America are factors that help fasten the use of new active packaging solutions and leverage the leading position in the market.
Active-Packaging-Market Ecosystem
The global active packaging market is moderately consolidated, with key players including Sealed Air Corporation, Mitsubishi Gas Chemical, Aptar Group Inc., Constantia Flexibles, and Huhtamaki Oyj. These firms have competitive advantage due to diversification in their packaging solutions, active and intelligent packaging technologies, global manufacturing and presence of powerful distribution channels. Their role is also supported by the long-term investment on R&D, sustainable and friendly materials, sensor incorporated systems as well as strategic alliances in the food, pharmaceutical and health industries.
Active packaging value chain includes sourcing of raw materials, creation of oxygen scavengers, moisture absorbers, antimicrobial coating, formulation and customization, quality control, regulatory, and global distribution. The post-production process, such as shelf-life and performance testing, and supply chain-monitoring, facilitates reliability, safety and trust of the products to end-uses in food, pharmaceutical and perishable products.
Entry barriers are also high due to the requirement of high technology, compliance with strict regulations, special production line and formed agreements with international manufacturers. Constant development of intelligent packaging, bio-based materials, and functional barrier systems continues the differentiation and promotes the expansion of the market all over the globe.
 Recent Development and Strategic Overview:
-
In June 2025, Amcor achieved a 16.7% wall-thickness reduction in Bulldog’s 100ml and 150ml flexible tubes, saving ~8.5 tonnes of plastic annually, while maintaining product quality, squeezability, and compatibility with existing caps. PCR content exceeds 62%, enhancing sustainability and circularity.
- In August 2024, Aptar Food Protection introduced the SeaWell system, using Drip-Lock absorbent pockets to trap excess liquids, reduce microbial growth, and maintain seafood freshness and appearance. Adopted by U.S. retailers and home delivery services, it improves handling and consumer experience for filets, shellfish, and meal kits.
Report Scope
|
Detail |
|
|
Market Size in 2025 |
USD 16.3 Bn |
|
Market Forecast Value in 2035 |
USD 27.6 Bn |
|
Growth Rate (CAGR) |
5.4% |
|
Forecast Period |
2026 – 2035 |
|
Historical Data Available for |
2021 – 2024 |
|
Market Size Units |
US$ Billion for Value |
|
Report Format |
Electronic (PDF) + Excel |
|
North America |
Europe |
Asia Pacific |
Middle East |
Africa |
South America |
|
|
|
|
|
|
|
Companies Covered |
|||||
|
|
|
|
|
|
Active-Packaging-Market Segmentation and Highlights
|
Segment |
Sub-segment |
|
Active Packaging Market, By Technology Type |
|
|
Active Packaging Market, By Material Type |
|
|
Active Packaging Market, By Packaging Format |
|
|
Active Packaging Market, By Capacity |
|
|
Active Packaging Market, By Product Shelf-Life Extension |
|
|
Active Packaging Market, By Distribution Channel |
|
|
Active Packaging Market, By End-Use Industry |
|
Frequently Asked Questions
Table of Contents
- 1. Research Methodology and Assumptions
- 1.1. Definitions
- 1.2. Research Design and Approach
- 1.3. Data Collection Methods
- 1.4. Base Estimates and Calculations
- 1.5. Forecasting Models
- 1.5.1. Key Forecast Factors & Impact Analysis
- 1.6. Secondary Research
- 1.6.1. Open Sources
- 1.6.2. Paid Databases
- 1.6.3. Associations
- 1.7. Primary Research
- 1.7.1. Primary Sources
- 1.7.2. Primary Interviews with Stakeholders across Ecosystem
- 2. Executive Summary
- 2.1. Global Active Packaging Market Outlook
- 2.1.1. Active Packaging Market Size Value (US$ Bn), and Forecasts, 2021-2035
- 2.1.2. Compounded Annual Growth Rate Analysis
- 2.1.3. Growth Opportunity Analysis
- 2.1.4. Segmental Share Analysis
- 2.1.5. Geographical Share Analysis
- 2.2. Market Analysis and Facts
- 2.3. Supply-Demand Analysis
- 2.4. Competitive Benchmarking
- 2.5. Go-to- Market Strategy
- 2.5.1. Customer/ End-use Industry Assessment
- 2.5.2. Growth Opportunity Data, 2026-2035
- 2.5.2.1. Regional Data
- 2.5.2.2. Country Data
- 2.5.2.3. Segmental Data
- 2.5.3. Identification of Potential Market Spaces
- 2.5.4. GAP Analysis
- 2.5.5. Potential Attractive Price Points
- 2.5.6. Prevailing Market Risks & Challenges
- 2.5.7. Preferred Sales & Marketing Strategies
- 2.5.8. Key Recommendations and Analysis
- 2.5.9. A Way Forward
- 2.1. Global Active Packaging Market Outlook
- 3. Industry Data and Premium Insights
- 3.1. Global Packaging Industry Overview, 2025
- 3.1.1. Packaging Industry Ecosystem Analysis
- 3.1.2. Key Trends for Packaging Industry
- 3.1.3. Regional Distribution for Packaging Industry
- 3.2. Supplier Customer Data
- 3.3. Technology Roadmap and Developments
- 3.1. Global Packaging Industry Overview, 2025
- 4. Market Overview
- 4.1. Market Dynamics
- 4.1.1. Drivers
- 4.1.1.1. Increasing demand for longer shelf life in food and beverage products.
- 4.1.1.2. Growing adoption of smart and functional packaging in pharmaceuticals.
- 4.1.1.3. Rising need for food safety, freshness monitoring, and quality preservation.
- 4.1.2. Restraints
- 4.1.2.1. High cost of active packaging materials and technologies.
- 4.1.2.2. Regulatory complexity related to food-contact and safety standards.
- 4.1.1. Drivers
- 4.2. Key Trend Analysis
- 4.3. Regulatory Framework
- 4.3.1. Key Regulations, Norms, and Subsidies, by Key Countries
- 4.3.2. Tariffs and Standards
- 4.3.3. Impact Analysis of Regulations on the Market
- 4.4. Value Chain Analysis/ Ecosystem Analysis
- 4.5. Porter’s Five Forces Analysis
- 4.6. PESTEL Analysis
- 4.7. Global Active Packaging Market Demand
- 4.7.1. Historical Market Size – Value (US$ Bn), 2020-2024
- 4.7.2. Current and Future Market Size - Value (US$ Bn), 2026–2035
- 4.7.2.1. Y-o-Y Growth Trends
- 4.7.2.2. Absolute $ Opportunity Assessment
- 4.1. Market Dynamics
- 5. Competition Landscape
- 5.1. Competition structure
- 5.1.1. Fragmented v/s consolidated
- 5.2. Company Share Analysis, 2025
- 5.2.1. Global Company Market Share
- 5.2.2. By Region
- 5.2.2.1. North America
- 5.2.2.2. Europe
- 5.2.2.3. Asia Pacific
- 5.2.2.4. Middle East
- 5.2.2.5. Africa
- 5.2.2.6. South America
- 5.3. Product Comparison Matrix
- 5.3.1. Specifications
- 5.3.2. Market Positioning
- 5.3.3. Pricing
- 5.1. Competition structure
- 6. Global Active Packaging Market Analysis, by Technology Type
- 6.1. Key Segment Analysis
- 6.2. Active Packaging Market Size Value (US$ Bn), Analysis, and Forecasts, by Technology Type, 2021-2035
- 6.2.1. Oxygen Scavenging Systems
- 6.2.1.1. Iron-based oxygen scavengers
- 6.2.1.2. Enzyme-based systems
- 6.2.1.3. Organic compound-based scavengers
- 6.2.1.4. Photocatalytic systems
- 6.2.1.5. Others
- 6.2.2. Ethylene Absorbers
- 6.2.2.1. Potassium permanganate-based
- 6.2.2.2. Zeolite-based systems
- 6.2.2.3. Polymer-based absorbers
- 6.2.2.4. Others
- 6.2.3. Antimicrobial Packaging
- 6.2.3.1. Silver ion technology
- 6.2.3.2. Copper-based systems
- 6.2.3.3. Natural antimicrobial agents
- 6.2.3.4. Bioactive coatings
- 6.2.3.5. Others
- 6.2.4. Temperature Management Systems
- 6.2.4.1. Phase change materials
- 6.2.4.2. Thermal regulating polymers
- 6.2.4.3. Insulating foam systems
- 6.2.4.4. Others
- 6.2.5. Moisture Control Systems
- 6.2.5.1. Desiccant packets
- 6.2.5.2. Absorbing polymers
- 6.2.5.3. Silica gel systems
- 6.2.5.4. Others
- 6.2.6. Carbon Dioxide Emitters/Absorbers
- 6.2.6.1. CO2 generating systems
- 6.2.6.2. CO2 absorbing materials
- 6.2.7. Flavor & Aroma Release Systems
- 6.2.7.1. Microencapsulation technology
- 6.2.7.2. Controlled release polymers
- 6.2.7.3. Others
- 6.2.1. Oxygen Scavenging Systems
- 7. Global Active Packaging Market Analysis, by Material Type
- 7.1. Key Segment Analysis
- 7.2. Active Packaging Market Size Value (US$ Bn), Analysis, and Forecasts, by Material Type, 2021-2035
- 7.2.1. Plastics (Polymers)
- 7.2.2. Paper & Cardboard
- 7.2.3. Metals
- 7.2.4. Glass
- 7.2.5. Composite Materials
- 8. Global Active Packaging Market Analysis, by Packaging Format
- 8.1. Key Segment Analysis
- 8.2. Active Packaging Market Size Value (US$ Bn), Analysis, and Forecasts, by Packaging Format, 2021-2035
- 8.2.1. Films & Wraps
- 8.2.1.1. Flexible films
- 8.2.1.2. Rigid films
- 8.2.1.3. Coated membranes
- 8.2.1.4. Others
- 8.2.2. Containers
- 8.2.2.1. Rigid boxes
- 8.2.2.2. Flexible pouches
- 8.2.2.3. Stand-up pouches
- 8.2.2.4. Others
- 8.2.3. Closures & Caps
- 8.2.3.1. Bottle caps
- 8.2.3.2. Protective seals
- 8.2.3.3. Tamper-evident closures
- 8.2.3.4. Others
- 8.2.4. Labels & Inserts
- 8.2.4.1. Functional labels
- 8.2.4.2. Absorbent pads
- 8.2.4.3. Sachets & packets
- 8.2.4.4. Others
- 8.2.5. Trays & Clamshells
- 8.2.5.1. Thermoformed trays
- 8.2.5.2. Blister packs
- 8.2.5.3. Modified atmosphere trays
- 8.2.5.4. Others
- 8.2.1. Films & Wraps
- 9. Global Active Packaging Market Analysis, by Capacity
- 9.1. Key Segment Analysis
- 9.2. Active Packaging Market Size Value (US$ Bn), Analysis, and Forecasts, by Capacity, 2021-2035
- 9.2.1. Less than 50g/ml
- 9.2.2. 50g/ml - 500g/ml
- 9.2.3. 500g/ml - 2kg/L
- 9.2.4. 2kg/L - 10kg/L
- 9.2.5. Above 10kg/L
- 10. Global Active Packaging Market Analysis, by Product Shelf-Life Extension
- 10.1. Key Segment Analysis
- 10.2. Active Packaging Market Size Value (US$ Bn), Analysis, and Forecasts, by Product Shelf-Life Extension, 2021-2035
- 10.2.1. Up to 30 days
- 10.2.2. 30-90 days
- 10.2.3. 90-365 days
- 10.2.4. More than 365 days
- 11. Global Active Packaging Market Analysis and Forecasts, by Distribution Channel
- 11.1. Key Findings
- 11.2. Active Packaging Market Size Value (US$ Bn), Analysis, and Forecasts, by Distribution Channel, 2021-2035
- 11.2.1. Direct Sales (B2B)
- 11.2.2. Distribution Networks
- 11.2.3. E-commerce Platforms
- 11.2.4. Retail Channels
- 12. Global Active Packaging Market Analysis and Forecasts, by End-Use Industry
- 12.1. Key Findings
- 12.2. Active Packaging Market Size Value (US$ Bn), Analysis, and Forecasts, by End-Use Industry, 2021-2035
- 12.2.1. Food & Beverage
- 12.2.2. Pharmaceutical
- 12.2.3. Personal Care & Cosmetics
- 12.2.4. Agrochemical
- 12.2.5. Electronics & Components
- 12.2.6. Chemical & Specialty Chemicals Products
- 12.2.7. Industrial Products
- 12.2.8. Healthcare/Medical Devices
- 12.2.9. Others
- 13. Global Active Packaging Market Analysis and Forecasts, by Region
- 13.1. Key Findings
- 13.2. Active Packaging Market Size Value (US$ Bn), Analysis, and Forecasts, by Region, 2021-2035
- 13.2.1. North America
- 13.2.2. Europe
- 13.2.3. Asia Pacific
- 13.2.4. Middle East
- 13.2.5. Africa
- 13.2.6. South America
- 14. North America Active Packaging Market Analysis
- 14.1. Key Segment Analysis
- 14.2. Regional Snapshot
- 14.3. North America Active Packaging Market Size- Value (US$ Bn), Analysis, and Forecasts, 2021-2035
- 14.3.1. Technology Type
- 14.3.2. Material Type
- 14.3.3. Packaging Format
- 14.3.4. Capacity
- 14.3.5. Product Shelf-Life Extension
- 14.3.6. Distribution Channel
- 14.3.7. End-Use Industry
- 14.3.8. Country
- 14.3.8.1. USA
- 14.3.8.2. Canada
- 14.3.8.3. Mexico
- 14.4. USA Active Packaging Market
- 14.4.1. Country Segmental Analysis
- 14.4.2. Technology Type
- 14.4.3. Material Type
- 14.4.4. Packaging Format
- 14.4.5. Capacity
- 14.4.6. Product Shelf-Life Extension
- 14.4.7. Distribution Channel
- 14.4.8. End-Use Industry
- 14.5. Canada Active Packaging Market
- 14.5.1. Country Segmental Analysis
- 14.5.2. Technology Type
- 14.5.3. Material Type
- 14.5.4. Packaging Format
- 14.5.5. Capacity
- 14.5.6. Product Shelf-Life Extension
- 14.5.7. Distribution Channel
- 14.5.8. End-Use Industry
- 14.6. Mexico Active Packaging Market
- 14.6.1. Country Segmental Analysis
- 14.6.2. Technology Type
- 14.6.3. Material Type
- 14.6.4. Packaging Format
- 14.6.5. Capacity
- 14.6.6. Product Shelf-Life Extension
- 14.6.7. Distribution Channel
- 14.6.8. End-Use Industry
- 15. Europe Active Packaging Market Analysis
- 15.1. Key Segment Analysis
- 15.2. Regional Snapshot
- 15.3. Europe Active Packaging Market Size Value (US$ Bn), Analysis, and Forecasts, 2021-2035
- 15.3.1. Technology Type
- 15.3.2. Material Type
- 15.3.3. Packaging Format
- 15.3.4. Capacity
- 15.3.5. Product Shelf-Life Extension
- 15.3.6. Distribution Channel
- 15.3.7. End-Use Industry
- 15.3.8. Country
- 15.3.8.1. Germany
- 15.3.8.2. United Kingdom
- 15.3.8.3. France
- 15.3.8.4. Italy
- 15.3.8.5. Spain
- 15.3.8.6. Netherlands
- 15.3.8.7. Nordic Countries
- 15.3.8.8. Poland
- 15.3.8.9. Russia & CIS
- 15.3.8.10. Rest of Europe
- 15.4. Germany Active Packaging Market
- 15.4.1. Country Segmental Analysis
- 15.4.2. Technology Type
- 15.4.3. Material Type
- 15.4.4. Packaging Format
- 15.4.5. Capacity
- 15.4.6. Product Shelf-Life Extension
- 15.4.7. Distribution Channel
- 15.4.8. End-Use Industry
- 15.5. United Kingdom Active Packaging Market
- 15.5.1. Country Segmental Analysis
- 15.5.2. Technology Type
- 15.5.3. Material Type
- 15.5.4. Packaging Format
- 15.5.5. Capacity
- 15.5.6. Product Shelf-Life Extension
- 15.5.7. Distribution Channel
- 15.5.8. End-Use Industry
- 15.6. France Active Packaging Market
- 15.6.1. Country Segmental Analysis
- 15.6.2. Technology Type
- 15.6.3. Material Type
- 15.6.4. Packaging Format
- 15.6.5. Capacity
- 15.6.6. Product Shelf-Life Extension
- 15.6.7. Distribution Channel
- 15.6.8. End-Use Industry
- 15.7. Italy Active Packaging Market
- 15.7.1. Country Segmental Analysis
- 15.7.2. Technology Type
- 15.7.3. Material Type
- 15.7.4. Packaging Format
- 15.7.5. Capacity
- 15.7.6. Product Shelf-Life Extension
- 15.7.7. Distribution Channel
- 15.7.8. End-Use Industry
- 15.8. Spain Active Packaging Market
- 15.8.1. Country Segmental Analysis
- 15.8.2. Technology Type
- 15.8.3. Material Type
- 15.8.4. Packaging Format
- 15.8.5. Capacity
- 15.8.6. Product Shelf-Life Extension
- 15.8.7. Distribution Channel
- 15.8.8. End-Use Industry
- 15.9. Netherlands Active Packaging Market
- 15.9.1. Country Segmental Analysis
- 15.9.2. Technology Type
- 15.9.3. Material Type
- 15.9.4. Packaging Format
- 15.9.5. Capacity
- 15.9.6. Product Shelf-Life Extension
- 15.9.7. Distribution Channel
- 15.9.8. End-Use Industry
- 15.10. Nordic Countries Active Packaging Market
- 15.10.1. Country Segmental Analysis
- 15.10.2. Technology Type
- 15.10.3. Material Type
- 15.10.4. Packaging Format
- 15.10.5. Capacity
- 15.10.6. Product Shelf-Life Extension
- 15.10.7. Distribution Channel
- 15.10.8. End-Use Industry
- 15.11. Poland Active Packaging Market
- 15.11.1. Country Segmental Analysis
- 15.11.2. Technology Type
- 15.11.3. Material Type
- 15.11.4. Packaging Format
- 15.11.5. Capacity
- 15.11.6. Product Shelf-Life Extension
- 15.11.7. Distribution Channel
- 15.11.8. End-Use Industry
- 15.12. Russia & CIS Active Packaging Market
- 15.12.1. Country Segmental Analysis
- 15.12.2. Technology Type
- 15.12.3. Material Type
- 15.12.4. Packaging Format
- 15.12.5. Capacity
- 15.12.6. Product Shelf-Life Extension
- 15.12.7. Distribution Channel
- 15.12.8. End-Use Industry
- 15.13. Rest of Europe Active Packaging Market
- 15.13.1. Country Segmental Analysis
- 15.13.2. Technology Type
- 15.13.3. Material Type
- 15.13.4. Packaging Format
- 15.13.5. Capacity
- 15.13.6. Product Shelf-Life Extension
- 15.13.7. Distribution Channel
- 15.13.8. End-Use Industry
- 16. Asia Pacific Active Packaging Market Analysis
- 16.1. Key Segment Analysis
- 16.2. Regional Snapshot
- 16.3. Asia Pacific Active Packaging Market Size Value (US$ Bn), Analysis, and Forecasts, 2021-2035
- 16.3.1. Technology Type
- 16.3.2. Material Type
- 16.3.3. Packaging Format
- 16.3.4. Capacity
- 16.3.5. Product Shelf-Life Extension
- 16.3.6. Distribution Channel
- 16.3.7. End-Use Industry
- 16.3.8. Country
- 16.3.8.1. China
- 16.3.8.2. India
- 16.3.8.3. Japan
- 16.3.8.4. South Korea
- 16.3.8.5. Australia and New Zealand
- 16.3.8.6. Indonesia
- 16.3.8.7. Malaysia
- 16.3.8.8. Thailand
- 16.3.8.9. Vietnam
- 16.3.8.10. Rest of Asia Pacific
- 16.4. China Active Packaging Market
- 16.4.1. Country Segmental Analysis
- 16.4.2. Technology Type
- 16.4.3. Material Type
- 16.4.4. Packaging Format
- 16.4.5. Capacity
- 16.4.6. Product Shelf-Life Extension
- 16.4.7. Distribution Channel
- 16.4.8. End-Use Industry
- 16.5. India Active Packaging Market
- 16.5.1. Country Segmental Analysis
- 16.5.2. Technology Type
- 16.5.3. Material Type
- 16.5.4. Packaging Format
- 16.5.5. Capacity
- 16.5.6. Product Shelf-Life Extension
- 16.5.7. Distribution Channel
- 16.5.8. End-Use Industry
- 16.6. Japan Active Packaging Market
- 16.6.1. Country Segmental Analysis
- 16.6.2. Technology Type
- 16.6.3. Material Type
- 16.6.4. Packaging Format
- 16.6.5. Capacity
- 16.6.6. Product Shelf-Life Extension
- 16.6.7. Distribution Channel
- 16.6.8. End-Use Industry
- 16.7. South Korea Active Packaging Market
- 16.7.1. Country Segmental Analysis
- 16.7.2. Technology Type
- 16.7.3. Material Type
- 16.7.4. Packaging Format
- 16.7.5. Capacity
- 16.7.6. Product Shelf-Life Extension
- 16.7.7. Distribution Channel
- 16.7.8. End-Use Industry
- 16.8. Australia and New Zealand Active Packaging Market
- 16.8.1. Country Segmental Analysis
- 16.8.2. Technology Type
- 16.8.3. Material Type
- 16.8.4. Packaging Format
- 16.8.5. Capacity
- 16.8.6. Product Shelf-Life Extension
- 16.8.7. Distribution Channel
- 16.8.8. End-Use Industry
- 16.9. Indonesia Active Packaging Market
- 16.9.1. Country Segmental Analysis
- 16.9.2. Technology Type
- 16.9.3. Material Type
- 16.9.4. Packaging Format
- 16.9.5. Capacity
- 16.9.6. Product Shelf-Life Extension
- 16.9.7. Distribution Channel
- 16.9.8. End-Use Industry
- 16.10. Malaysia Active Packaging Market
- 16.10.1. Country Segmental Analysis
- 16.10.2. Technology Type
- 16.10.3. Material Type
- 16.10.4. Packaging Format
- 16.10.5. Capacity
- 16.10.6. Product Shelf-Life Extension
- 16.10.7. Distribution Channel
- 16.10.8. End-Use Industry
- 16.11. Thailand Active Packaging Market
- 16.11.1. Country Segmental Analysis
- 16.11.2. Technology Type
- 16.11.3. Material Type
- 16.11.4. Packaging Format
- 16.11.5. Capacity
- 16.11.6. Product Shelf-Life Extension
- 16.11.7. Distribution Channel
- 16.11.8. End-Use Industry
- 16.12. Vietnam Active Packaging Market
- 16.12.1. Country Segmental Analysis
- 16.12.2. Technology Type
- 16.12.3. Material Type
- 16.12.4. Packaging Format
- 16.12.5. Capacity
- 16.12.6. Product Shelf-Life Extension
- 16.12.7. Distribution Channel
- 16.12.8. End-Use Industry
- 16.13. Rest of Asia Pacific Active Packaging Market
- 16.13.1. Country Segmental Analysis
- 16.13.2. Technology Type
- 16.13.3. Material Type
- 16.13.4. Packaging Format
- 16.13.5. Capacity
- 16.13.6. Product Shelf-Life Extension
- 16.13.7. Distribution Channel
- 16.13.8. End-Use Industry
- 17. Middle East Active Packaging Market Analysis
- 17.1. Key Segment Analysis
- 17.2. Regional Snapshot
- 17.3. Middle East Active Packaging Market Size Value (US$ Bn), Analysis, and Forecasts, 2021-2035
- 17.3.1. Technology Type
- 17.3.2. Material Type
- 17.3.3. Packaging Format
- 17.3.4. Capacity
- 17.3.5. Product Shelf-Life Extension
- 17.3.6. Distribution Channel
- 17.3.7. End-Use Industry
- 17.3.8. Country
- 17.3.8.1. Turkey
- 17.3.8.2. UAE
- 17.3.8.3. Saudi Arabia
- 17.3.8.4. Israel
- 17.3.8.5. Rest of Middle East
- 17.4. Turkey Active Packaging Market
- 17.4.1. Country Segmental Analysis
- 17.4.2. Technology Type
- 17.4.3. Material Type
- 17.4.4. Packaging Format
- 17.4.5. Capacity
- 17.4.6. Product Shelf-Life Extension
- 17.4.7. Distribution Channel
- 17.4.8. End-Use Industry
- 17.5. UAE Active Packaging Market
- 17.5.1. Country Segmental Analysis
- 17.5.2. Technology Type
- 17.5.3. Material Type
- 17.5.4. Packaging Format
- 17.5.5. Capacity
- 17.5.6. Product Shelf-Life Extension
- 17.5.7. Distribution Channel
- 17.5.8. End-Use Industry
- 17.6. Saudi Arabia Active Packaging Market
- 17.6.1. Country Segmental Analysis
- 17.6.2. Technology Type
- 17.6.3. Material Type
- 17.6.4. Packaging Format
- 17.6.5. Capacity
- 17.6.6. Product Shelf-Life Extension
- 17.6.7. Distribution Channel
- 17.6.8. End-Use Industry
- 17.7. Israel Active Packaging Market
- 17.7.1. Country Segmental Analysis
- 17.7.2. Technology Type
- 17.7.3. Material Type
- 17.7.4. Packaging Format
- 17.7.5. Capacity
- 17.7.6. Product Shelf-Life Extension
- 17.7.7. Distribution Channel
- 17.7.8. End-Use Industry
- 17.8. Rest of Middle East Active Packaging Market
- 17.8.1. Country Segmental Analysis
- 17.8.2. Technology Type
- 17.8.3. Material Type
- 17.8.4. Packaging Format
- 17.8.5. Capacity
- 17.8.6. Product Shelf-Life Extension
- 17.8.7. Distribution Channel
- 17.8.8. End-Use Industry
- 18. Africa Active Packaging Market Analysis
- 18.1. Key Segment Analysis
- 18.2. Regional Snapshot
- 18.3. Africa Active Packaging Market Size Value (US$ Bn), Analysis, and Forecasts, 2021-2035
- 18.3.1. Technology Type
- 18.3.2. Material Type
- 18.3.3. Packaging Format
- 18.3.4. Capacity
- 18.3.5. Product Shelf-Life Extension
- 18.3.6. Distribution Channel
- 18.3.7. End-Use Industry
- 18.3.8. Country
- 18.3.8.1. South Africa
- 18.3.8.2. Egypt
- 18.3.8.3. Nigeria
- 18.3.8.4. Algeria
- 18.3.8.5. Rest of Africa
- 18.4. South Africa Active Packaging Market
- 18.4.1. Country Segmental Analysis
- 18.4.2. Technology Type
- 18.4.3. Material Type
- 18.4.4. Packaging Format
- 18.4.5. Capacity
- 18.4.6. Product Shelf-Life Extension
- 18.4.7. Distribution Channel
- 18.4.8. End-Use Industry
- 18.5. Egypt Active Packaging Market
- 18.5.1. Country Segmental Analysis
- 18.5.2. Technology Type
- 18.5.3. Material Type
- 18.5.4. Packaging Format
- 18.5.5. Capacity
- 18.5.6. Product Shelf-Life Extension
- 18.5.7. Distribution Channel
- 18.5.8. End-Use Industry
- 18.6. Nigeria Active Packaging Market
- 18.6.1. Country Segmental Analysis
- 18.6.2. Technology Type
- 18.6.3. Material Type
- 18.6.4. Packaging Format
- 18.6.5. Capacity
- 18.6.6. Product Shelf-Life Extension
- 18.6.7. Distribution Channel
- 18.6.8. End-Use Industry
- 18.7. Algeria Active Packaging Market
- 18.7.1. Country Segmental Analysis
- 18.7.2. Technology Type
- 18.7.3. Material Type
- 18.7.4. Packaging Format
- 18.7.5. Capacity
- 18.7.6. Product Shelf-Life Extension
- 18.7.7. Distribution Channel
- 18.7.8. End-Use Industry
- 18.8. Rest of Africa Active Packaging Market
- 18.8.1. Country Segmental Analysis
- 18.8.2. Technology Type
- 18.8.3. Material Type
- 18.8.4. Packaging Format
- 18.8.5. Capacity
- 18.8.6. Product Shelf-Life Extension
- 18.8.7. Distribution Channel
- 18.8.8. End-Use Industry
- 19. South America Active Packaging Market Analysis
- 19.1. Key Segment Analysis
- 19.2. Regional Snapshot
- 19.3. South America Active Packaging Market Size Value (US$ Bn), Analysis, and Forecasts, 2021-2035
- 19.3.1. Technology Type
- 19.3.2. Material Type
- 19.3.3. Packaging Format
- 19.3.4. Capacity
- 19.3.5. Product Shelf-Life Extension
- 19.3.6. Distribution Channel
- 19.3.7. End-Use Industry
- 19.3.8. Country
- 19.3.8.1. Brazil
- 19.3.8.2. Argentina
- 19.3.8.3. Rest of South America
- 19.4. Brazil Active Packaging Market
- 19.4.1. Country Segmental Analysis
- 19.4.2. Technology Type
- 19.4.3. Material Type
- 19.4.4. Packaging Format
- 19.4.5. Capacity
- 19.4.6. Product Shelf-Life Extension
- 19.4.7. Distribution Channel
- 19.4.8. End-Use Industry
- 19.5. Argentina Active Packaging Market
- 19.5.1. Country Segmental Analysis
- 19.5.2. Technology Type
- 19.5.3. Material Type
- 19.5.4. Packaging Format
- 19.5.5. Capacity
- 19.5.6. Product Shelf-Life Extension
- 19.5.7. Distribution Channel
- 19.5.8. End-Use Industry
- 19.6. Rest of South America Active Packaging Market
- 19.6.1. Country Segmental Analysis
- 19.6.2. Technology Type
- 19.6.3. Material Type
- 19.6.4. Packaging Format
- 19.6.5. Capacity
- 19.6.6. Product Shelf-Life Extension
- 19.6.7. Distribution Channel
- 19.6.8. End-Use Industry
- 20. Key Players/ Company Profile
- 20.1. Sealed Air Corporation
- 20.1.1. Company Details/ Overview
- 20.1.2. Company Financials
- 20.1.3. Key Customers and Competitors
- 20.1.4. Business/ Industry Portfolio
- 20.1.5. Product Portfolio/ Specification Details
- 20.1.6. Pricing Data
- 20.1.7. Strategic Overview
- 20.1.8. Recent Developments
- 20.2. Huhtamaki Oyj
- 20.3. Coveris Holdings
- 20.4. Cryopak Industries
- 20.5. Oxea Corporation
- 20.6. FP International
- 20.7. Mitsubishi Gas Chemical
- 20.8. Multisorb Technologies
- 20.9. Tredegar Corporation
- 20.10. Aptar Group Inc.
- 20.11. Constantia Flexibles
- 20.12. Innovia Films
- 20.13. Trinseo
- 20.14. Chevron Phillips Chemical
- 20.15. W. R. Grace & Company
- 20.16. Honeywell International
- 20.17. BASF SE
- 20.18. Dow Inc.
- 20.19. 3M Company
- 20.20. Bemis Company
- 20.21. Other Key Players
- 20.1. Sealed Air Corporation
Note* - This is just tentative list of players. While providing the report, we will cover more number of players based on their revenue and share for each geography
Research Design
Our research design integrates both demand-side and supply-side analysis through a balanced combination of primary and secondary research methodologies. By utilizing both bottom-up and top-down approaches alongside rigorous data triangulation methods, we deliver robust market intelligence that supports strategic decision-making.
MarketGenics' comprehensive research design framework ensures the delivery of accurate, reliable, and actionable market intelligence. Through the integration of multiple research approaches, rigorous validation processes, and expert analysis, we provide our clients with the insights needed to make informed strategic decisions and capitalize on market opportunities.

MarketGenics leverages a dedicated industry panel of experts and a comprehensive suite of paid databases to effectively collect, consolidate, and analyze market intelligence.
Our approach has consistently proven to be reliable and effective in generating accurate market insights, identifying key industry trends, and uncovering emerging business opportunities.
Through both primary and secondary research, we capture and analyze critical company-level data such as manufacturing footprints, including technical centers, R&D facilities, sales offices, and headquarters.
Our expert panel further enhances our ability to estimate market size for specific brands based on validated field-level intelligence.
Our data mining techniques incorporate both parametric and non-parametric methods, allowing for structured data collection, sorting, processing, and cleaning.
Demand projections are derived from large-scale data sets analyzed through proprietary algorithms, culminating in robust and reliable market sizing.
Research Approach
The bottom-up approach builds market estimates by starting with the smallest addressable market units and systematically aggregating them to create comprehensive market size projections.
This method begins with specific, granular data points and builds upward to create the complete market landscape.
Customer Analysis → Segmental Analysis → Geographical Analysis
The top-down approach starts with the broadest possible market data and systematically narrows it down through a series of filters and assumptions to arrive at specific market segments or opportunities.
This method begins with the big picture and works downward to increasingly specific market slices.
TAM → SAM → SOM


Research Methods
Desk / Secondary Research
While analysing the market, we extensively study secondary sources, directories, and databases to identify and collect information useful for this technical, market-oriented, and commercial report. Secondary sources that we utilize are not only the public sources, but it is a combination of Open Source, Associations, Paid Databases, MG Repository & Knowledgebase, and others.
- Company websites, annual reports, financial reports, broker reports, and investor presentations
- National government documents, statistical databases and reports
- News articles, press releases and web-casts specific to the companies operating in the market, Magazines, reports, and others
- We gather information from commercial data sources for deriving company specific data such as segmental revenue, share for geography, product revenue, and others
- Internal and external proprietary databases (industry-specific), relevant patent, and regulatory databases
- Governing Bodies, Government Organizations
- Relevant Authorities, Country-specific Associations for Industries
We also employ the model mapping approach to estimate the product level market data through the players' product portfolio
Primary Research
Primary research/ interviews is vital in analyzing the market. Most of the cases involves paid primary interviews. Primary sources include primary interviews through e-mail interactions, telephonic interviews, surveys as well as face-to-face interviews with the different stakeholders across the value chain including several industry experts.
| Type of Respondents | Number of Primaries |
|---|---|
| Tier 2/3 Suppliers | ~20 |
| Tier 1 Suppliers | ~25 |
| End-users | ~25 |
| Industry Expert/ Panel/ Consultant | ~30 |
| Total | ~100 |
MG Knowledgebase
• Repository of industry blog, newsletter and case studies
• Online platform covering detailed market reports, and company profiles
Forecasting Factors and Models
Forecasting Factors
- Historical Trends – Past market patterns, cycles, and major events that shaped how markets behave over time. Understanding past trends helps predict future behavior.
- Industry Factors – Specific characteristics of the industry like structure, regulations, and innovation cycles that affect market dynamics.
- Macroeconomic Factors – Economic conditions like GDP growth, inflation, and employment rates that affect how much money people have to spend.
- Demographic Factors – Population characteristics like age, income, and location that determine who can buy your product.
- Technology Factors – How quickly people adopt new technology and how much technology infrastructure exists.
- Regulatory Factors – Government rules, laws, and policies that can help or restrict market growth.
- Competitive Factors – Analyzing competition structure such as degree of competition and bargaining power of buyers and suppliers.
Forecasting Models / Techniques
Multiple Regression Analysis
- Identify and quantify factors that drive market changes
- Statistical modeling to establish relationships between market drivers and outcomes
Time Series Analysis – Seasonal Patterns
- Understand regular cyclical patterns in market demand
- Advanced statistical techniques to separate trend, seasonal, and irregular components
Time Series Analysis – Trend Analysis
- Identify underlying market growth patterns and momentum
- Statistical analysis of historical data to project future trends
Expert Opinion – Expert Interviews
- Gather deep industry insights and contextual understanding
- In-depth interviews with key industry stakeholders
Multi-Scenario Development
- Prepare for uncertainty by modeling different possible futures
- Creating optimistic, pessimistic, and most likely scenarios
Time Series Analysis – Moving Averages
- Sophisticated forecasting for complex time series data
- Auto-regressive integrated moving average models with seasonal components
Econometric Models
- Apply economic theory to market forecasting
- Sophisticated economic models that account for market interactions
Expert Opinion – Delphi Method
- Harness collective wisdom of industry experts
- Structured, multi-round expert consultation process
Monte Carlo Simulation
- Quantify uncertainty and probability distributions
- Thousands of simulations with varying input parameters
Research Analysis
Our research framework is built upon the fundamental principle of validating market intelligence from both demand and supply perspectives. This dual-sided approach ensures comprehensive market understanding and reduces the risk of single-source bias.
Demand-Side Analysis: We understand end-user/application behavior, preferences, and market needs along with the penetration of the product for specific application.
Supply-Side Analysis: We estimate overall market revenue, analyze the segmental share along with industry capacity, competitive landscape, and market structure.
Validation & Evaluation
Data triangulation is a validation technique that uses multiple methods, sources, or perspectives to examine the same research question, thereby increasing the credibility and reliability of research findings. In market research, triangulation serves as a quality assurance mechanism that helps identify and minimize bias, validate assumptions, and ensure accuracy in market estimates.
- Data Source Triangulation – Using multiple data sources to examine the same phenomenon
- Methodological Triangulation – Using multiple research methods to study the same research question
- Investigator Triangulation – Using multiple researchers or analysts to examine the same data
- Theoretical Triangulation – Using multiple theoretical perspectives to interpret the same data

Custom Market Research Services
We will customise the research for you, in case the report listed above does not meet your requirements.
Get 10% Free Customisation