Biobased Additives Market Size, Share & Trends Analysis Report by Type (Plasticizers, Antioxidants, Stabilizers, Lubricants, Surfactants, Flame Retardants, Impact Modifiers, Processing Aids, Others), Source, Form, Distribution Channel, End-use Industry, and Geography (North America, Europe, Asia Pacific, Middle East, Africa, and South America) – Global Industry Data, Trends, and Forecasts, 2026–2035
|
|
|
Segmental Data Insights |
|
|
Demand Trends |
|
|
Competitive Landscape |
|
|
Strategic Development |
|
|
Future Outlook & Opportunities |
|
Biobased Additives market Size, Share, and Growth
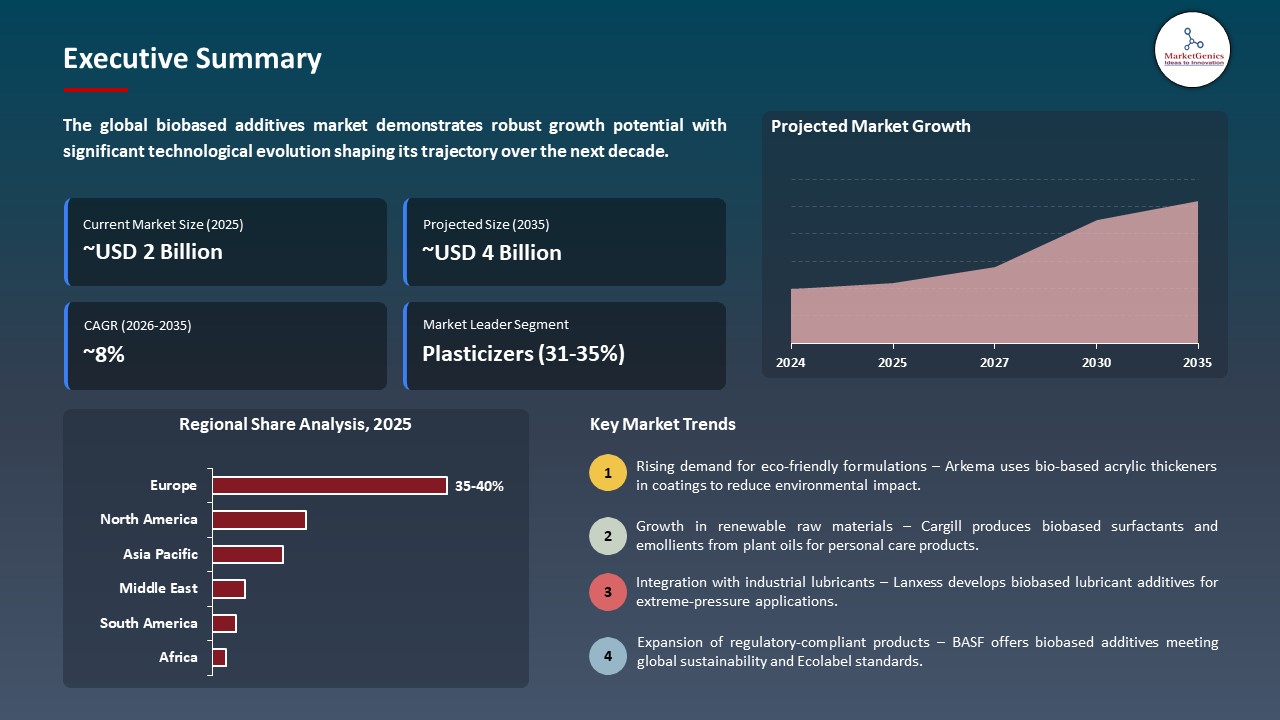
The global biobased additives market is witnessing strong growth, valued at USD 1.8 billion in 2025 and projected to reach USD 3.7 billion by 2035, expanding at a CAGR of 7.6% during the forecast period. Innovation in renewable feedstock engineering, green chemistry synthesis, and process intensifying technologies are driving the global biobased additives market where industries are boosting biodegradability, chemical stability and performance across any application in packaging, coatings, automotive and consumer goods.
Hélène Pernot, Global Sustainability Marketing Director at Coating Solutions, emphasized that the textile value chain is responsible for 6 to 8% of worldwide emissions, and with growing demand, there is a critical need to transform and reduce the sector’s carbon footprint. She highlighted that bio-based solutions pave the way for the next generation of more sustainable textile products, helping customers achieve their sustainability and carbon reduction goals.
The global biobased additives market is experiencing a strong growth with industries shifting more towards renewable, low-carbon and regulation-friendly material feedstocks, both in the packaging, automotive, construction, agricultural and consumer products markets. New bio-based plasticizers, natural fiber coupling agents, lignin-based stabilizers, and fermentation-based dispersants are adding to the mechanical strength, thermal stability and efficiency of the process as well as decreasing reliance on petrochemical feedstocks.
Enhanced diversification of products is emerging faster with the development of integrated biorefinery framework and precision fermentation technologies which are enhancing the efficiency in yield optimization, feedstock utilization, as well as functional customization. The digital traceability systems and the lifecycle carbon assessment tools are enhancing the transparency of the supply chain based on which the manufacturers are able to align with the changing sustainability standards and corporate net-zero goals without compromising the performance consistency in large-scale manufacturing industries.
The adjacent opportunities in compostable polymer systems, bio enhanced performance coating and renewable impact modifiers that is enhancing the appeal of the market. Biobased Additives are becoming strategic position formative to support a combination of sustainability and durability and cost-effectiveness, circular flow of materials, regulatory compatibility, and long-term value generation through global manufacturing systems.
 Biobased Additives market Dynamics and Trends
Driver: Growing demand for sustainable and regulatory-compliant additives
-
An increasing global environmental control of the VOCs, hazardous substances and non-biodegradable materials is fuelling the shift to renewable, low-carbon biobased additives to the key industrial sectors.
- Commercialization of compliant solutions is increased due to increasing sustainability requirements and regulatory demands; For instance, in October 2024, expansion of the ENCOR bio-based dispersant line of waterborne coatings by Arkema, to be used with low-VOC and APEO-free formulations, to comply with both EU REACH and U.S. EPA requirements and reduce fossil carbon reliance.
- The net-zero trend and worldwide regulations are reinforcing the demand of renewable biobased compliant additives in the long term.
Restraint: Higher production costs and feedstock volatility
-
The use of agricultural and bio-based feedstocks like plant and lignin oils, and fermentation-derived intermediates, biobased additives producers are vulnerable to seasonal fluctuations, climate shocks and fluctuations in commodity prices, not to mention uneven costs of raw materials and margin pressure.
- The cost of processing on a large scale, downstream purification, and a certification of sustainability compliance are very expensive in operation, and the economies of scale present in petrochemical incumbents are unlikely to be as favorable in performance-grade formulations.
- The variability of feedstock and biomass competition constrain stability of pricing and expansion of capacity in a global scale.
Opportunity: Expansion into high-growth industrial and performance segments
-
The high-growth products of biobased additives into high-performance products like advanced composites, specialty construction chemicals, and high-barrier packaging are capturing strong opportunities globally, as they allow lightweighting, excellent durability and thermal stability despite growth requirements on sustainability.
- The increasing rate of commercialization of performance-grade solutions using strategic partnerships between bio-innovation companies and specialty materials producers; in September 2024, BASF announced it increased its biomass-balanced additives offering to engineering plastics and automotive usage, lowering product carbon footprint (PCF), and retaining high-heat and structural performance.
- The implementation of performance based biobased formulations are facilitating scalable cost effective implementation in the automotive, construction, electronics and industrial manufacturing value chains around the globe.
Key Trend: Convergence of digital design and green chemistry in additive innovation
-
A combination of sustainable-by-design chemistry with bio-based molecular engineering platforms is driving the global biobased additives market. It facilitates the use of renewable high-performance additives that are more biodegradable and has less lifecycle emissions in the industrial application.
- No longer using fossil-derived intermediates P.2 Digital optimization of green chemistry pathways and bio-feedstock conversion technologies are increasingly being commercialized; in November 2025, P2 science teamed up with Algenesis Corporation to produce algae-derived chemical intermediates and 100 percent biogenic biodegradable polyurethanes are made by using P2 to develop its proprietary green chemistry platform and Algenesis to use its Bio-Iso technology platform.
- Scalable, low-carbon, and circular production models of next-generation biobased additives use this convergence to create next-generation biobased additives globally.
Biobased Additives Market Analysis and Segmental Data
Plasticizers Dominate Global Biobased Additives Market
-
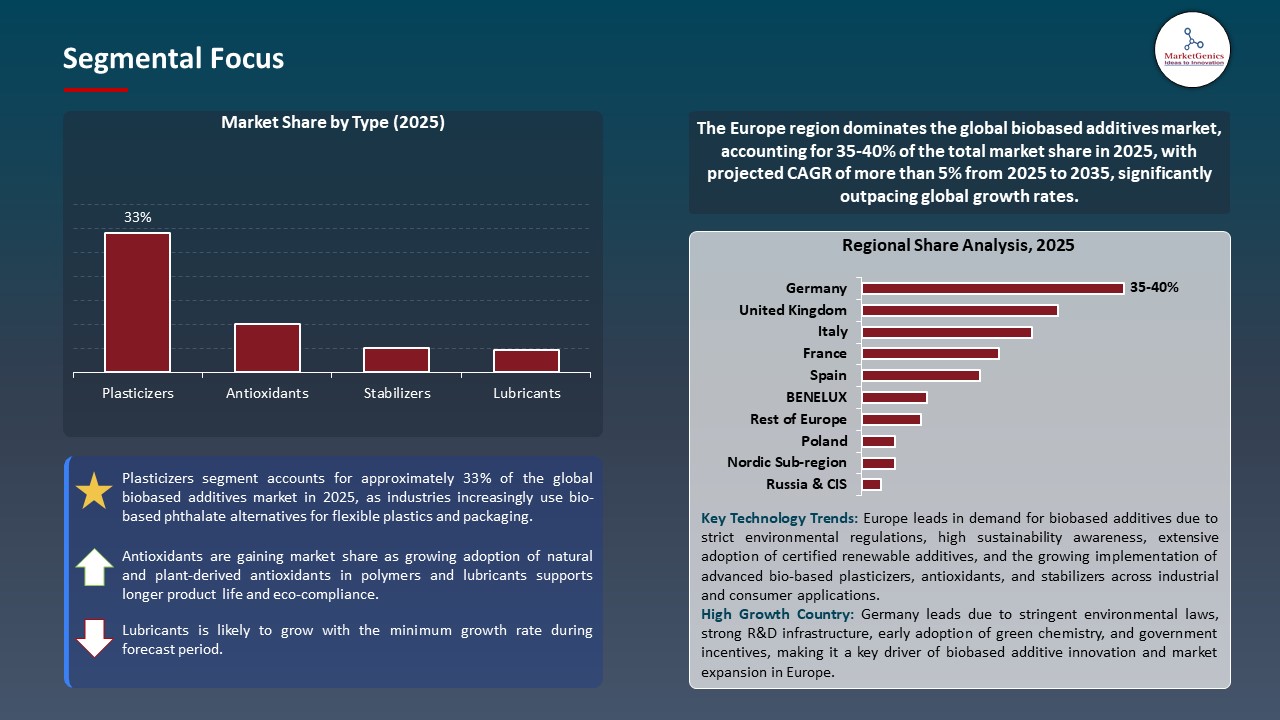
Plasticizers dominates the global biobased additives market because of their capability to enhance the flexibility, durability, and processability of the material, while minimizing environmental impact, in eco-friendly PVC, coating, adhesive, and flexible packaging.
- High-performance bio-based plasticizers are quickly gaining use in industrial, automotive and consumer applications, enabling improvements in product safety, reduced VOC emissions, and sustainable material performance; in February 2025, BASF added ISCC PLUS-certified, biomass-balanced and Ccycled plasticizers, such as Palatinol DOTP Advantage 50 and Palatinol TOTM-I Advantage 50, to its range of sustainable plasticizers in North America, which provide lower CO 2 footprint alternatives to flexible PVC and coat.
- The dominance of plasticizers on the world biobased additives market is strengthened by regulatory compliance, industrial ties, and uptake of renewable feedstock.
Europe Leads Global Biobased Additives Market Demand
-
Europe dominates global biobased additives market with strict EU sustainability regulations, entrenched circular economic policies and great industrial demand in the fields of coatings, plastics, and speciality chemicals as the area is set to be on the forefront of biobased additive adoption.
- The use of biobased additives in packaging, automobile and industrial applications is rapidly increasing: flexing in April 2025, Arkema changed the product line of acrylic thickeners in Europe to incorporate up to 30% bio-based additives which reduces the amount of carbon footprint and allows sustainable use of additives in coatings, adhesives, and building applications.
- Favorable regulatory environment and public-pricing partnerships remain in force strengthening the leadership of Europe in the global biobased additives market.
Biobased Additives Market Ecosystem
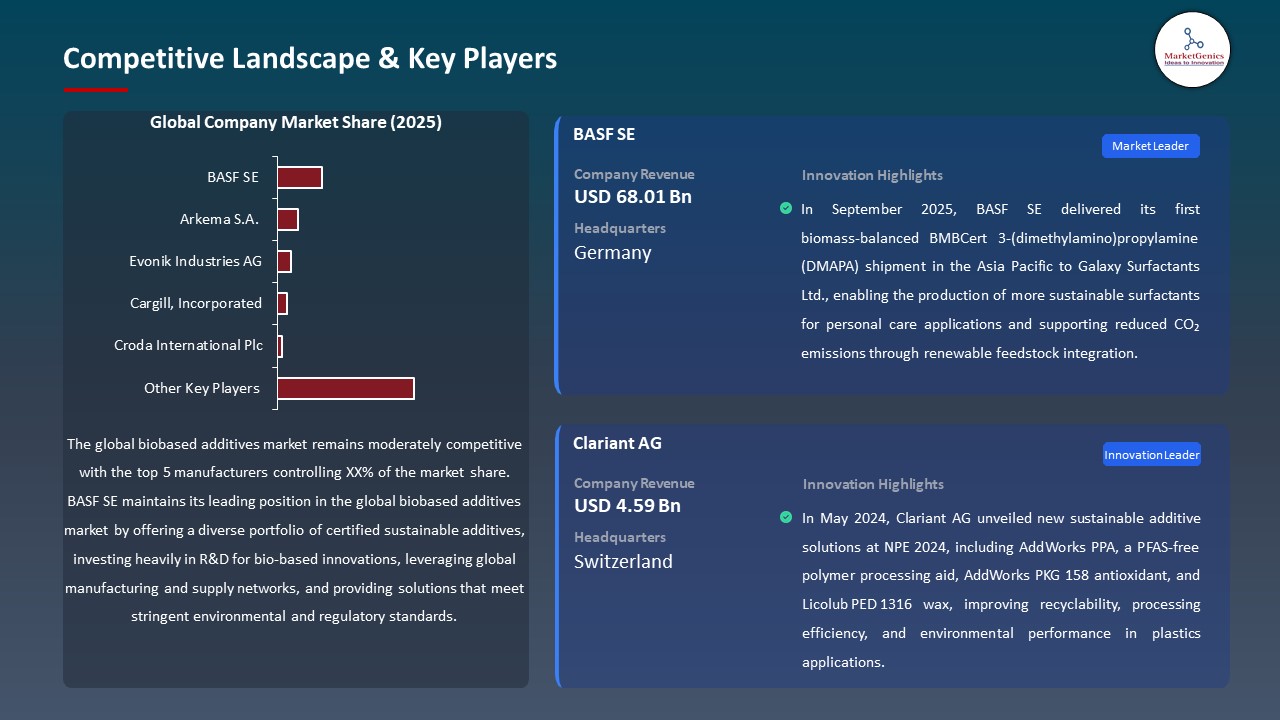
The biobased additives market is moderately consolidated and competition in the industry is concentrated on environmentally friendly formulations and renewable feedstocks, high performance polymer and lubricant additives and process optimization technologies. Presence of BASF SE, Arkema S.A, Evonik Industries AG, Cargill, Incorporated, and Croda international plc forces market share owing to delivery of integrated bio-based additive ecosystems, such as sophisticated bio-additive technologies, sustainable formulations, as well as industrial forms of application.
BASF SE invents bio-based polymer and lubricant additives to promote performance and environmental compliance. Arkema S.A. concentrates on high efficiency industrial additives and automotive additives (renewable) specialty chemicals. Evonik Industries AG focuses on the environmentally-friendly surfactants and processing aids in coatings, plastics and lubricants. Cargill, Incorporated incorporates the biobased oil and the emulsifiers to achieve sustainable formulations, and Croda International Plc offers bio-based functional additives to enhance the durability, safety and energy efficiency of industrial and consumer products.
Government incentives to be sustainable, increased industrial demand of green chemicals, and cooperations with OEMs, chemical innovators and research institutions is accelerating the development of renewable feedstocks, bio-additive performance optimization, environmentally friendly processing and strategic industrial partnerships. These ecosystem interactions enhance competitive distinction, large-scale use of biobased additives in the industrial and automotive industries, and help in cutting down on emissions, energy consumption, and sustainable production in the global market.
 Recent Development and Strategic Overview
-
In April 2025, Arkema announced the transition of its full acrylic thickener line in Europe to bio-based formulations, introducing up to 30% bio-based content and reducing the product carbon footprint by up to 25% while maintaining performance, supporting more sustainable coatings and adhesives products.
- In October 2025, LANXESS introduced a sustainable extreme-pressure lubricant additive, ISCC PLUS certified and with a high content of renewable feedstocks, specifically to provide strong performance in the most demanding applications, and reduce the carbon footprint of bio-based additive formulations.
Report Scope
|
Detail |
|
|
Market Size in 2025 |
USD 1.8 Bn |
|
Market Forecast Value in 2035 |
USD 3.7 Bn |
|
Growth Rate (CAGR) |
7.6% |
|
Forecast Period |
2026 – 2035 |
|
Historical Data Available for |
2021 – 2024 |
|
Market Size Units |
US$ Billion for Value Tons for Volume |
|
Report Format |
Electronic (PDF) + Excel |
|
North America |
Europe |
Asia Pacific |
Middle East |
Africa |
South America |
|
|
|
|
|
|
|
Companies Covered |
|||||
|
|
|
|
|
|
|
Biobased Additives Market Segmentation and Highlights
|
Segment |
Sub-segment |
|
Biobased Additives Market, By Type |
|
|
Biobased Additives Market, By Source |
|
|
Biobased Additives Market, By Form |
|
|
Biobased Additives Market, By Distribution Channel |
|
|
Biobased Additives Market, By End-use Industry |
|
Frequently Asked Questions
Table of Contents
- 1. Research Methodology and Assumptions
- 1.1. Definitions
- 1.2. Research Design and Approach
- 1.3. Data Collection Methods
- 1.4. Base Estimates and Calculations
- 1.5. Forecasting Models
- 1.5.1. Key Forecast Factors & Impact Analysis
- 1.6. Secondary Research
- 1.6.1. Open Sources
- 1.6.2. Paid Databases
- 1.6.3. Associations
- 1.7. Primary Research
- 1.7.1. Primary Sources
- 1.7.2. Primary Interviews with Stakeholders across Ecosystem
- 2. Executive Summary
- 2.1. Global Biobased Additives Market Outlook
- 2.1.1. Biobased Additives Market Size (Volume - Tons & Value - US$ Bn), and Forecasts, 2021-2035
- 2.1.2. Compounded Annual Growth Rate Analysis
- 2.1.3. Growth Opportunity Analysis
- 2.1.4. Segmental Share Analysis
- 2.1.5. Geographical Share Analysis
- 2.2. Market Analysis and Facts
- 2.3. Supply-Demand Analysis
- 2.4. Competitive Benchmarking
- 2.5. Go-to- Market Strategy
- 2.5.1. Customer/ End-use Industry Assessment
- 2.5.2. Growth Opportunity Data, 2026-2035
- 2.5.2.1. Regional Data
- 2.5.2.2. Country Data
- 2.5.2.3. Segmental Data
- 2.5.3. Identification of Potential Market Spaces
- 2.5.4. GAP Analysis
- 2.5.5. Potential Attractive Price Points
- 2.5.6. Prevailing Market Risks & Challenges
- 2.5.7. Preferred Sales & Marketing Strategies
- 2.5.8. Key Recommendations and Analysis
- 2.5.9. A Way Forward
- 2.1. Global Biobased Additives Market Outlook
- 3. Industry Data and Premium Insights
- 3.1. Global Chemicals & Materials Industry Overview, 2025
- 3.1.1. Chemicals & Materials Industry Ecosystem Analysis
- 3.1.2. Key Trends for Chemicals & Materials Industry
- 3.1.3. Regional Distribution for Chemicals & Materials Industry
- 3.2. Supplier Customer Data
- 3.3. Technology Roadmap and Developments
- 3.4. Trade Analysis
- 3.4.1. Import & Export Analysis, 2025
- 3.4.2. Top Importing Countries
- 3.4.3. Top Exporting Countries
- 3.5. Trump Tariff Impact Analysis
- 3.5.1. Manufacturer
- 3.5.1.1. Based on the raw material
- 3.5.2. Supply Chain
- 3.5.3. End Consumer
- 3.5.1. Manufacturer
- 3.6. Raw Material Analysis
- 3.1. Global Chemicals & Materials Industry Overview, 2025
- 4. Market Overview
- 4.1. Market Dynamics
- 4.1.1. Drivers
- 4.1.1.1. Growing demand for environmentally friendly and sustainable additives across industries.
- 4.1.1.2. Stringent environmental regulations pushing reduction of toxic and petroleum-based chemicals.
- 4.1.1.3. Rising adoption in end-use sectors like plastics, coatings, lubricants, and personal care products.
- 4.1.2. Restraints
- 4.1.2.1. Higher production and raw material costs compared to conventional additives.
- 4.1.2.2. Limited performance in certain high-end applications and supply constraints of bio-based feedstocks.
- 4.1.1. Drivers
- 4.2. Key Trend Analysis
- 4.3. Regulatory Framework
- 4.3.1. Key Regulations, Norms, and Subsidies, by Key Countries
- 4.3.2. Tariffs and Standards
- 4.3.3. Impact Analysis of Regulations on the Market
- 4.4. Value Chain Analysis
- 4.4.1. Raw Material Suppliers
- 4.4.2. Biobased Additives Manufacturers
- 4.4.3. Distributors
- 4.4.4. End-Users/ Customers
- 4.5. Porter’s Five Forces Analysis
- 4.6. PESTEL Analysis
- 4.7. Global Biobased Additives Market Demand
- 4.7.1. Historical Market Size – Volume (Tons) & Value (US$ Bn), 2020-2024
- 4.7.2. Current and Future Market Size – Volume (Tons) & Value (US$ Bn), 2026–2035
- 4.7.2.1. Y-o-Y Growth Trends
- 4.7.2.2. Absolute $ Opportunity Assessment
- 4.1. Market Dynamics
- 5. Competition Landscape
- 5.1. Competition structure
- 5.1.1. Fragmented v/s consolidated
- 5.2. Company Share Analysis, 2025
- 5.2.1. Global Company Market Share
- 5.2.2. By Region
- 5.2.2.1. North America
- 5.2.2.2. Europe
- 5.2.2.3. Asia Pacific
- 5.2.2.4. Middle East
- 5.2.2.5. Africa
- 5.2.2.6. South America
- 5.3. Product Comparison Matrix
- 5.3.1. Specifications
- 5.3.2. Market Positioning
- 5.3.3. Pricing
- 5.1. Competition structure
- 6. Global Biobased Additives Market Analysis, by Type
- 6.1. Key Segment Analysis
- 6.2. Biobased Additives Market Size (Volume - Tons & Value - US$ Bn), Analysis, and Forecasts, by Type, 2021-2035
- 6.2.1. Plasticizers
- 6.2.1.1. Epoxidized Soybean Oil (ESO)
- 6.2.1.2. Citrate Esters
- 6.2.1.3. Adipates
- 6.2.1.4. Succinic Acid Esters
- 6.2.1.5. Others
- 6.2.2. Antioxidants
- 6.2.2.1. Tocopherols
- 6.2.2.2. Ascorbic Acid
- 6.2.2.3. Carotenoids
- 6.2.2.4. Polyphenols
- 6.2.3. Stabilizers
- 6.2.3.1. Heat Stabilizers
- 6.2.3.2. Light Stabilizers
- 6.2.3.3. UV Stabilizers
- 6.2.4. Lubricants
- 6.2.4.1. Vegetable Oil-based Lubricants
- 6.2.4.2. Animal Fat-based Lubricants
- 6.2.5. Surfactants
- 6.2.5.1. Anionic
- 6.2.5.2. Cationic
- 6.2.5.3. Non-ionic
- 6.2.5.4. Amphoteric
- 6.2.6. Flame Retardants
- 6.2.7. Impact Modifiers
- 6.2.8. Processing Aids
- 6.2.9. Others
- 6.2.1. Plasticizers
- 7. Global Biobased Additives Market Analysis, by Source
- 7.1. Key Segment Analysis
- 7.2. Biobased Additives Market Size (Volume - Tons & Value - US$ Bn), Analysis, and Forecasts, by Source, 2021-2035
- 7.2.1. Plant-based
- 7.2.2. Animal-based
- 7.2.3. Microorganism-based
- 8. Global Biobased Additives Market Analysis, by Form
- 8.1. Key Segment Analysis
- 8.2. Biobased Additives Market Size (Volume - Tons & Value - US$ Bn), Analysis, and Forecasts, by Form, 2021-2035
- 8.2.1. Liquid
- 8.2.2. Powder
- 8.2.3. Granules
- 8.2.4. Paste
- 9. Global Biobased Additives Market Analysis, by Distribution Channel
- 9.1. Key Segment Analysis
- 9.2. Biobased Additives Market Size (Volume - Tons & Value - US$ Bn), Analysis, and Forecasts, by Distribution Channel, 2021-2035
- 9.2.1. Direct Sales
- 9.2.2. Distributors
- 9.2.3. Online Retailers
- 9.2.4. Specialty Stores
- 10. Global Biobased Additives Market Analysis, by End-use Industry
- 10.1. Key Segment Analysis
- 10.2. Biobased Additives Market Size (Volume - Tons & Value - US$ Bn), Analysis, and Forecasts, by End-use Industry, 2021-2035
- 10.2.1. Packaging
- 10.2.2. Automotive & Transportation
- 10.2.3. Building & Construction
- 10.2.4. Consumer Goods
- 10.2.5. Agriculture
- 10.2.6. Textiles & Apparel
- 10.2.7. Food & Beverages
- 10.2.8. Pharmaceuticals & Medical
- 10.2.9. Paints & Coatings
- 10.2.10. Adhesives & Sealants
- 10.2.11. Electronics & Electrical
- 10.2.12. Paper & Pulp
- 10.2.13. Personal Care & Cosmetics
- 10.2.14. Industrial Manufacturing
- 10.2.15. 3D Printing & Additive Manufacturing
- 10.2.16. Marine & Aerospace
- 10.2.17. Sports & Recreation
- 10.2.18. Others
- 11. Global Biobased Additives Market Analysis and Forecasts, by Region
- 11.1. Key Findings
- 11.2. Biobased Additives Market Size (Volume - Tons & Value - US$ Bn), Analysis, and Forecasts, by Region, 2021-2035
- 11.2.1. North America
- 11.2.2. Europe
- 11.2.3. Asia Pacific
- 11.2.4. Middle East
- 11.2.5. Africa
- 11.2.6. South America
- 12. North America Biobased Additives Market Analysis
- 12.1. Key Segment Analysis
- 12.2. Regional Snapshot
- 12.3. North America Biobased Additives Market Size (Volume - Tons & Value - US$ Bn), Analysis, and Forecasts, 2021-2035
- 12.3.1. Type
- 12.3.2. Source
- 12.3.3. Form
- 12.3.4. Distribution Channel
- 12.3.5. End-use Industry
- 12.3.6. Country
- 12.3.6.1. USA
- 12.3.6.2. Canada
- 12.3.6.3. Mexico
- 12.4. USA Biobased Additives Market
- 12.4.1. Country Segmental Analysis
- 12.4.2. Type
- 12.4.3. Source
- 12.4.4. Form
- 12.4.5. Distribution Channel
- 12.4.6. End-use Industry
- 12.5. Canada Biobased Additives Market
- 12.5.1. Country Segmental Analysis
- 12.5.2. Type
- 12.5.3. Source
- 12.5.4. Form
- 12.5.5. Distribution Channel
- 12.5.6. End-use Industry
- 12.6. Mexico Biobased Additives Market
- 12.6.1. Country Segmental Analysis
- 12.6.2. Type
- 12.6.3. Source
- 12.6.4. Form
- 12.6.5. Distribution Channel
- 12.6.6. End-use Industry
- 13. Europe Biobased Additives Market Analysis
- 13.1. Key Segment Analysis
- 13.2. Regional Snapshot
- 13.3. Europe Biobased Additives Market Size (Volume - Tons & Value - US$ Bn), Analysis, and Forecasts, 2021-2035
- 13.3.1. Type
- 13.3.2. Source
- 13.3.3. Form
- 13.3.4. Distribution Channel
- 13.3.5. End-use Industry
- 13.3.6. Country
- 13.3.6.1. Germany
- 13.3.6.2. United Kingdom
- 13.3.6.3. France
- 13.3.6.4. Italy
- 13.3.6.5. Spain
- 13.3.6.6. Netherlands
- 13.3.6.7. Nordic Countries
- 13.3.6.8. Poland
- 13.3.6.9. Russia & CIS
- 13.3.6.10. Rest of Europe
- 13.4. Germany Biobased Additives Market
- 13.4.1. Country Segmental Analysis
- 13.4.2. Type
- 13.4.3. Source
- 13.4.4. Form
- 13.4.5. Distribution Channel
- 13.4.6. End-use Industry
- 13.5. United Kingdom Biobased Additives Market
- 13.5.1. Country Segmental Analysis
- 13.5.2. Type
- 13.5.3. Source
- 13.5.4. Form
- 13.5.5. Distribution Channel
- 13.5.6. End-use Industry
- 13.6. France Biobased Additives Market
- 13.6.1. Country Segmental Analysis
- 13.6.2. Type
- 13.6.3. Source
- 13.6.4. Form
- 13.6.5. Distribution Channel
- 13.6.6. End-use Industry
- 13.7. Italy Biobased Additives Market
- 13.7.1. Country Segmental Analysis
- 13.7.2. Type
- 13.7.3. Source
- 13.7.4. Form
- 13.7.5. Distribution Channel
- 13.7.6. End-use Industry
- 13.8. Spain Biobased Additives Market
- 13.8.1. Country Segmental Analysis
- 13.8.2. Type
- 13.8.3. Source
- 13.8.4. Form
- 13.8.5. Distribution Channel
- 13.8.6. End-use Industry
- 13.9. Netherlands Biobased Additives Market
- 13.9.1. Country Segmental Analysis
- 13.9.2. Type
- 13.9.3. Source
- 13.9.4. Form
- 13.9.5. Distribution Channel
- 13.9.6. End-use Industry
- 13.10. Nordic Countries Biobased Additives Market
- 13.10.1. Country Segmental Analysis
- 13.10.2. Type
- 13.10.3. Source
- 13.10.4. Form
- 13.10.5. Distribution Channel
- 13.10.6. End-use Industry
- 13.11. Poland Biobased Additives Market
- 13.11.1. Country Segmental Analysis
- 13.11.2. Type
- 13.11.3. Source
- 13.11.4. Form
- 13.11.5. Distribution Channel
- 13.11.6. End-use Industry
- 13.12. Russia & CIS Biobased Additives Market
- 13.12.1. Country Segmental Analysis
- 13.12.2. Type
- 13.12.3. Source
- 13.12.4. Form
- 13.12.5. Distribution Channel
- 13.12.6. End-use Industry
- 13.13. Rest of Europe Biobased Additives Market
- 13.13.1. Country Segmental Analysis
- 13.13.2. Type
- 13.13.3. Source
- 13.13.4. Form
- 13.13.5. Distribution Channel
- 13.13.6. End-use Industry
- 14. Asia Pacific Biobased Additives Market Analysis
- 14.1. Key Segment Analysis
- 14.2. Regional Snapshot
- 14.3. Asia Pacific Biobased Additives Market Size (Volume - Tons & Value - US$ Bn), Analysis, and Forecasts, 2021-2035
- 14.3.1. Type
- 14.3.2. Source
- 14.3.3. Form
- 14.3.4. Distribution Channel
- 14.3.5. End-use Industry
- 14.3.6. Country
- 14.3.6.1. China
- 14.3.6.2. India
- 14.3.6.3. Japan
- 14.3.6.4. South Korea
- 14.3.6.5. Australia and New Zealand
- 14.3.6.6. Indonesia
- 14.3.6.7. Malaysia
- 14.3.6.8. Thailand
- 14.3.6.9. Vietnam
- 14.3.6.10. Rest of Asia Pacific
- 14.4. China Biobased Additives Market
- 14.4.1. Country Segmental Analysis
- 14.4.2. Type
- 14.4.3. Source
- 14.4.4. Form
- 14.4.5. Distribution Channel
- 14.4.6. End-use Industry
- 14.5. India Biobased Additives Market
- 14.5.1. Country Segmental Analysis
- 14.5.2. Type
- 14.5.3. Source
- 14.5.4. Form
- 14.5.5. Distribution Channel
- 14.5.6. End-use Industry
- 14.6. Japan Biobased Additives Market
- 14.6.1. Country Segmental Analysis
- 14.6.2. Type
- 14.6.3. Source
- 14.6.4. Form
- 14.6.5. Distribution Channel
- 14.6.6. End-use Industry
- 14.7. South Korea Biobased Additives Market
- 14.7.1. Country Segmental Analysis
- 14.7.2. Type
- 14.7.3. Source
- 14.7.4. Form
- 14.7.5. Distribution Channel
- 14.7.6. End-use Industry
- 14.8. Australia and New Zealand Biobased Additives Market
- 14.8.1. Country Segmental Analysis
- 14.8.2. Type
- 14.8.3. Source
- 14.8.4. Form
- 14.8.5. Distribution Channel
- 14.8.6. End-use Industry
- 14.9. Indonesia Biobased Additives Market
- 14.9.1. Country Segmental Analysis
- 14.9.2. Type
- 14.9.3. Source
- 14.9.4. Form
- 14.9.5. Distribution Channel
- 14.9.6. End-use Industry
- 14.10. Malaysia Biobased Additives Market
- 14.10.1. Country Segmental Analysis
- 14.10.2. Type
- 14.10.3. Source
- 14.10.4. Form
- 14.10.5. Distribution Channel
- 14.10.6. End-use Industry
- 14.11. Thailand Biobased Additives Market
- 14.11.1. Country Segmental Analysis
- 14.11.2. Type
- 14.11.3. Source
- 14.11.4. Form
- 14.11.5. Distribution Channel
- 14.11.6. End-use Industry
- 14.12. Vietnam Biobased Additives Market
- 14.12.1. Country Segmental Analysis
- 14.12.2. Type
- 14.12.3. Source
- 14.12.4. Form
- 14.12.5. Distribution Channel
- 14.12.6. End-use Industry
- 14.13. Rest of Asia Pacific Biobased Additives Market
- 14.13.1. Country Segmental Analysis
- 14.13.2. Type
- 14.13.3. Source
- 14.13.4. Form
- 14.13.5. Distribution Channel
- 14.13.6. End-use Industry
- 15. Middle East Biobased Additives Market Analysis
- 15.1. Key Segment Analysis
- 15.2. Regional Snapshot
- 15.3. Middle East Biobased Additives Market Size (Volume - Tons & Value - US$ Bn), Analysis, and Forecasts, 2021-2035
- 15.3.1. Type
- 15.3.2. Source
- 15.3.3. Form
- 15.3.4. Distribution Channel
- 15.3.5. End-use Industry
- 15.3.6. Country
- 15.3.6.1. Turkey
- 15.3.6.2. UAE
- 15.3.6.3. Saudi Arabia
- 15.3.6.4. Israel
- 15.3.6.5. Rest of Middle East
- 15.4. Turkey Biobased Additives Market
- 15.4.1. Country Segmental Analysis
- 15.4.2. Type
- 15.4.3. Source
- 15.4.4. Form
- 15.4.5. Distribution Channel
- 15.4.6. End-use Industry
- 15.5. UAE Biobased Additives Market
- 15.5.1. Country Segmental Analysis
- 15.5.2. Type
- 15.5.3. Source
- 15.5.4. Form
- 15.5.5. Distribution Channel
- 15.5.6. End-use Industry
- 15.6. Saudi Arabia Biobased Additives Market
- 15.6.1. Country Segmental Analysis
- 15.6.2. Type
- 15.6.3. Source
- 15.6.4. Form
- 15.6.5. Distribution Channel
- 15.6.6. End-use Industry
- 15.7. Israel Biobased Additives Market
- 15.7.1. Country Segmental Analysis
- 15.7.2. Type
- 15.7.3. Source
- 15.7.4. Form
- 15.7.5. Distribution Channel
- 15.7.6. End-use Industry
- 15.8. Rest of Middle East Biobased Additives Market
- 15.8.1. Country Segmental Analysis
- 15.8.2. Type
- 15.8.3. Source
- 15.8.4. Form
- 15.8.5. Distribution Channel
- 15.8.6. End-use Industry
- 16. Africa Biobased Additives Market Analysis
- 16.1. Key Segment Analysis
- 16.2. Regional Snapshot
- 16.3. Africa Biobased Additives Market Size (Volume - Tons & Value - US$ Bn), Analysis, and Forecasts, 2021-2035
- 16.3.1. Type
- 16.3.2. Source
- 16.3.3. Form
- 16.3.4. Distribution Channel
- 16.3.5. End-use Industry
- 16.3.6. Country
- 16.3.6.1. South Africa
- 16.3.6.2. Egypt
- 16.3.6.3. Nigeria
- 16.3.6.4. Algeria
- 16.3.6.5. Rest of Africa
- 16.4. South Africa Biobased Additives Market
- 16.4.1. Country Segmental Analysis
- 16.4.2. Type
- 16.4.3. Source
- 16.4.4. Form
- 16.4.5. Distribution Channel
- 16.4.6. End-use Industry
- 16.5. Egypt Biobased Additives Market
- 16.5.1. Country Segmental Analysis
- 16.5.2. Type
- 16.5.3. Source
- 16.5.4. Form
- 16.5.5. Distribution Channel
- 16.5.6. End-use Industry
- 16.6. Nigeria Biobased Additives Market
- 16.6.1. Country Segmental Analysis
- 16.6.2. Type
- 16.6.3. Source
- 16.6.4. Form
- 16.6.5. Distribution Channel
- 16.6.6. End-use Industry
- 16.7. Algeria Biobased Additives Market
- 16.7.1. Country Segmental Analysis
- 16.7.2. Type
- 16.7.3. Source
- 16.7.4. Form
- 16.7.5. Distribution Channel
- 16.7.6. End-use Industry
- 16.8. Rest of Africa Biobased Additives Market
- 16.8.1. Country Segmental Analysis
- 16.8.2. Type
- 16.8.3. Source
- 16.8.4. Form
- 16.8.5. Distribution Channel
- 16.8.6. End-use Industry
- 17. South America Biobased Additives Market Analysis
- 17.1. Key Segment Analysis
- 17.2. Regional Snapshot
- 17.3. South America Biobased Additives Market Size (Volume - Tons & Value - US$ Bn), Analysis, and Forecasts, 2021-2035
- 17.3.1. Type
- 17.3.2. Source
- 17.3.3. Form
- 17.3.4. Distribution Channel
- 17.3.5. End-use Industry
- 17.3.6. Country
- 17.3.6.1. Brazil
- 17.3.6.2. Argentina
- 17.3.6.3. Rest of South America
- 17.4. Brazil Biobased Additives Market
- 17.4.1. Country Segmental Analysis
- 17.4.2. Type
- 17.4.3. Source
- 17.4.4. Form
- 17.4.5. Distribution Channel
- 17.4.6. End-use Industry
- 17.5. Argentina Biobased Additives Market
- 17.5.1. Country Segmental Analysis
- 17.5.2. Type
- 17.5.3. Source
- 17.5.4. Form
- 17.5.5. Distribution Channel
- 17.5.6. End-use Industry
- 17.6. Rest of South America Biobased Additives Market
- 17.6.1. Country Segmental Analysis
- 17.6.2. Type
- 17.6.3. Source
- 17.6.4. Form
- 17.6.5. Distribution Channel
- 17.6.6. End-use Industry
- 18. Key Players/ Company Profile
- 18.1. BASF SE.
- 18.1.1. Company Details/ Overview
- 18.1.2. Company Financials
- 18.1.3. Key Customers and Competitors
- 18.1.4. Business/ Industry Portfolio
- 18.1.5. Product Portfolio/ Specification Details
- 18.1.6. Pricing Data
- 18.1.7. Strategic Overview
- 18.1.8. Recent Developments
- 18.2. Akzo Nobel N.V.
- 18.3. Arkema S.A.
- 18.4. Ashland Global Holdings Inc.
- 18.5. BioAmber Inc.
- 18.6. Cargill, Incorporated
- 18.7. Clariant AG
- 18.8. Corbion N.V.
- 18.9. Croda International Plc
- 18.10. DuPont de Nemours, Inc.
- 18.11. Eastman Chemical Company
- 18.12. Ecogreen Oleochemicals
- 18.13. Emery Oleochemicals
- 18.14. Evonik Industries AG
- 18.15. Galata Chemicals
- 18.16. Huntsman Corporation
- 18.17. Lanxess AG
- 18.18. Matrica S.p.A.
- 18.19. Mitsubishi Chemical Corporation
- 18.20. Myriant Corporation
- 18.21. Solvay S.A.
- 18.22. Songwon Industrial Co., Ltd.
- 18.23. Vertellus Holdings LLC
- 18.24. Other Key Players
- 18.1. BASF SE.
Note* - This is just tentative list of players. While providing the report, we will cover more number of players based on their revenue and share for each geography
Research Design
Our research design integrates both demand-side and supply-side analysis through a balanced combination of primary and secondary research methodologies. By utilizing both bottom-up and top-down approaches alongside rigorous data triangulation methods, we deliver robust market intelligence that supports strategic decision-making.
MarketGenics' comprehensive research design framework ensures the delivery of accurate, reliable, and actionable market intelligence. Through the integration of multiple research approaches, rigorous validation processes, and expert analysis, we provide our clients with the insights needed to make informed strategic decisions and capitalize on market opportunities.

MarketGenics leverages a dedicated industry panel of experts and a comprehensive suite of paid databases to effectively collect, consolidate, and analyze market intelligence.
Our approach has consistently proven to be reliable and effective in generating accurate market insights, identifying key industry trends, and uncovering emerging business opportunities.
Through both primary and secondary research, we capture and analyze critical company-level data such as manufacturing footprints, including technical centers, R&D facilities, sales offices, and headquarters.
Our expert panel further enhances our ability to estimate market size for specific brands based on validated field-level intelligence.
Our data mining techniques incorporate both parametric and non-parametric methods, allowing for structured data collection, sorting, processing, and cleaning.
Demand projections are derived from large-scale data sets analyzed through proprietary algorithms, culminating in robust and reliable market sizing.
Research Approach
The bottom-up approach builds market estimates by starting with the smallest addressable market units and systematically aggregating them to create comprehensive market size projections.
This method begins with specific, granular data points and builds upward to create the complete market landscape.
Customer Analysis → Segmental Analysis → Geographical Analysis
The top-down approach starts with the broadest possible market data and systematically narrows it down through a series of filters and assumptions to arrive at specific market segments or opportunities.
This method begins with the big picture and works downward to increasingly specific market slices.
TAM → SAM → SOM


Research Methods
Desk / Secondary Research
While analysing the market, we extensively study secondary sources, directories, and databases to identify and collect information useful for this technical, market-oriented, and commercial report. Secondary sources that we utilize are not only the public sources, but it is a combination of Open Source, Associations, Paid Databases, MG Repository & Knowledgebase, and others.
- Company websites, annual reports, financial reports, broker reports, and investor presentations
- National government documents, statistical databases and reports
- News articles, press releases and web-casts specific to the companies operating in the market, Magazines, reports, and others
- We gather information from commercial data sources for deriving company specific data such as segmental revenue, share for geography, product revenue, and others
- Internal and external proprietary databases (industry-specific), relevant patent, and regulatory databases
- Governing Bodies, Government Organizations
- Relevant Authorities, Country-specific Associations for Industries
We also employ the model mapping approach to estimate the product level market data through the players' product portfolio
Primary Research
Primary research/ interviews is vital in analyzing the market. Most of the cases involves paid primary interviews. Primary sources include primary interviews through e-mail interactions, telephonic interviews, surveys as well as face-to-face interviews with the different stakeholders across the value chain including several industry experts.
| Type of Respondents | Number of Primaries |
|---|---|
| Tier 2/3 Suppliers | ~20 |
| Tier 1 Suppliers | ~25 |
| End-users | ~25 |
| Industry Expert/ Panel/ Consultant | ~30 |
| Total | ~100 |
MG Knowledgebase
• Repository of industry blog, newsletter and case studies
• Online platform covering detailed market reports, and company profiles
Forecasting Factors and Models
Forecasting Factors
- Historical Trends – Past market patterns, cycles, and major events that shaped how markets behave over time. Understanding past trends helps predict future behavior.
- Industry Factors – Specific characteristics of the industry like structure, regulations, and innovation cycles that affect market dynamics.
- Macroeconomic Factors – Economic conditions like GDP growth, inflation, and employment rates that affect how much money people have to spend.
- Demographic Factors – Population characteristics like age, income, and location that determine who can buy your product.
- Technology Factors – How quickly people adopt new technology and how much technology infrastructure exists.
- Regulatory Factors – Government rules, laws, and policies that can help or restrict market growth.
- Competitive Factors – Analyzing competition structure such as degree of competition and bargaining power of buyers and suppliers.
Forecasting Models / Techniques
Multiple Regression Analysis
- Identify and quantify factors that drive market changes
- Statistical modeling to establish relationships between market drivers and outcomes
Time Series Analysis – Seasonal Patterns
- Understand regular cyclical patterns in market demand
- Advanced statistical techniques to separate trend, seasonal, and irregular components
Time Series Analysis – Trend Analysis
- Identify underlying market growth patterns and momentum
- Statistical analysis of historical data to project future trends
Expert Opinion – Expert Interviews
- Gather deep industry insights and contextual understanding
- In-depth interviews with key industry stakeholders
Multi-Scenario Development
- Prepare for uncertainty by modeling different possible futures
- Creating optimistic, pessimistic, and most likely scenarios
Time Series Analysis – Moving Averages
- Sophisticated forecasting for complex time series data
- Auto-regressive integrated moving average models with seasonal components
Econometric Models
- Apply economic theory to market forecasting
- Sophisticated economic models that account for market interactions
Expert Opinion – Delphi Method
- Harness collective wisdom of industry experts
- Structured, multi-round expert consultation process
Monte Carlo Simulation
- Quantify uncertainty and probability distributions
- Thousands of simulations with varying input parameters
Research Analysis
Our research framework is built upon the fundamental principle of validating market intelligence from both demand and supply perspectives. This dual-sided approach ensures comprehensive market understanding and reduces the risk of single-source bias.
Demand-Side Analysis: We understand end-user/application behavior, preferences, and market needs along with the penetration of the product for specific application.
Supply-Side Analysis: We estimate overall market revenue, analyze the segmental share along with industry capacity, competitive landscape, and market structure.
Validation & Evaluation
Data triangulation is a validation technique that uses multiple methods, sources, or perspectives to examine the same research question, thereby increasing the credibility and reliability of research findings. In market research, triangulation serves as a quality assurance mechanism that helps identify and minimize bias, validate assumptions, and ensure accuracy in market estimates.
- Data Source Triangulation – Using multiple data sources to examine the same phenomenon
- Methodological Triangulation – Using multiple research methods to study the same research question
- Investigator Triangulation – Using multiple researchers or analysts to examine the same data
- Theoretical Triangulation – Using multiple theoretical perspectives to interpret the same data

Custom Market Research Services
We will customise the research for you, in case the report listed above does not meet your requirements.
Get 10% Free Customisation