Biobased Chemicals Market Size, Share & Trends Analysis Report by Product Type (Bio-Based Platform Chemicals, Bio-Based Solvents, Bio-Based Polymers & Polymer Precursors, Bio-Based Surfactants, Bio-Based Fatty Acids & Derivatives, Bio-Based Alcohols, Bio-Based Organic Acids, Bio-Based Resins & Adhesives, Bio-Based Specialty/Fine Chemicals, Bio-Based Lubricants & Base Oils, Others), Feedstock, Conversion Technology, Form, End-Use Industry, and Geography (North America, Europe, Asia Pacific, Middle East, Africa, and South America) – Global Industry Data, Trends, and Forecasts, 2026–2035
|
|
|
Segmental Data Insights |
|
|
Demand Trends |
|
|
Competitive Landscape |
|
|
Strategic Development |
|
|
Future Outlook & Opportunities |
|
Biobased Chemicals Market Size, Share, and Growth
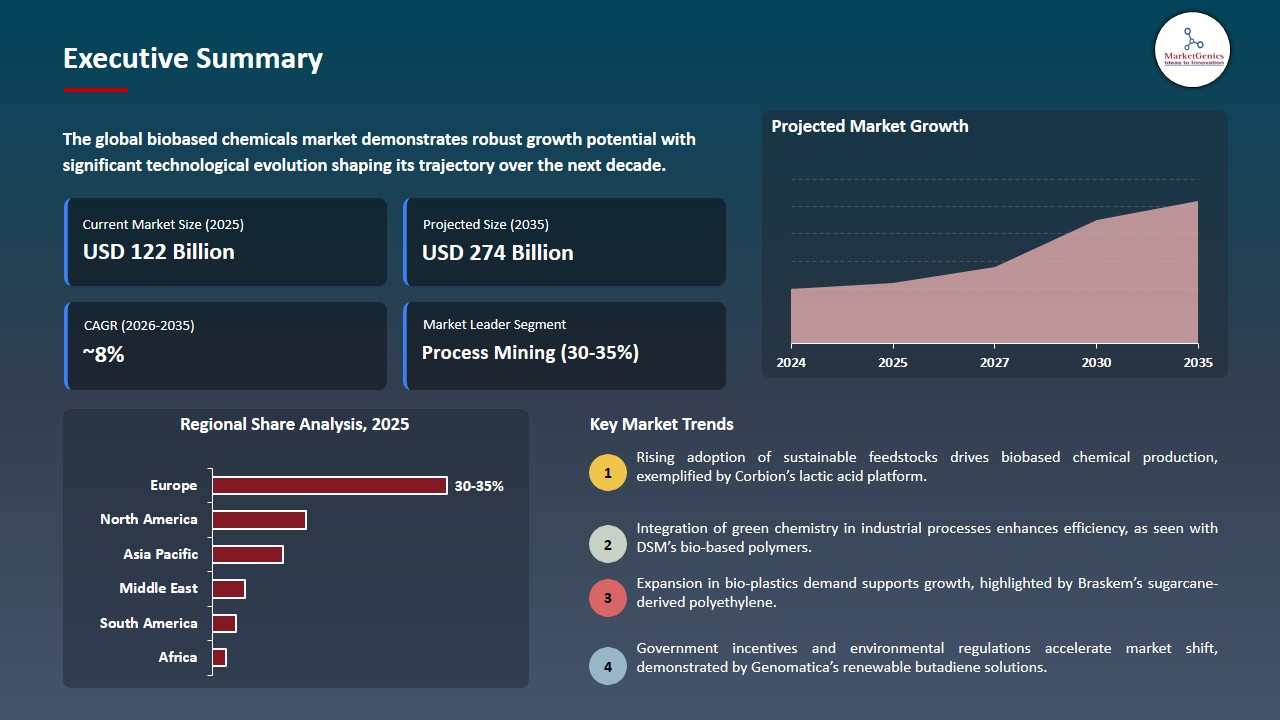
The global biobased chemicals market is witnessing strong growth, valued at USD 122.1 billion in 2025 and projected to reach USD 273.5 billion by 2035, expanding at a CAGR of 8.4% during the forecast period. North America is the fastest-growing biobased chemicals market due to strong federal and state-level renewable fuel incentives, expanding bio-refinery capacity, rising corporate sustainability commitments, abundant agricultural feedstock availability, and increasing demand for low-carbon materials across packaging, transportation fuels, and industrial manufacturing sectors.
Mr. Ashish Saxena, Joint President, Packaging Films Business, UFlex Limited, said, “Since our inception, we have always been committed to pioneering sustainable packaging solutions. We are pleased to offer our latest innovation the single-pellet solution, which will be a game-changer for food and beverage brands striving to meet EPR compliance under the new FSSAI guidelines.”
The increasing regulatory pressures to lower the carbon content and reliance on fossil-based feedstock in the industrial sector are rapidly driving the shift to bio-based chemicals in the packaging, fuels, solvents, and performance materials industries. Owners of brands are establishing renewable content goals into the procurement practices, enhancing long-term visibility of offtakes, and prompting manufacturers to increase commercial production volumes.
In 2024, BASF SE acquired more biomass balance in Europe to produce certified bio-attributed chemicals in packaging and consumer uses and build upon a large-scale use of renewable feedstocks by conventional value chains. On the same note, Braskem S.A. has advanced with the growth of its bio-based poly-ethylene manufacturing to satisfy the increasing global demand of sustainable plastics in food and personal care packaging industries.
Investment in advanced biorefineries, utilization of agricultural residues, and fermentation technologies is making cost efficiency and diversification of feeds, which allows wider industrial infiltration. Regulatory harmonization and strategic capacity enhancements are facilitating the structural transformation of chemical production to renewable based production worldwide.
Key adjacent opportunities to the biobased chemicals market include sustainable aviation fuel (SAF), bio-based polymers for 3D printing, biodegradable lubricants, bio-based construction resins, and renewable carbon capture utilization materials. These segments leverage similar feedstocks, fermentation technologies, and green chemistry platforms, enabling cross-industry expansion. Adjacent market integration enhances revenue diversification and accelerates scale-driven competitiveness in the bioeconomy.
Biobased Chemicals Market Dynamics and Trends
Driver: Increasing Adoption of Advanced Biobased Chemicals in Orthopedic and Cardiovascular Implants Globally
-
Increased corporate net-zero commitments have increased the pace at which companies are switching to bio-based chemicals in search of quantifiable Scope 1, 2, and 3 emissions reductions. MNCs in packaging, automobile, textile, and consumer goods are incorporating renewable feedstock ambitions into their buying structure to follow the decarbonization agendas and shareholder anticipations.
- Latent strategic alignment is enhancing long-term supply agreements, promoting capacity growth, and influencing innovation in biomass-balance and fermentation-based chemical production technologies.
- Braskem S.A. introduced next generation I’m green bio-based and circular polymers in 2025, including MDO bio-based PE films, Medcol bio-based LDPE in healthcare, bio-based HDPE in non-wovens, and 21% bio-based EVA foam, and collaborated with bottle up, Eurobottle and Polytan to scale sustainable plastic solutions all over the world.
- Rapid decarbonization of the corporate undertakings and commercial scale product innovations are structurally enhancing the demand visibility and the long term growth opportunities of the global bio-based chemicals market.
Restraint: Stringent Regulatory Approval Processes for Implantable Biobased Chemicals
-
Production of bio-based chemicals on a commercial scale will need a large amount of capital to support biorefineries, precision fermentation and catalytic upgrading units, and downstream purification facilities.
- These plants require engineering skills that are specialist, ongoing investment on research and development, and require a lengthy commissioning period thus lead to a long turnover period. It is also essential though frequently convoluted to ensure a stable feedstock supply contract and long-term offtake agreement.
- The traditional petrochemical facilities have the advantage of decades of optimization and integration at scale, enabling reduced unit costs of production. Conversely, most bio-based platforms are yet to achieve complete operational efficiency.
- Fluctuations in feedstock availability, logistics, and process yield can increase operating costs to make it less competitive with prices in bulk chemical markets and slow the broad scale industrial replacement.
Opportunity: Expansion Through Sustainable Aviation Fuel and Biochemical Integration Platforms
-
The fast development of the infrastructure of sustainable aviation fuel (SAF) is creating new opportunities to enable bio-based chemical manufacturers to incorporate renewable intermediates into multi-product biorefineries. The conversion pathways of alcohol-to-jet and other conversion pathways also produce useful co-products that can be further upgraded to bio-based solvents, polymers and specialty chemicals enhancing the overall accuracy of carbon utilization.
- The integration improves the economics of assets, revenue streams, and long-term feedstock security and can speed up commercialization of renewable carbon value chain in fuel and chemical industries.
- LanzaTech collaborated with ADNOC to transform the industrial wastes gases into sustainable aviation fuels and bio-based chemical intermediate products and further progressed decarbonization and circular economy in fuels, plastics, and synthetic fibers in the UAE.
- Scalable growth and long-term value creation in renewable fuels and chemicals market is being driven by integrating SAF production with bio-based chemical co-products.
Key Trend: Digital Process Optimization and Bio-Manufacturing Automation
-
The utilization of the digital process optimization and automation technologies is changing the production of bio-based chemicals. Modern sensors, process control through AI, and real-time analysis allow fine-tuning of fermentation, enzymatic reaction and downstream purification, enhancing the yield, consistency and operational efficiency.
- Automation lowers human error, cuts down labor costs, and also speed up bio-manufacturing process scale-up. Incorporating predictive maintenance, digital twins, and intelligent supply chain management, manufacturers will be able to streamline production, reduce downtime, and make in the bio-based chemical facilities more competitive and responsive in the market, which will position them at an even greater advantage.
- Novonesis (Novozymes) became a full-stack bio-innovation platform in 2026, by using industrial enzymes and microbes on a large-scale level to maximize the use of energy, and to make household care, food, agriculture, biofuels, and industrial biosolutions free from petroleum-based chemicals.
- Global bio-based chemicals market: Digital optimization and bio-manufacturing automation are driving competitive development of efficiency, scalability, and sustainability.
Biobased-Chemicals-Market Analysis and Segmental Data
Bio-Based Polymers & Polymer Precursors Dominate Global Biobased Chemicals Market
-
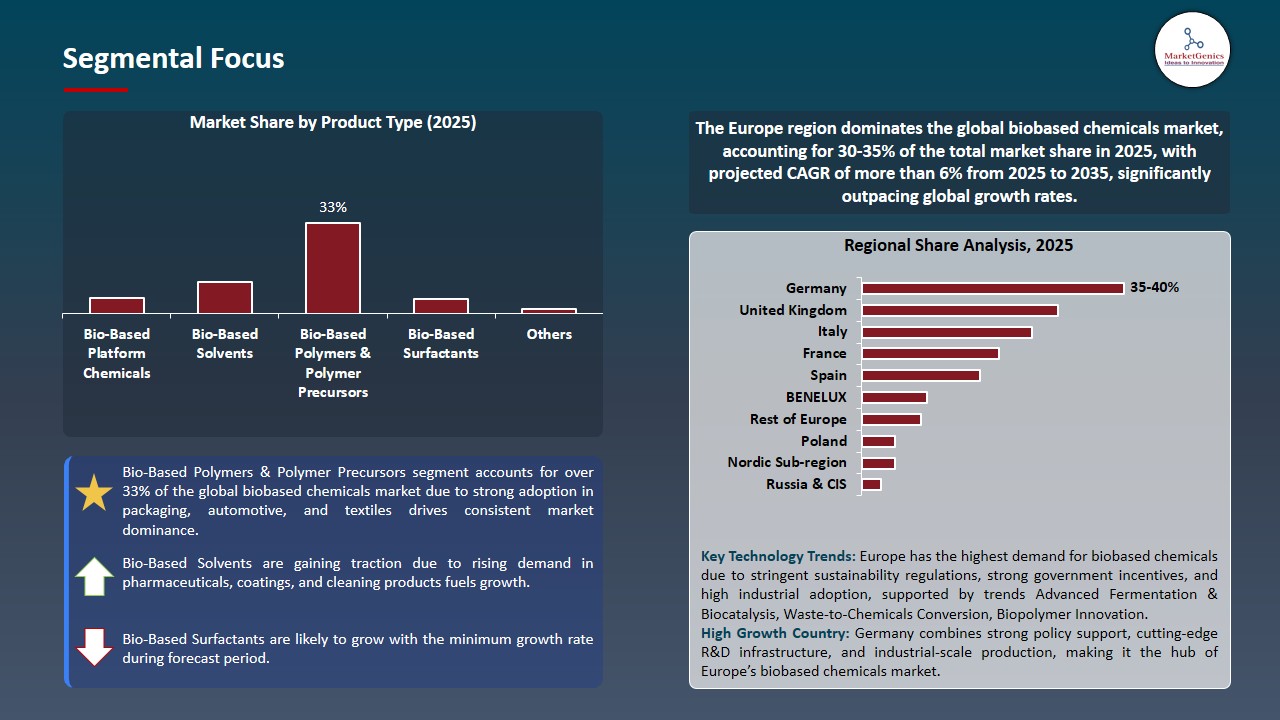
The bio-based polymers and polymer precursors segment dominates the world biobased chemicals market, where a large part of the market is being taken by the sector because of the growing demand of sustainable alternatives in packaging, textile, automotive, and construction sectors.
- These renewable-based polymers based on sugarcane, corn, and vegetable oils have similar performance to the traditional petrochemical-based polymers with a lower carbon footprint and reduced environmental impact.
- The development of bio-polymer technologies, such as polylactic acid (PLA), poly halo xyloate (PHA) as well as bio-based polyethylene has been used in high-performance material, bio-degradable packaging and specialty coating. The increasing corporate sustainability obligations, and tough environmental laws, are compelling manufacturers to use bio-based solutions of polymers.
- The trend makes the segment a foundation of innovation, where more industries and consumers can use more environmentally friendly materials.
Europe Leads Global Biobased Chemicals Market Demand
-
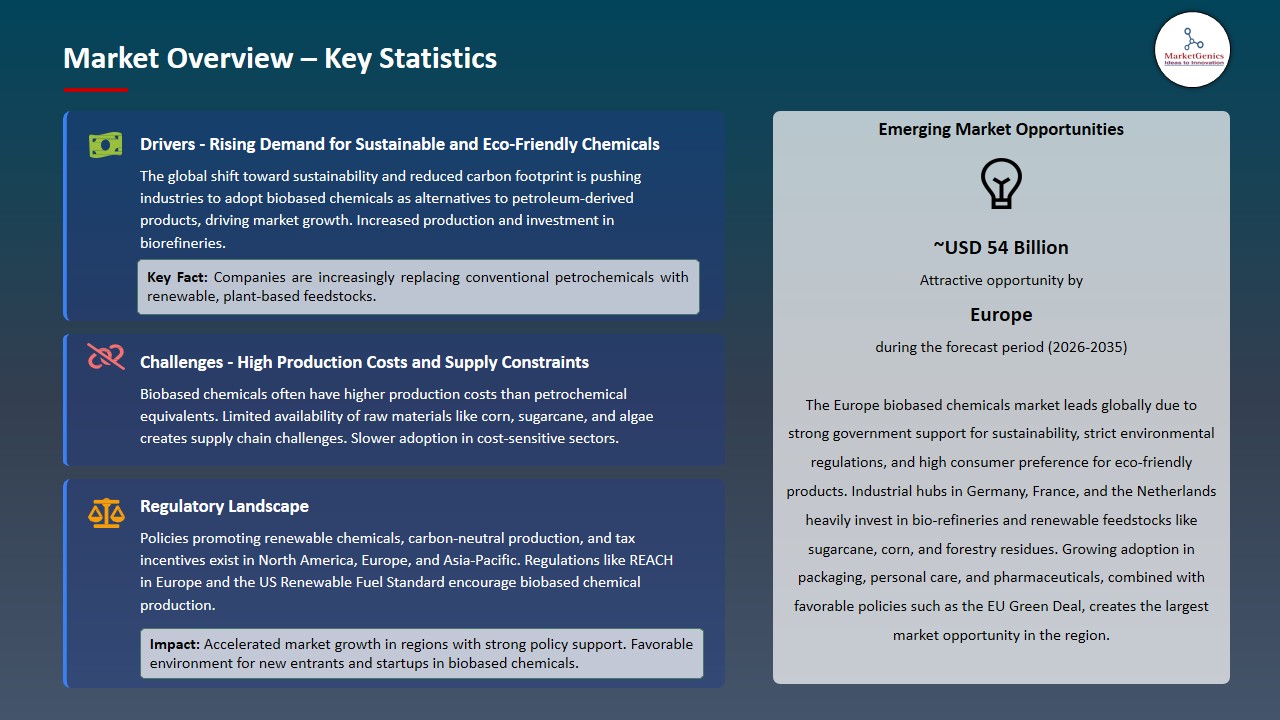
Europe is at the forefront of the international biobased chemicals market, due to a high level of environmental regulation, a well-developed recycling system, and significant government support of sustainable and a circular economy. The consumer awareness and the demand of environmentally friendly products are also high, thus driving the companies to use renewable feedstocks and biobased solutions in packaging, personal care and industrial use.
- The area is enjoying well-developed research and development ecosystems, and can innovate in bio-polymers, solvents and specialty chemicals. Joint efforts among the manufacturers, academic institutions and policymakers facilitate commercialization of next-generation biobased products.
- Moreover, the fact that Europe is geared towards carbon footprint and sustainable supply chains enhances market expansion in the long run, and therefore, is one of the major targets of investment, manufacturing, and implementation of bio-based chemical technologies in the world market.
- Europe has a regulatory support, innovation hub and sustainability that make it a leader and long-term growth in the world biobased chemicals market.
Biobased-Chemicals-Market Ecosystem
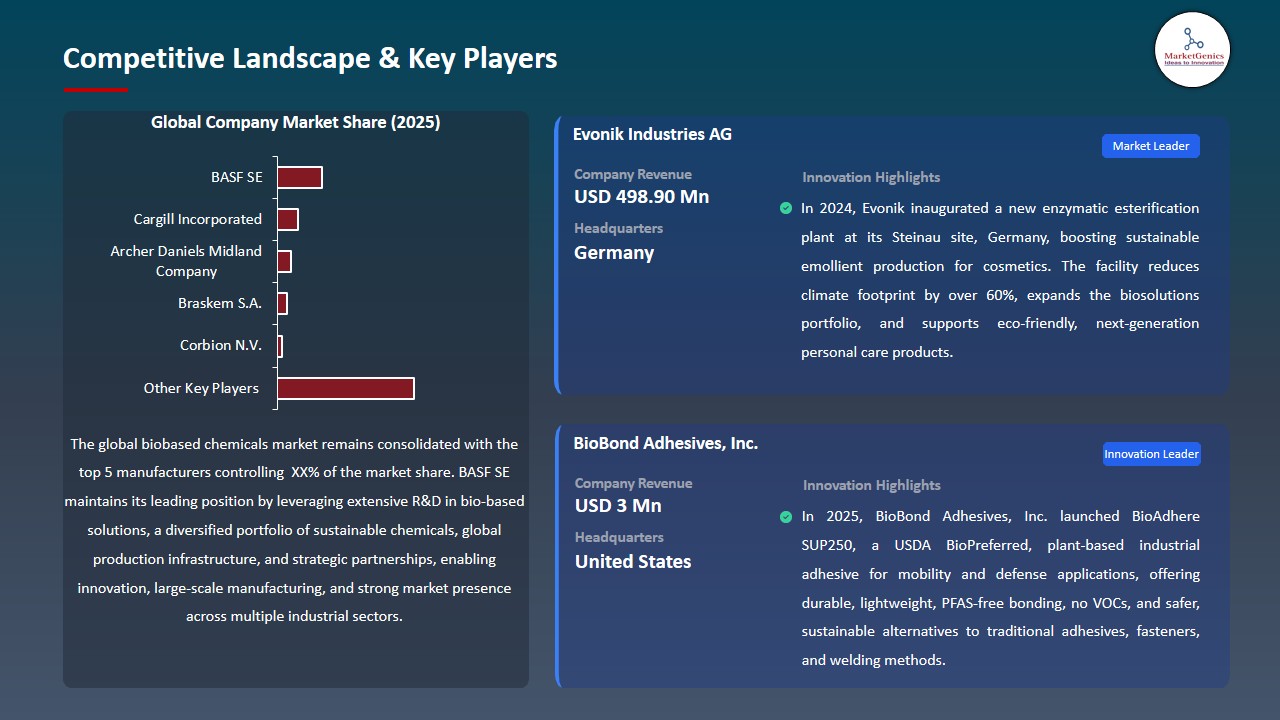
The global biobased chemicals market is moderately fragmented, with key players including BASF SE, Cargill Incorporated, Archer Daniels Midland Company, Braskem S.A., and Corbion N.V. These firms have competitive advantages of diversified portfolios of renewable products, integrated access to feedstock, modern fermentation and catalytic technologies and extensive networks of global distribution. Their presence in the market is strengthened by their constant investments in the expansion of bio-refinery capacity, certified biomass-balance solutions and strategic alliances in packaging, automotive, agriculture and consumer goods.
The biobased chemicals value chain includes the cultivation and sourcing of renewable feedstock, biomass processing and conversion, fermentation or catalytic transformation, purification and formulation, integration into industries, distribution, and development of end-use application. Post-product activities including the lifecycle assessment, regulatory certification, sustainability auditing, and supply chain traceability help in improving the credibility and marketability of products, to aid their adoption in fuels, polymers, solvents, and specialty chemical products.
The barriers to entry are high because the biorefinery infrastructure is capital-intensive, the biotechnology needs are high, the security of feedstock supply, regulatory approval and extended customer qualification cycles. Differentiation is being driven by continuous innovation in the field of enzyme engineering, carbon utilization technologies, drop-in bio-based alternatives, and circular feedstock integration, which allow scalable, lower-carbon chemical solutions and allow the global market to continue expanding.
Recent Development and Strategic Overview:
-
In November 2025, BASF SE expanded its Alkyl Polyglucosides (APGs) production capacity at the Bangpakong, Thailand site to strengthen regional supply of bio-based, biodegradable surfactants. The move enhances BASF’s global APG network across Germany, China, and the U.S., addressing rising demand for sustainable solutions in personal care, home care, and industrial applications.
- In October 2025, Cargill Incorporated unveiled Incroflo P50, a next-generation bio-based polymer processing aid containing 86% renewable content. Designed as a fluoropolymer replacement for LLDPE extrusion, the additive enhances melt flow, eliminates melt fracture, and improves film clarity and surface quality, supporting sustainable packaging innovation.
Report Scope
|
Detail |
|
|
Market Size in 2025 |
USD 122.1 Bn |
|
Market Forecast Value in 2035 |
USD 273.5 Bn |
|
Growth Rate (CAGR) |
8.4% |
|
Forecast Period |
2026 – 2035 |
|
Historical Data Available for |
2021 – 2024 |
|
Market Size Units |
US$ Billion for Value Tons for Volume |
|
Report Format |
Electronic (PDF) + Excel |
|
North America |
Europe |
Asia Pacific |
Middle East |
Africa |
South America |
|
|
|
|
|
|
|
Companies Covered |
|||||
|
|
|
|
|
|
Biobased-Chemicals-Market Segmentation and Highlights
|
Segment |
Sub-segment |
|
Biobased Chemicals Market, By Product Type |
|
|
Biobased Chemicals Market, By Feedstock |
|
|
Biobased Chemicals Market, By Conversion Technology |
|
|
Biobased Chemicals Market, By Form |
|
|
Biobased Chemicals Market, By End-Use Industry |
|
Frequently Asked Questions
Table of Contents
- 1. Research Methodology and Assumptions
- 1.1. Definitions
- 1.2. Research Design and Approach
- 1.3. Data Collection Methods
- 1.4. Base Estimates and Calculations
- 1.5. Forecasting Models
- 1.5.1. Key Forecast Factors & Impact Analysis
- 1.6. Secondary Research
- 1.6.1. Open Sources
- 1.6.2. Paid Databases
- 1.6.3. Associations
- 1.7. Primary Research
- 1.7.1. Primary Sources
- 1.7.2. Primary Interviews with Stakeholders across Ecosystem
- 2. Executive Summary
- 2.1. Global Biobased Chemicals Market Outlook
- 2.1.1. Biobased Chemicals Market Size Volume (Tons) & Value (US$ Bn), and Forecasts, 2021-2035
- 2.1.2. Compounded Annual Growth Rate Analysis
- 2.1.3. Growth Opportunity Analysis
- 2.1.4. Segmental Share Analysis
- 2.1.5. Geographical Share Analysis
- 2.2. Market Analysis and Facts
- 2.3. Supply-Demand Analysis
- 2.4. Competitive Benchmarking
- 2.5. Go-to- Market Strategy
- 2.5.1. Customer/ End-use Industry Assessment
- 2.5.2. Growth Opportunity Data, 2026-2035
- 2.5.2.1. Regional Data
- 2.5.2.2. Country Data
- 2.5.2.3. Segmental Data
- 2.5.3. Identification of Potential Market Spaces
- 2.5.4. GAP Analysis
- 2.5.5. Potential Attractive Price Points
- 2.5.6. Prevailing Market Risks & Challenges
- 2.5.7. Preferred Sales & Marketing Strategies
- 2.5.8. Key Recommendations and Analysis
- 2.5.9. A Way Forward
- 2.1. Global Biobased Chemicals Market Outlook
- 3. Industry Data and Premium Insights
- 3.1. Global Chemicals & Materials Industry Overview, 2025
- 3.1.1. Chemicals & Materials Industry Ecosystem Analysis
- 3.1.2. Key Trends for Chemicals & Materials Industry
- 3.1.3. Regional Distribution for Chemicals & Materials Industry
- 3.2. Supplier Customer Data
- 3.3. Technology Roadmap and Developments
- 3.4. Trade Analysis
- 3.4.1. Import & Export Analysis, 2025
- 3.4.2. Top Importing Countries
- 3.4.3. Top Exporting Countries
- 3.5. Trump Tariff Impact Analysis
- 3.5.1. Manufacturer
- 3.5.1.1. Based on the raw material
- 3.5.2. Supply Chain
- 3.5.3. End Consumer
- 3.5.1. Manufacturer
- 3.6. Raw Material Analysis
- 3.1. Global Chemicals & Materials Industry Overview, 2025
- 4. Market Overview
- 4.1. Market Dynamics
- 4.1.1. Drivers
- 4.1.1.1. Rising regulatory pressure to reduce carbon emissions and fossil fuel dependency
- 4.1.1.2. Growing consumer demand for sustainable and eco-friendly products
- 4.1.1.3. Expanding bio-refinery technologies improving cost efficiency and scalability
- 4.1.2. Restraints
- 4.1.2.1. High production costs compared to petrochemical alternatives
- 4.1.2.2. Limited feedstock availability and supply chain volatility
- 4.1.1. Drivers
- 4.2. Key Trend Analysis
- 4.3. Regulatory Framework
- 4.3.1. Key Regulations, Norms, and Subsidies, by Key Countries
- 4.3.2. Tariffs and Standards
- 4.3.3. Impact Analysis of Regulations on the Market
- 4.4. Value Chain Analysis/ Ecosystem Analysis
- 4.4.1. Raw Material Suppliers
- 4.4.2. Biobased Chemical Manufacturers
- 4.4.3. Distributors
- 4.4.4. End Users/ Customers
- 4.5. Porter’s Five Forces Analysis
- 4.6. PESTEL Analysis
- 4.7. Global Biobased Chemicals Market Demand
- 4.7.1. Historical Market Size – Volume (Tons) & Value (US$ Bn), 2020-2024
- 4.7.2. Current and Future Market Size - Volume (Tons) & Value (US$ Bn), 2026–2035
- 4.7.2.1. Y-o-Y Growth Trends
- 4.7.2.2. Absolute $ Opportunity Assessment
- 4.1. Market Dynamics
- 5. Competition Landscape
- 5.1. Competition structure
- 5.1.1. Fragmented v/s consolidated
- 5.2. Company Share Analysis, 2025
- 5.2.1. Global Company Market Share
- 5.2.2. By Region
- 5.2.2.1. North America
- 5.2.2.2. Europe
- 5.2.2.3. Asia Pacific
- 5.2.2.4. Middle East
- 5.2.2.5. Africa
- 5.2.2.6. South America
- 5.3. Product Comparison Matrix
- 5.3.1. Specifications
- 5.3.2. Market Positioning
- 5.3.3. Pricing
- 5.1. Competition structure
- 6. Global Biobased Chemicals Market Analysis, by Product Type
- 6.1. Key Segment Analysis
- 6.2. Biobased Chemicals Market Size Volume (Tons) & Value (US$ Bn), Analysis, and Forecasts, by Product Type, 2021-2035
- 6.2.1. Bio-Based Platform Chemicals
- 6.2.2. Bio-Based Solvents
- 6.2.3. Bio-Based Polymers & Polymer Precursors
- 6.2.4. Bio-Based Surfactants
- 6.2.5. Bio-Based Fatty Acids & Derivatives
- 6.2.6. Bio-Based Alcohols
- 6.2.7. Bio-Based Organic Acids
- 6.2.8. Bio-Based Resins & Adhesives
- 6.2.9. Bio-Based Specialty/Fine Chemicals
- 6.2.10. Bio-Based Lubricants & Base Oils
- 6.2.11. Others
- 7. Global Biobased Chemicals Market Analysis, by Feedstock
- 7.1. Key Segment Analysis
- 7.2. Biobased Chemicals Market Size Volume (Tons) & Value (US$ Bn), Analysis, and Forecasts, by Feedstock, 2021-2035
- 7.2.1. Sugar & Starch-Based Feedstock
- 7.2.2. Lignocellulosic Biomass
- 7.2.3. Oils & Fats
- 7.2.4. Waste & Secondary Feedstock
- 7.2.5. CO₂ & Syngas (Carbon Capture-Derived)
- 7.2.6. Algae & Microorganisms
- 7.2.7. Others
- 8. Global Biobased Chemicals Market Analysis, by Conversion Technology
- 8.1. Key Segment Analysis
- 8.2. Biobased Chemicals Market Size Volume (Tons) & Value (US$ Bn), Analysis, and Forecasts, by Conversion Technology, 2021-2035
- 8.2.1. Biochemical Conversion
- 8.2.2. Chemical Catalytic Conversion
- 8.2.3. Integrated Conversion Technologies
- 9. Global Biobased Chemicals Market Analysis, by Form
- 9.1. Key Segment Analysis
- 9.2. Biobased Chemicals Market Size Volume (Tons) & Value (US$ Bn), Analysis, and Forecasts, by Form, 2021-2035
- 9.2.1. Liquid
- 9.2.2. Solid / Powder / Granules
- 9.2.3. Gas / Gaseous Phase
- 9.2.4. Paste / Gel
- 10. Global Biobased Chemicals Market Analysis, by End-Use Industry
- 10.1. Key Segment Analysis
- 10.2. Biobased Chemicals Market Size Volume (Tons) & Value (US$ Bn), Analysis, and Forecasts, by End-Use Industry, 2021-2035
- 10.2.1. Agriculture & Agrochemicals
- 10.2.2. Food & Beverage Processing
- 10.2.3. Personal Care & Cosmetics
- 10.2.4. Pharmaceuticals & Nutraceuticals
- 10.2.5. Textile & Apparel
- 10.2.6. Automotive & Transportation
- 10.2.7. Construction & Infrastructure
- 10.2.8. Electronics & Electrical
- 10.2.9. Paints, Coatings & Inks
- 10.2.10. Adhesives & Sealants
- 10.2.11. Biofuels & Energy
- 10.2.12. Consumer Goods & Retail
- 10.2.13. Healthcare & Medical Devices
- 10.2.14. Animal Feed & Nutrition
- 10.2.15. Others
- 11. Global Biobased Chemicals Market Analysis and Forecasts, by Region
- 11.1. Key Findings
- 11.2. Biobased Chemicals Market Size Volume (Tons) & Value (US$ Bn), Analysis, and Forecasts, by Region, 2021-2035
- 11.2.1. North America
- 11.2.2. Europe
- 11.2.3. Asia Pacific
- 11.2.4. Middle East
- 11.2.5. Africa
- 11.2.6. South America
- 12. North America Biobased Chemicals Market Analysis
- 12.1. Key Segment Analysis
- 12.2. Regional Snapshot
- 12.3. North America Biobased Chemicals Market Size- Volume (Tons) & Value (US$ Bn), Analysis, and Forecasts, 2021-2035
- 12.3.1. Product Type
- 12.3.2. Feedstock
- 12.3.3. Conversion Technology
- 12.3.4. Form
- 12.3.5. End-use Industry
- 12.3.6. Country
- 12.3.6.1. USA
- 12.3.6.2. Canada
- 12.3.6.3. Mexico
- 12.4. USA Biobased Chemicals Market
- 12.4.1. Country Segmental Analysis
- 12.4.2. Product Type
- 12.4.3. Feedstock
- 12.4.4. Conversion Technology
- 12.4.5. Form
- 12.4.6. End-use Industry
- 12.5. Canada Biobased Chemicals Market
- 12.5.1. Country Segmental Analysis
- 12.5.2. Product Type
- 12.5.3. Feedstock
- 12.5.4. Conversion Technology
- 12.5.5. Form
- 12.5.6. End-use Industry
- 12.6. Mexico Biobased Chemicals Market
- 12.6.1. Country Segmental Analysis
- 12.6.2. Product Type
- 12.6.3. Feedstock
- 12.6.4. Conversion Technology
- 12.6.5. Form
- 12.6.6. End-use Industry
- 13. Europe Biobased Chemicals Market Analysis
- 13.1. Key Segment Analysis
- 13.2. Regional Snapshot
- 13.3. Europe Biobased Chemicals Market Size Volume (Tons) & Value (US$ Bn), Analysis, and Forecasts, 2021-2035
- 13.3.1. Product Type
- 13.3.2. Feedstock
- 13.3.3. Conversion Technology
- 13.3.4. Form
- 13.3.5. End-use Industry
- 13.3.6. Country
- 13.3.6.1. Germany
- 13.3.6.2. United Kingdom
- 13.3.6.3. France
- 13.3.6.4. Italy
- 13.3.6.5. Spain
- 13.3.6.6. Netherlands
- 13.3.6.7. Nordic Countries
- 13.3.6.8. Poland
- 13.3.6.9. Russia & CIS
- 13.3.6.10. Rest of Europe
- 13.4. Germany Biobased Chemicals Market
- 13.4.1. Country Segmental Analysis
- 13.4.2. Product Type
- 13.4.3. Feedstock
- 13.4.4. Conversion Technology
- 13.4.5. Form
- 13.4.6. End-use Industry
- 13.5. United Kingdom Biobased Chemicals Market
- 13.5.1. Country Segmental Analysis
- 13.5.2. Product Type
- 13.5.3. Feedstock
- 13.5.4. Conversion Technology
- 13.5.5. Form
- 13.5.6. End-use Industry
- 13.6. France Biobased Chemicals Market
- 13.6.1. Country Segmental Analysis
- 13.6.2. Product Type
- 13.6.3. Feedstock
- 13.6.4. Conversion Technology
- 13.6.5. Form
- 13.6.6. End-use Industry
- 13.7. Italy Biobased Chemicals Market
- 13.7.1. Country Segmental Analysis
- 13.7.2. Product Type
- 13.7.3. Feedstock
- 13.7.4. Conversion Technology
- 13.7.5. Form
- 13.7.6. End-use Industry
- 13.8. Spain Biobased Chemicals Market
- 13.8.1. Country Segmental Analysis
- 13.8.2. Product Type
- 13.8.3. Feedstock
- 13.8.4. Conversion Technology
- 13.8.5. Form
- 13.8.6. End-use Industry
- 13.9. Netherlands Biobased Chemicals Market
- 13.9.1. Country Segmental Analysis
- 13.9.2. Product Type
- 13.9.3. Feedstock
- 13.9.4. Conversion Technology
- 13.9.5. Form
- 13.9.6. End-use Industry
- 13.10. Nordic Countries Biobased Chemicals Market
- 13.10.1. Country Segmental Analysis
- 13.10.2. Product Type
- 13.10.3. Feedstock
- 13.10.4. Conversion Technology
- 13.10.5. Form
- 13.10.6. End-use Industry
- 13.11. Poland Biobased Chemicals Market
- 13.11.1. Country Segmental Analysis
- 13.11.2. Product Type
- 13.11.3. Feedstock
- 13.11.4. Conversion Technology
- 13.11.5. Form
- 13.11.6. End-use Industry
- 13.12. Russia & CIS Biobased Chemicals Market
- 13.12.1. Country Segmental Analysis
- 13.12.2. Product Type
- 13.12.3. Feedstock
- 13.12.4. Conversion Technology
- 13.12.5. Form
- 13.12.6. End-use Industry
- 13.13. Rest of Europe Biobased Chemicals Market
- 13.13.1. Country Segmental Analysis
- 13.13.2. Product Type
- 13.13.3. Feedstock
- 13.13.4. Conversion Technology
- 13.13.5. Form
- 13.13.6. End-use Industry
- 14. Asia Pacific Biobased Chemicals Market Analysis
- 14.1. Key Segment Analysis
- 14.2. Regional Snapshot
- 14.3. Asia Pacific Biobased Chemicals Market Size Volume (Tons) & Value (US$ Bn), Analysis, and Forecasts, 2021-2035
- 14.3.1. Product Type
- 14.3.2. Feedstock
- 14.3.3. Conversion Technology
- 14.3.4. Form
- 14.3.5. End-use Industry
- 14.3.6. Country
- 14.3.6.1. China
- 14.3.6.2. India
- 14.3.6.3. Japan
- 14.3.6.4. South Korea
- 14.3.6.5. Australia and New Zealand
- 14.3.6.6. Indonesia
- 14.3.6.7. Malaysia
- 14.3.6.8. Thailand
- 14.3.6.9. Vietnam
- 14.3.6.10. Rest of Asia Pacific
- 14.4. China Biobased Chemicals Market
- 14.4.1. Country Segmental Analysis
- 14.4.2. Product Type
- 14.4.3. Feedstock
- 14.4.4. Conversion Technology
- 14.4.5. Form
- 14.4.6. End-use Industry
- 14.5. India Biobased Chemicals Market
- 14.5.1. Country Segmental Analysis
- 14.5.2. Product Type
- 14.5.3. Feedstock
- 14.5.4. Conversion Technology
- 14.5.5. Form
- 14.5.6. End-use Industry
- 14.6. Japan Biobased Chemicals Market
- 14.6.1. Country Segmental Analysis
- 14.6.2. Product Type
- 14.6.3. Feedstock
- 14.6.4. Conversion Technology
- 14.6.5. Form
- 14.6.6. End-use Industry
- 14.7. South Korea Biobased Chemicals Market
- 14.7.1. Country Segmental Analysis
- 14.7.2. Product Type
- 14.7.3. Feedstock
- 14.7.4. Conversion Technology
- 14.7.5. Form
- 14.7.6. End-use Industry
- 14.8. Australia and New Zealand Biobased Chemicals Market
- 14.8.1. Country Segmental Analysis
- 14.8.2. Product Type
- 14.8.3. Feedstock
- 14.8.4. Conversion Technology
- 14.8.5. Form
- 14.8.6. End-use Industry
- 14.9. Indonesia Biobased Chemicals Market
- 14.9.1. Country Segmental Analysis
- 14.9.2. Product Type
- 14.9.3. Feedstock
- 14.9.4. Conversion Technology
- 14.9.5. Form
- 14.9.6. End-use Industry
- 14.10. Malaysia Biobased Chemicals Market
- 14.10.1. Country Segmental Analysis
- 14.10.2. Product Type
- 14.10.3. Feedstock
- 14.10.4. Conversion Technology
- 14.10.5. Form
- 14.10.6. End-use Industry
- 14.11. Thailand Biobased Chemicals Market
- 14.11.1. Country Segmental Analysis
- 14.11.2. Product Type
- 14.11.3. Feedstock
- 14.11.4. Conversion Technology
- 14.11.5. Form
- 14.11.6. End-use Industry
- 14.12. Vietnam Biobased Chemicals Market
- 14.12.1. Country Segmental Analysis
- 14.12.2. Product Type
- 14.12.3. Feedstock
- 14.12.4. Conversion Technology
- 14.12.5. Form
- 14.12.6. End-use Industry
- 14.13. Rest of Asia Pacific Biobased Chemicals Market
- 14.13.1. Country Segmental Analysis
- 14.13.2. Product Type
- 14.13.3. Feedstock
- 14.13.4. Conversion Technology
- 14.13.5. Form
- 14.13.6. End-use Industry
- 15. Middle East Biobased Chemicals Market Analysis
- 15.1. Key Segment Analysis
- 15.2. Regional Snapshot
- 15.3. Middle East Biobased Chemicals Market Size Volume (Tons) & Value (US$ Bn), Analysis, and Forecasts, 2021-2035
- 15.3.1. Product Type
- 15.3.2. Feedstock
- 15.3.3. Conversion Technology
- 15.3.4. Form
- 15.3.5. End-use Industry
- 15.3.6. Country
- 15.3.6.1. Turkey
- 15.3.6.2. UAE
- 15.3.6.3. Saudi Arabia
- 15.3.6.4. Israel
- 15.3.6.5. Rest of Middle East
- 15.4. Turkey Biobased Chemicals Market
- 15.4.1. Country Segmental Analysis
- 15.4.2. Product Type
- 15.4.3. Feedstock
- 15.4.4. Conversion Technology
- 15.4.5. Form
- 15.4.6. End-use Industry
- 15.5. UAE Biobased Chemicals Market
- 15.5.1. Country Segmental Analysis
- 15.5.2. Product Type
- 15.5.3. Feedstock
- 15.5.4. Conversion Technology
- 15.5.5. Form
- 15.5.6. End-use Industry
- 15.6. Saudi Arabia Biobased Chemicals Market
- 15.6.1. Country Segmental Analysis
- 15.6.2. Product Type
- 15.6.3. Feedstock
- 15.6.4. Conversion Technology
- 15.6.5. Form
- 15.6.6. End-use Industry
- 15.7. Israel Biobased Chemicals Market
- 15.7.1. Country Segmental Analysis
- 15.7.2. Product Type
- 15.7.3. Feedstock
- 15.7.4. Conversion Technology
- 15.7.5. Form
- 15.7.6. End-use Industry
- 15.8. Rest of Middle East Biobased Chemicals Market
- 15.8.1. Country Segmental Analysis
- 15.8.2. Product Type
- 15.8.3. Feedstock
- 15.8.4. Conversion Technology
- 15.8.5. Form
- 15.8.6. End-use Industry
- 16. Africa Biobased Chemicals Market Analysis
- 16.1. Key Segment Analysis
- 16.2. Regional Snapshot
- 16.3. Africa Biobased Chemicals Market Size Volume (Tons) & Value (US$ Bn), Analysis, and Forecasts, 2021-2035
- 16.3.1. Product Type
- 16.3.2. Feedstock
- 16.3.3. Conversion Technology
- 16.3.4. Form
- 16.3.5. End-use Industry
- 16.3.6. Country
- 16.3.6.1. South Africa
- 16.3.6.2. Egypt
- 16.3.6.3. Nigeria
- 16.3.6.4. Algeria
- 16.3.6.5. Rest of Africa
- 16.4. South Africa Biobased Chemicals Market
- 16.4.1. Country Segmental Analysis
- 16.4.2. Product Type
- 16.4.3. Feedstock
- 16.4.4. Conversion Technology
- 16.4.5. Form
- 16.4.6. End-use Industry
- 16.5. Egypt Biobased Chemicals Market
- 16.5.1. Country Segmental Analysis
- 16.5.2. Product Type
- 16.5.3. Feedstock
- 16.5.4. Conversion Technology
- 16.5.5. Form
- 16.5.6. End-use Industry
- 16.6. Nigeria Biobased Chemicals Market
- 16.6.1. Country Segmental Analysis
- 16.6.2. Product Type
- 16.6.3. Feedstock
- 16.6.4. Conversion Technology
- 16.6.5. Form
- 16.6.6. End-use Industry
- 16.7. Algeria Biobased Chemicals Market
- 16.7.1. Country Segmental Analysis
- 16.7.2. Product Type
- 16.7.3. Feedstock
- 16.7.4. Conversion Technology
- 16.7.5. Form
- 16.7.6. End-use Industry
- 16.8. Rest of Africa Biobased Chemicals Market
- 16.8.1. Country Segmental Analysis
- 16.8.2. Product Type
- 16.8.3. Feedstock
- 16.8.4. Conversion Technology
- 16.8.5. Form
- 16.8.6. End-use Industry
- 17. South America Biobased Chemicals Market Analysis
- 17.1. Key Segment Analysis
- 17.2. Regional Snapshot
- 17.3. South America Biobased Chemicals Market Size Volume (Tons) & Value (US$ Bn), Analysis, and Forecasts, 2021-2035
- 17.3.1. Product Type
- 17.3.2. Feedstock
- 17.3.3. Conversion Technology
- 17.3.4. Form
- 17.3.5. End-use Industry
- 17.3.6. Country
- 17.3.6.1. Brazil
- 17.3.6.2. Argentina
- 17.3.6.3. Rest of South America
- 17.4. Brazil Biobased Chemicals Market
- 17.4.1. Country Segmental Analysis
- 17.4.2. Product Type
- 17.4.3. Feedstock
- 17.4.4. Conversion Technology
- 17.4.5. Form
- 17.4.6. End-use Industry
- 17.5. Argentina Biobased Chemicals Market
- 17.5.1. Country Segmental Analysis
- 17.5.2. Product Type
- 17.5.3. Feedstock
- 17.5.4. Conversion Technology
- 17.5.5. Form
- 17.5.6. End-use Industry
- 17.6. Rest of South America Biobased Chemicals Market
- 17.6.1. Country Segmental Analysis
- 17.6.2. Product Type
- 17.6.3. Feedstock
- 17.6.4. Conversion Technology
- 17.6.5. Form
- 17.6.6. End-use Industry
- 18. Key Players/ Company Profile
- 18.1. BASF SE
- 18.1.1. Company Details/ Overview
- 18.1.2. Company Financials
- 18.1.3. Key Customers and Competitors
- 18.1.4. Business/ Industry Portfolio
- 18.1.5. Product Portfolio/ Specification Details
- 18.1.6. Pricing Data
- 18.1.7. Strategic Overview
- 18.1.8. Recent Developments
- 18.2. Archer Daniels Midland Company (ADM)
- 18.3. Avantium N.V.
- 18.4. Braskem S.A.
- 18.5. Cargill Incorporated
- 18.6. Corbion N.V.
- 18.7. Danimer Scientific
- 18.8. DSM-Firmenich AG
- 18.9. Eastman Chemical Company
- 18.10. Evonik Industries AG
- 18.11. Genomatica, Inc.
- 18.12. Gevo, Inc.
- 18.13. Indorama Ventures Public Company Limited
- 18.14. LanzaTech Global, Inc.
- 18.15. Mitsubishi Chemical Group Corporation
- 18.16. NatureWorks LLC
- 18.17. Novamont S.p.A.
- 18.18. Roquette Frères S.A.
- 18.19. Solvay S.A.
- 18.20. Toray Industries, Inc.
- 18.21. Other Key Players
- 18.1. BASF SE
Note* - This is just tentative list of players. While providing the report, we will cover more number of players based on their revenue and share for each geography
Research Design
Our research design integrates both demand-side and supply-side analysis through a balanced combination of primary and secondary research methodologies. By utilizing both bottom-up and top-down approaches alongside rigorous data triangulation methods, we deliver robust market intelligence that supports strategic decision-making.
MarketGenics' comprehensive research design framework ensures the delivery of accurate, reliable, and actionable market intelligence. Through the integration of multiple research approaches, rigorous validation processes, and expert analysis, we provide our clients with the insights needed to make informed strategic decisions and capitalize on market opportunities.

MarketGenics leverages a dedicated industry panel of experts and a comprehensive suite of paid databases to effectively collect, consolidate, and analyze market intelligence.
Our approach has consistently proven to be reliable and effective in generating accurate market insights, identifying key industry trends, and uncovering emerging business opportunities.
Through both primary and secondary research, we capture and analyze critical company-level data such as manufacturing footprints, including technical centers, R&D facilities, sales offices, and headquarters.
Our expert panel further enhances our ability to estimate market size for specific brands based on validated field-level intelligence.
Our data mining techniques incorporate both parametric and non-parametric methods, allowing for structured data collection, sorting, processing, and cleaning.
Demand projections are derived from large-scale data sets analyzed through proprietary algorithms, culminating in robust and reliable market sizing.
Research Approach
The bottom-up approach builds market estimates by starting with the smallest addressable market units and systematically aggregating them to create comprehensive market size projections.
This method begins with specific, granular data points and builds upward to create the complete market landscape.
Customer Analysis → Segmental Analysis → Geographical Analysis
The top-down approach starts with the broadest possible market data and systematically narrows it down through a series of filters and assumptions to arrive at specific market segments or opportunities.
This method begins with the big picture and works downward to increasingly specific market slices.
TAM → SAM → SOM


Research Methods
Desk / Secondary Research
While analysing the market, we extensively study secondary sources, directories, and databases to identify and collect information useful for this technical, market-oriented, and commercial report. Secondary sources that we utilize are not only the public sources, but it is a combination of Open Source, Associations, Paid Databases, MG Repository & Knowledgebase, and others.
- Company websites, annual reports, financial reports, broker reports, and investor presentations
- National government documents, statistical databases and reports
- News articles, press releases and web-casts specific to the companies operating in the market, Magazines, reports, and others
- We gather information from commercial data sources for deriving company specific data such as segmental revenue, share for geography, product revenue, and others
- Internal and external proprietary databases (industry-specific), relevant patent, and regulatory databases
- Governing Bodies, Government Organizations
- Relevant Authorities, Country-specific Associations for Industries
We also employ the model mapping approach to estimate the product level market data through the players' product portfolio
Primary Research
Primary research/ interviews is vital in analyzing the market. Most of the cases involves paid primary interviews. Primary sources include primary interviews through e-mail interactions, telephonic interviews, surveys as well as face-to-face interviews with the different stakeholders across the value chain including several industry experts.
| Type of Respondents | Number of Primaries |
|---|---|
| Tier 2/3 Suppliers | ~20 |
| Tier 1 Suppliers | ~25 |
| End-users | ~25 |
| Industry Expert/ Panel/ Consultant | ~30 |
| Total | ~100 |
MG Knowledgebase
• Repository of industry blog, newsletter and case studies
• Online platform covering detailed market reports, and company profiles
Forecasting Factors and Models
Forecasting Factors
- Historical Trends – Past market patterns, cycles, and major events that shaped how markets behave over time. Understanding past trends helps predict future behavior.
- Industry Factors – Specific characteristics of the industry like structure, regulations, and innovation cycles that affect market dynamics.
- Macroeconomic Factors – Economic conditions like GDP growth, inflation, and employment rates that affect how much money people have to spend.
- Demographic Factors – Population characteristics like age, income, and location that determine who can buy your product.
- Technology Factors – How quickly people adopt new technology and how much technology infrastructure exists.
- Regulatory Factors – Government rules, laws, and policies that can help or restrict market growth.
- Competitive Factors – Analyzing competition structure such as degree of competition and bargaining power of buyers and suppliers.
Forecasting Models / Techniques
Multiple Regression Analysis
- Identify and quantify factors that drive market changes
- Statistical modeling to establish relationships between market drivers and outcomes
Time Series Analysis – Seasonal Patterns
- Understand regular cyclical patterns in market demand
- Advanced statistical techniques to separate trend, seasonal, and irregular components
Time Series Analysis – Trend Analysis
- Identify underlying market growth patterns and momentum
- Statistical analysis of historical data to project future trends
Expert Opinion – Expert Interviews
- Gather deep industry insights and contextual understanding
- In-depth interviews with key industry stakeholders
Multi-Scenario Development
- Prepare for uncertainty by modeling different possible futures
- Creating optimistic, pessimistic, and most likely scenarios
Time Series Analysis – Moving Averages
- Sophisticated forecasting for complex time series data
- Auto-regressive integrated moving average models with seasonal components
Econometric Models
- Apply economic theory to market forecasting
- Sophisticated economic models that account for market interactions
Expert Opinion – Delphi Method
- Harness collective wisdom of industry experts
- Structured, multi-round expert consultation process
Monte Carlo Simulation
- Quantify uncertainty and probability distributions
- Thousands of simulations with varying input parameters
Research Analysis
Our research framework is built upon the fundamental principle of validating market intelligence from both demand and supply perspectives. This dual-sided approach ensures comprehensive market understanding and reduces the risk of single-source bias.
Demand-Side Analysis: We understand end-user/application behavior, preferences, and market needs along with the penetration of the product for specific application.
Supply-Side Analysis: We estimate overall market revenue, analyze the segmental share along with industry capacity, competitive landscape, and market structure.
Validation & Evaluation
Data triangulation is a validation technique that uses multiple methods, sources, or perspectives to examine the same research question, thereby increasing the credibility and reliability of research findings. In market research, triangulation serves as a quality assurance mechanism that helps identify and minimize bias, validate assumptions, and ensure accuracy in market estimates.
- Data Source Triangulation – Using multiple data sources to examine the same phenomenon
- Methodological Triangulation – Using multiple research methods to study the same research question
- Investigator Triangulation – Using multiple researchers or analysts to examine the same data
- Theoretical Triangulation – Using multiple theoretical perspectives to interpret the same data

Custom Market Research Services
We will customise the research for you, in case the report listed above does not meet your requirements.
Get 10% Free Customisation