Electronic Ceramics Market Size, Share & Trends Analysis Report by Material Type (Aluminum Oxide, Zirconium Oxide, Titanium Dioxide, Silicon Carbide, Silicon Nitride, Barium Titanate, Lead Zirconate Titanate, Steatite, Cordierite, Mullite, Others), Product Type, Dielectric Properties, Voltage Rating, Temperature Coefficient, Form Factor, End-Use Industry, and Geography (North America, Europe, Asia Pacific, Middle East, Africa, and South America) – Global Industry Data, Trends, and Forecasts, 2026–2035
|
|
|
Segmental Data Insights |
|
|
Demand Trends |
|
|
Competitive Landscape |
|
|
Strategic Development |
|
|
Future Outlook & Opportunities |
|
Electronic Ceramics Market Size, Share, and Growth
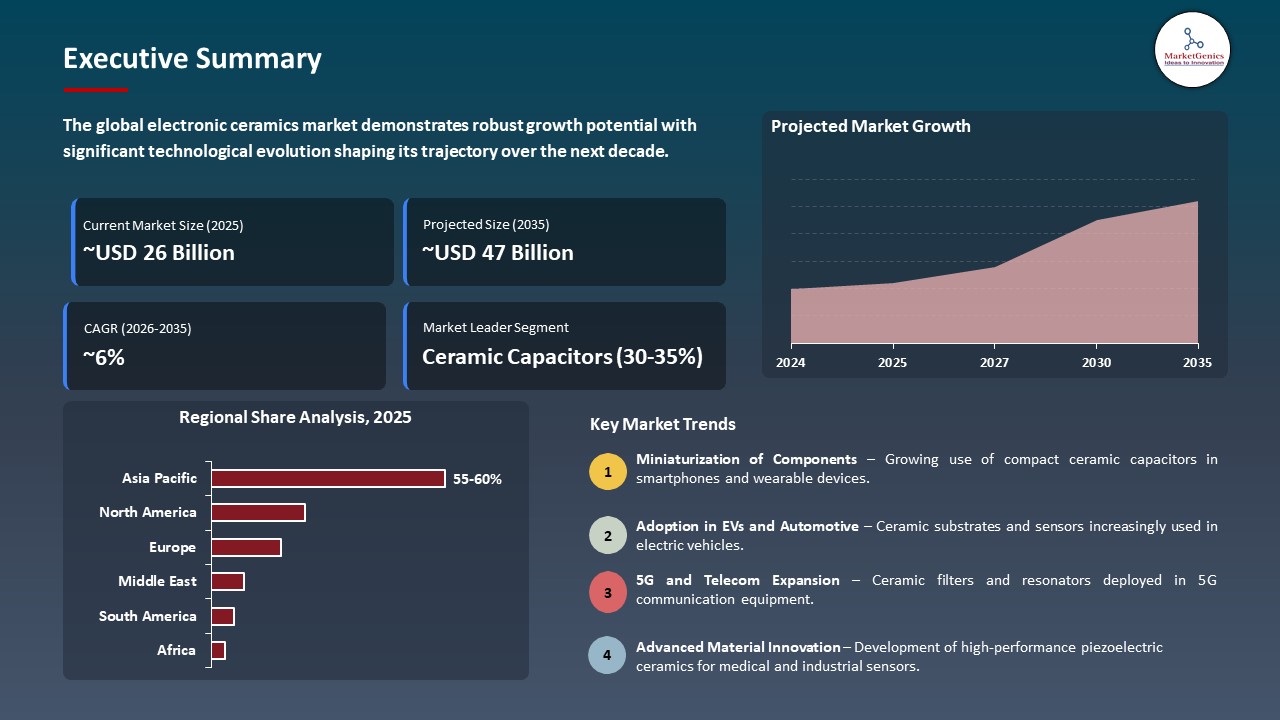
The global electronic ceramics market is experiencing robust growth, with its estimated value of USD 26.3 billion in the year 2025 and USD 46.7 billion by 2035, registering a CAGR of 5.9%, during the forecast period. The global electronic ceramics market, driven by growing use in automotive, consumer electronics, and telecommunications, rising adoption of electric vehicles, miniaturization of devices, and increasing need for high-performance, reliable components like capacitors, sensors, and actuators.
Lee Jongchan, the President of Dongwoo Fine-Chem added, "It is very meaningful to have the opportunity to lead the advanced semiconductor package materials sector by integrating the technological capabilities of Samsung Electro-Mechanics and Dongwoo Fine-Chem. Based on the technology accumulated by Sumitomo Chemical, we will actively utilize our strong execution capabilities and infrastructure to ensure the success of this collaboration and grow into a leading company in advanced semiconductor packaging materials."
The development of the 5G network and the rise of EVs and sophisticated automotive electronics leads to the impetus of the electronic ceramics market. The 5G boom is driving the demand in low loss dielectric ceramics in filters, resonators, and antennas, causing manufacturers to produce more. For instance, in October 2025, Murata Manufacturing began a new plant in the Philippines to increase the production of multilayer ceramic capacitors (MLCC) to use in telecom and automobile applications. This growth will boost the market further because it will improve the supply and operation of hi-tech electronic components in telecommunication and automotive industries.
Additionally, the increased use of electric vehicles (EVs) is leading to the need of high-performance ceramic materials in power electronics and sensors. For instance, TDK Corporation has increased the scope of its CeraLink high voltage multilayer ceramic capacitors to support 800 V EV inverter and power converter applications, and specially developed AEC-Q200-qualified 900 V ceramic capacitors to serve the automotive power electronics market. This is boosting the electronic ceramics market through improving the performance and dependability of EV power electronics and sensor systems.
Key opportunities adjacent to the global electronic ceramics market include advanced sensors for IoT devices, solid-state batteries, 5G and 6G telecom components, electric vehicle power modules, and medical implantable devices. The trend in these fields is the greater use of high-performance ceramics to allow manufacturers to diversify application and spearhead technology. The move into these adjacent markets will boost growth and strategic value of electronic ceramics.
Electronic Ceramics Market Dynamics and Trends
Driver: Increasing Semiconductor Fabrication Demand for Ultra‑High Purity Ceramic Components
-
The high rate of growth of semiconductor production in the global market has greatly accelerated the pace of high purity, thermal stability as well as electrical reliability ceramic materials. These advanced ceramics find their use in wafer handling systems, plasma chambers and other semiconductor manufacture equipment that are utilized at extreme temperature and high-precision requirements.
- To fulfill such needs, major manufacturers are coming up with customized solutions that are more efficient and reliable. For instance, in 2025, Murata Manufacturing and Vishay Intertechnology had a strategic alliance jointly developing high-density multilayer ceramic capacitors (MLCCs) in automotive and industrial applications, showing the adoption of new ceramic technologies in high-performance electronic systems.
- This joint venture is a continuation of the larger tendency to integrate high performance ceramics in the fabrication of semiconductors to enhance efficiency, miniaturization and stability in systems.
- The ceramics embedded in precision electronic fabrication and high-performance systems are catalyzing the expansion of this semiconductor driven market by increasing their significance in the next generation electronics.
Restraint: Complex Production Costs and Material Supply Volatility
-
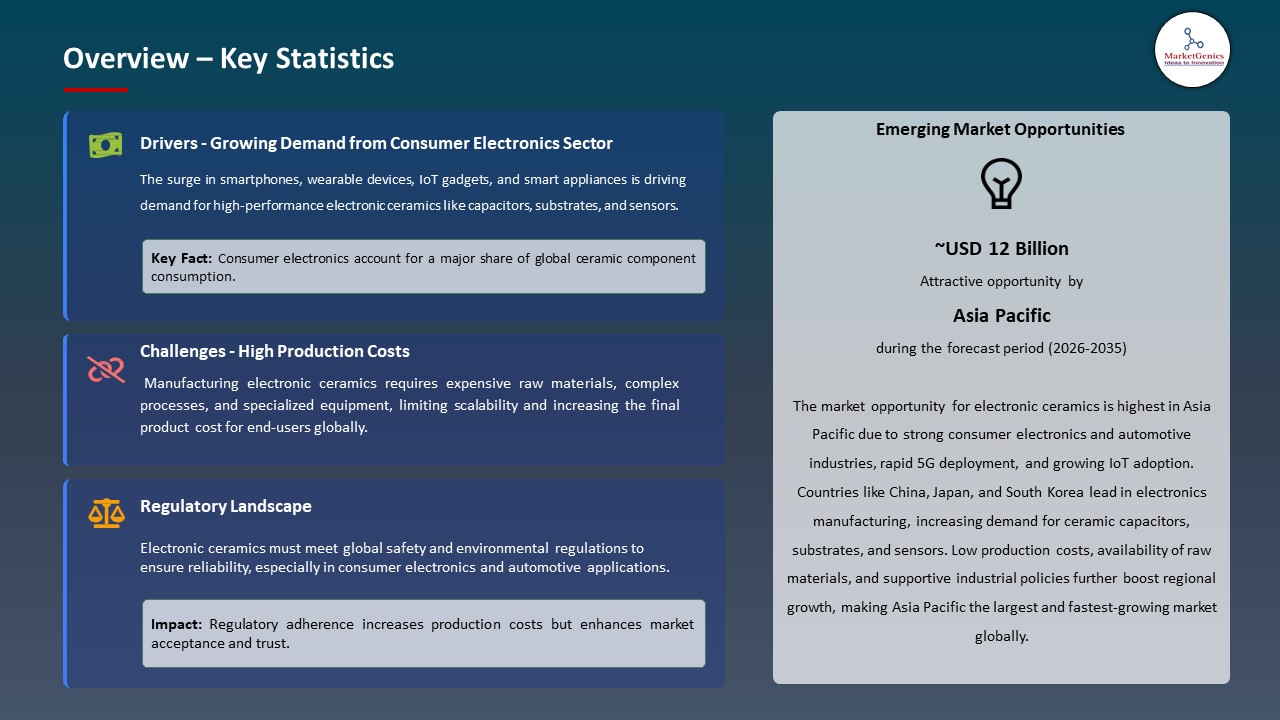
The process of producing electronic ceramics is very energy-consuming and also requires precision, including high-temperature sintering, controlled atmosphere, and high-end machining, significantly boosting capital spending and operational expenses. These are limiting wider adoption especially in cost-conscious segments and the emerging markets where affordability is paramount.
- Additionally, the high dependency of manufacturers on major raw materials, such as rare earth oxides, alumina, and zirconia, creates price volatility, supply risk, and geopolitical risk to the industry. For instance, the unexpected price rise in rare earths or problems with supply chain can disrupt the production timelines and affect profitability. This high production complexity coupled with the volatility of the raw materials poses a great challenge to the operational and financial needs of electronic ceramics manufacturing companies.
- These market penetration, profit margin pressure, and adoption speed constraints in price-competitive uses are caused by these cost and supply issues.
Opportunity: Innovation in Next‑Generation 5G and Aerospace Electronic Applications
-
The electronic ceramics market has vast potential due to the global trends in the development of advanced 5G infrastructure and fast-evolving aerospace electronics, where miniaturized, high-frequency and high-reliability parts are becoming more and more essential in these high-performance sectors. The filters, resonators, antennas, and power modules all require electronic ceramics to allow compact and efficient and long-lasting designs (telecom and aerospace).
- The major manufacturers are increasing the pace of innovation in order to exploit these opportunities. For instance, Kyocera displayed a set of multi-faceted advanced ceramic data center, AI devices, automotive, sensing, space, and wireless communications solutions at Electronica India 2025, and indicated that the company has the ability to satisfy the technical needs of new high-growth applications.
- This is anticipated to increase the market that can be addressed, increase the rate of technological acceptance and increase the long-term growth of revenues of electronic ceramics manufactures by expanding into the advanced telecom and aerospace electronics.
Key Trend: Miniaturization and High‑Frequency Performance Demands in Electronic Components
-
The current tendency toward increased miniaturization, enhanced power, and efficiency of electronic components, especially in the fields of 5G communications, IoT networks, automotive electronics, and wearable technologies, is considerably contributing to the rise in miniaturization, high frequency, and low loss ceramic components. Multilayer ceramic capacitors (MLCCs), XBAR filters and other advanced dielectric ceramics are also becoming a necessity to facilitate compact designs, high speed signal processing, thermal stability and noise cancellation in the next generation electronic systems.
- The major manufacturers are also positioning their products in ways that would satisfy this increasing demand. For instance, Murata Manufacturing has launched the first high-frequency XBAR filter optimized to 5G, Wi-Fi 7, and future 6G in the world, and it has been shown that it has a high degree of attention on the creation of components that can lead to miniaturization, improved performance, and future connectivity standards.
- This movement of miniaturization and high-frequency performance has greatly enhanced competitive differentiation, technological innovation, and expansion of the use of advanced ceramic materials in the state-of-the-art electronics across the world.
Electronic-Ceramics-Market Analysis and Segmental Data
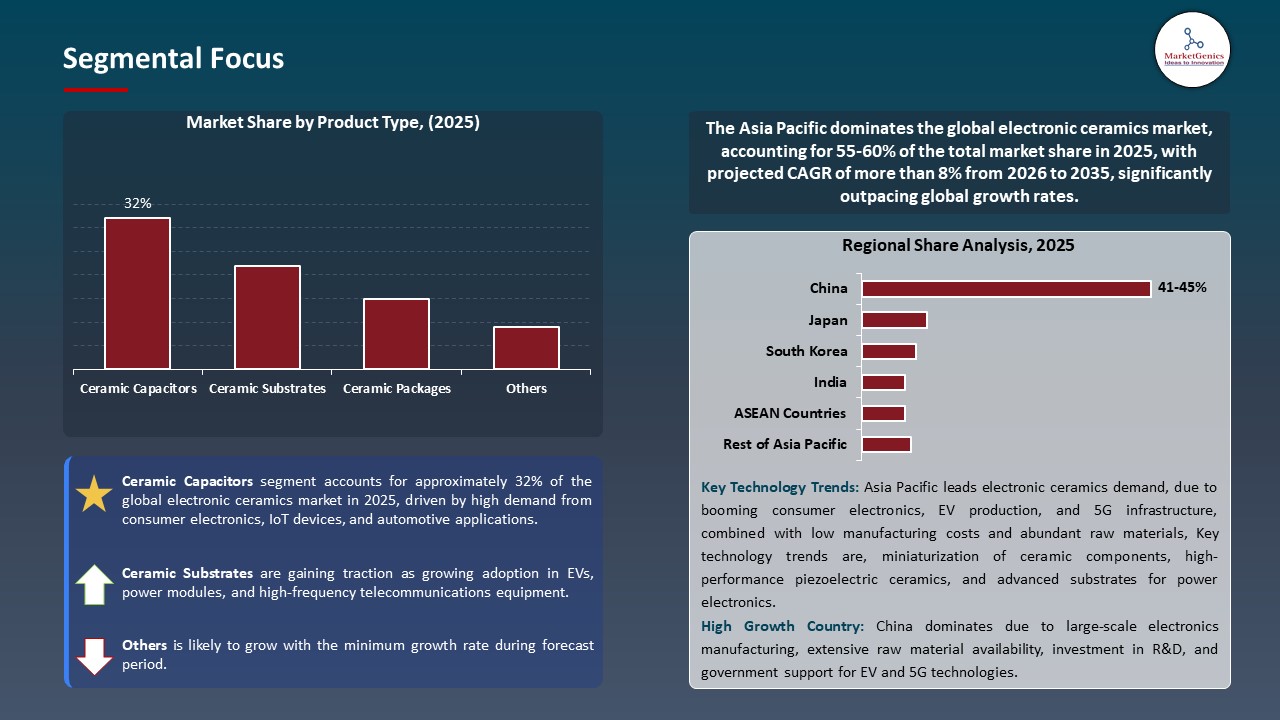
Ceramic Capacitors Dominate Global Electronic Ceramics Market
-
The ceramic capacitors segment dominates the global electronic ceramics market, owing to their flexibility, excellent performance, and significance in a contemporary electronics industry. These elements and multilayer ceramic capacitors (MLCCs) in particular are heavily employed in the storage of energy, noise, filtering, and signal integrity in devices as small as smart phones, computers, and as large as automotive ECUs and telecommunications equipment.
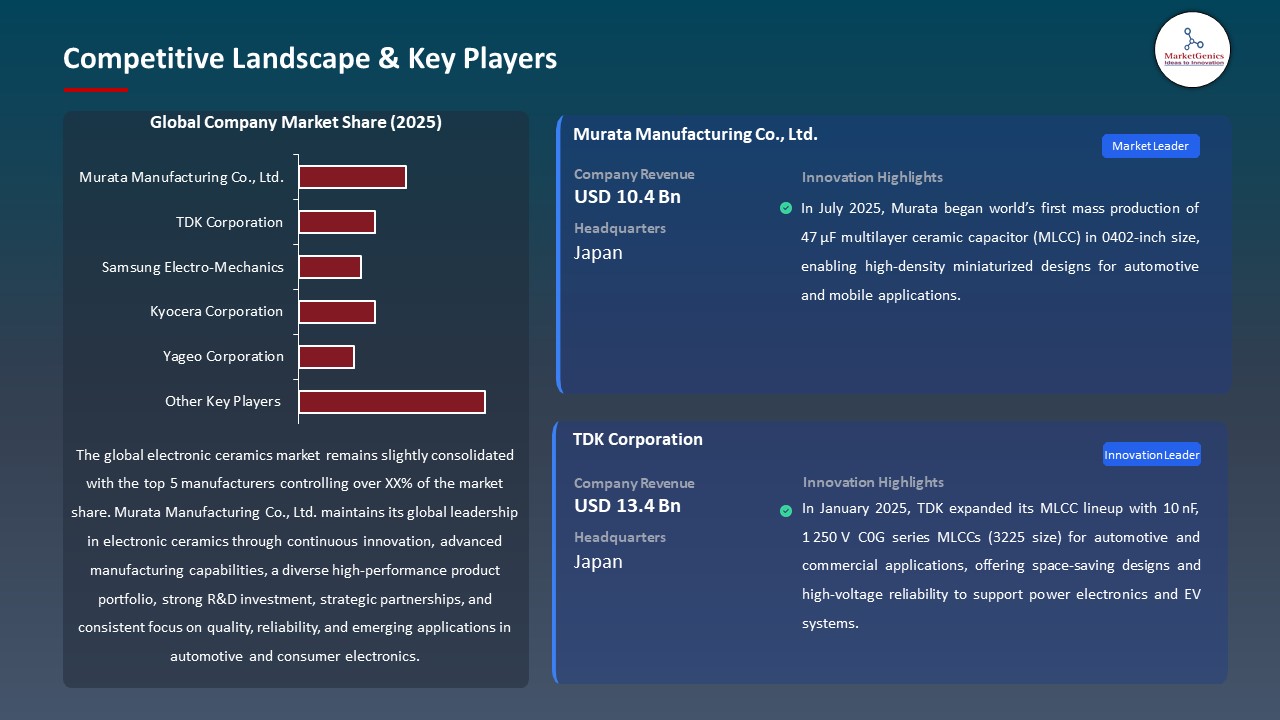
- The size of the MLCC is a large segment of total ceramic capacitor demand due to continued miniaturization and high-frequency operation demands in 5G, IoT, EVs, and advanced consumer electronics. For instance, in 2025, TDK Corporation started in mass production of new high-capacitance automotive MLCCs (10µF at 100 V in 3225 size) to contribute to the changing automotive power system, and this is an example of how major manufacturers are increasing their capabilities in this key market.
- The dominance of ceramic capacitors continues to support the strategic value of electronics systems becoming smaller and increasingly complicated, which is supporting the strong market growth.
Asia Pacific Leads Global Electronic Ceramics Market Demand
-
Asia Pacific leads the electronic ceramics market, as 5G networks are fast being implemented in Asia Pacific has gained a high demand on ceramic components with high-frequency performance and low dielectric loss which are crucial to RF filters, capacitors and antenna modules. The major players in the production of MLCC such as Samsung Electro-Mechanics have increased manufacturing of the product to 5G handsets and base stations, which demonstrates how local investment in telecommunications is fueling consumption of ceramics. This increased market growth through this 5G need is increasing the use of high-performance ceramics in high-speed telecom infrastructure.
- The growing rate of electric car and other higher automotive electronics uptake in Asia Pacific is driving power electronics, sensors and energy storage modules demand of ceramics. For instance, Murata Manufacturing expanded the capacity of ceramic capacitors in automotive applications to support the powertrain and ADAS of EVs and emerges as an illustration of how automotive electrification fosters the development of regional markets.
- The increased use of EV and automotive electronics is leading to the long-term growth of the market through greater demand on the high-performance ceramic components in future electric and autonomous cars.
Electronic-Ceramics-Market Ecosystem
The global electronic ceramics market is slightly consolidated, with high concentration among key players such as Murata Manufacturing Co., Ltd., TDK Corporation, Samsung Electro-Mechanics, Kyocera Corporation, and Yageo Corporation, dominates through high level of concentration and dominate the world market through advanced R&D, diversified high-performance products portfolio, strategic partnerships and superior manufacturing capabilities to support the rising automotive, consumer electronics, and industrial demand.
For instance, in March 2025, TDK announced increased portfolio of ceramic capacitors and piezoelectric components, which take advantage of automotive and ICT as major passive components, as a reflection of its current product development strategy. This growth gives a stronger market leadership through increased product offering and fulfilling the increasing demand in the automotive and electronic industries.
Recent Development and Strategic Overview:
-
In April 2025, Murata entered a collaboration with QuantumScape to explore high‑volume production of ceramic films for next‑gen solid‑state batteries, leveraging its ceramic manufacturing expertise to support electric vehicle battery innovation and scale advanced ceramic separator production
- In February 2025, Samsung Electro‑Mechanics launched the world’s first 10 V, 2.2 µF MLCC in 1005 size tailored for LiDAR and autonomous vehicle systems, meeting AEC‑Q200 automotive standards for stable power and precise signal handling in advanced sensor electronics.
Report Scope
|
Detail |
|
|
Market Size in 2025 |
USD 26.3 Bn |
|
Market Forecast Value in 2035 |
USD 46.7 Bn |
|
Growth Rate (CAGR) |
5.9% |
|
Forecast Period |
2026 – 2035 |
|
Historical Data Available for |
2021 – 2024 |
|
Market Size Units |
US$ Billion for Value |
|
Report Format |
Electronic (PDF) + Excel |
|
North America |
Europe |
Asia Pacific |
Middle East |
Africa |
South America |
|
|
|
|
|
|
|
Companies Covered |
|||||
|
|
|
|
|
|
Electronic-Ceramics-Market Segmentation and Highlights
|
Segment |
Sub-segment |
|
Electronic Ceramics Market, By Material Type |
|
|
Electronic Ceramics Market, By Product Type |
|
|
Electronic Ceramics Market, By Dielectric Properties |
|
|
Electronic Ceramics Market, By Voltage Rating |
|
|
Electronic Ceramics Market, By Temperature Coefficient |
|
|
Electronic Ceramics Market, By Form Factor |
|
|
Electronic Ceramics Market, By End-Use Industry |
|
Frequently Asked Questions
Table of Contents
- 1. Research Methodology and Assumptions
- 1.1. Definitions
- 1.2. Research Design and Approach
- 1.3. Data Collection Methods
- 1.4. Base Estimates and Calculations
- 1.5. Forecasting Models
- 1.5.1. Key Forecast Factors & Impact Analysis
- 1.6. Secondary Research
- 1.6.1. Open Sources
- 1.6.2. Paid Databases
- 1.6.3. Associations
- 1.7. Primary Research
- 1.7.1. Primary Sources
- 1.7.2. Primary Interviews with Stakeholders across Ecosystem
- 2. Executive Summary
- 2.1. Global Electronic Ceramics Market Outlook
- 2.1.1. Electronic Ceramics Market Size (Value - US$ Bn), and Forecasts, 2021-2035
- 2.1.2. Compounded Annual Growth Rate Analysis
- 2.1.3. Growth Opportunity Analysis
- 2.1.4. Segmental Share Analysis
- 2.1.5. Geographical Share Analysis
- 2.2. Market Analysis and Facts
- 2.3. Supply-Demand Analysis
- 2.4. Competitive Benchmarking
- 2.5. Go-to- Market Strategy
- 2.5.1. Customer/ End-use Industry Assessment
- 2.5.2. Growth Opportunity Data, 2026-2035
- 2.5.2.1. Regional Data
- 2.5.2.2. Country Data
- 2.5.2.3. Segmental Data
- 2.5.3. Identification of Potential Market Spaces
- 2.5.4. GAP Analysis
- 2.5.5. Potential Attractive Price Points
- 2.5.6. Prevailing Market Risks & Challenges
- 2.5.7. Preferred Sales & Marketing Strategies
- 2.5.8. Key Recommendations and Analysis
- 2.5.9. A Way Forward
- 2.1. Global Electronic Ceramics Market Outlook
- 3. Industry Data and Premium Insights
- 3.1. Global Chemical & Materials Industry Overview, 2025
- 3.1.1. Chemical & Materials Industry Ecosystem Analysis
- 3.1.2. Key Trends for Chemical & Materials Industry
- 3.1.3. Regional Distribution for Chemical & Materials Industry
- 3.2. Supplier Customer Data
- 3.3. Technology Roadmap and Developments
- 3.4. Trade Analysis
- 3.4.1. Import & Export Analysis, 2025
- 3.4.2. Top Importing Countries
- 3.4.3. Top Exporting Countries
- 3.5. Trump Tariff Impact Analysis
- 3.5.1. Manufacturer
- 3.5.1.1. Based on the component & Raw material
- 3.5.2. Supply Chain
- 3.5.3. End Consumer
- 3.5.1. Manufacturer
- 3.6. Raw Material Analysis
- 3.1. Global Chemical & Materials Industry Overview, 2025
- 4. Market Overview
- 4.1. Market Dynamics
- 4.1.1. Drivers
- 4.1.1.1. Growing demand from the consumer electronics sector (smartphones, wearables, IoT)
- 4.1.1.2. Expansion of telecommunications infrastructure, including 5G deployment
- 4.1.1.3. Increasing miniaturization and electrification trends in electronics and automotive (EVs, sensors, power modules)
- 4.1.2. Restraints
- 4.1.2.1. High production/manufacturing costs due to complex processes and expensive raw materials.
- 4.1.2.2. Supply chain vulnerabilities and raw material challenges, including price volatility and limited availability
- 4.1.1. Drivers
- 4.2. Key Trend Analysis
- 4.3. Regulatory Framework
- 4.3.1. Key Regulations, Norms, and Subsidies, by Key Countries
- 4.3.2. Tariffs and Standards
- 4.3.3. Impact Analysis of Regulations on the Market
- 4.4. Value Chain Analysis
- 4.4.1. Raw Material Suppliers
- 4.4.2. Electronic Ceramics Manufacturers
- 4.4.3. IDMs, ODMs, & OEMs
- 4.4.4. Dealers & Distributors
- 4.4.5. End-Users
- 4.5. Porter’s Five Forces Analysis
- 4.6. PESTEL Analysis
- 4.7. Global Electronic Ceramics Market Demand
- 4.7.1. Historical Market Size – Value (US$ Bn), 2020-2024
- 4.7.2. Current and Future Market Size – Value (US$ Bn), 2026–2035
- 4.7.2.1. Y-o-Y Growth Trends
- 4.7.2.2. Absolute $ Opportunity Assessment
- 4.1. Market Dynamics
- 5. Competition Landscape
- 5.1. Competition structure
- 5.1.1. Fragmented v/s consolidated
- 5.2. Company Share Analysis, 2025
- 5.2.1. Global Company Market Share
- 5.2.2. By Region
- 5.2.2.1. North America
- 5.2.2.2. Europe
- 5.2.2.3. Asia Pacific
- 5.2.2.4. Middle East
- 5.2.2.5. Africa
- 5.2.2.6. South America
- 5.3. Product Comparison Matrix
- 5.3.1. Specifications
- 5.3.2. Market Positioning
- 5.3.3. Pricing
- 5.1. Competition structure
- 6. Global Electronic Ceramics Market Analysis, by Material Type
- 6.1. Key Segment Analysis
- 6.2. Electronic Ceramics Market Size (Value - US$ Bn), Analysis, and Forecasts, by Material Type, 2021-2035
- 6.2.1. Aluminum Oxide (Alumina)
- 6.2.1.1. High Purity Alumina
- 6.2.1.2. Standard Alumina
- 6.2.2. Zirconium Oxide (Zirconia)
- 6.2.2.1. Stabilized Zirconia
- 6.2.2.2. Partially Stabilized Zirconia
- 6.2.3. Titanium Dioxide (Titania)
- 6.2.4. Silicon Carbide
- 6.2.5. Silicon Nitride
- 6.2.6. Barium Titanate
- 6.2.7. Lead Zirconate Titanate (PZT)
- 6.2.8. Steatite
- 6.2.9. Cordierite
- 6.2.10. Mullite
- 6.2.11. Others
- 6.2.1. Aluminum Oxide (Alumina)
- 7. Global Electronic Ceramics Market Analysis, by Product Type
- 7.1. Key Segment Analysis
- 7.2. Electronic Ceramics Market Size (Value - US$ Bn), Analysis, and Forecasts, by Product Type, 2021-2035
- 7.2.1. Ceramic Capacitors
- 7.2.1.1. Multilayer Ceramic Capacitors (MLCC)
- 7.2.1.2. Ceramic Disc Capacitors
- 7.2.1.3. Ceramic Through-Hole Capacitors
- 7.2.1.4. Others
- 7.2.2. Ceramic Substrates
- 7.2.2.1. Thin Film Substrates
- 7.2.2.2. Thick Film Substrates
- 7.2.3. Piezoelectric Ceramics
- 7.2.4. Ferrite Cores
- 7.2.5. Ceramic Insulators
- 7.2.6. Ceramic Resonators
- 7.2.7. Ceramic Filters
- 7.2.8. Varistors
- 7.2.9. Thermistors
- 7.2.9.1. NTC Thermistors
- 7.2.9.2. PTC Thermistors
- 7.2.10. Ceramic Packages
- 7.2.11. Others
- 7.2.1. Ceramic Capacitors
- 8. Global Electronic Ceramics Market Analysis, by Dielectric Properties
- 8.1. Key Segment Analysis
- 8.2. Electronic Ceramics Market Size (Value - US$ Bn), Analysis, and Forecasts, by Dielectric Properties, 2021-2035
- 8.2.1. High-K Dielectrics
- 8.2.2. Low-K Dielectrics
- 8.2.3. Mid-K Dielectrics
- 8.2.4. Ultra-High-K Dielectrics
- 9. Global Electronic Ceramics Market Analysis, by Voltage Rating
- 9.1. Key Segment Analysis
- 9.2. Electronic Ceramics Market Size (Value - US$ Bn), Analysis, and Forecasts, by Voltage Rating, 2021-2035
- 9.2.1. Below 100V
- 9.2.2. 100V - 1kV
- 9.2.3. Above 1kV
- 10. Global Electronic Ceramics Market Analysis, by Temperature Coefficient
- 10.1. Key Segment Analysis
- 10.2. Electronic Ceramics Market Size (Value - US$ Bn), Analysis, and Forecasts, by Temperature Coefficient, 2021-2035
- 10.2.1. Class I (C0G/NP0)
- 10.2.2. Class II (X7R, X5R)
- 10.2.3. Class III (Y5V, Z5U)
- 11. Global Electronic Ceramics Market Analysis and Forecasts, by Form Factor
- 11.1. Key Findings
- 11.2. Electronic Ceramics Market Size (Value - US$ Bn), Analysis, and Forecasts, by Form Factor, 2021-2035
- 11.2.1. Surface Mount Devices (SMD)
- 11.2.2. Through-Hole Components
- 11.2.3. Chip Components
- 11.2.4. Leaded Components
- 11.2.5. Others
- 12. Global Electronic Ceramics Market Analysis and Forecasts, by End-Use Industry
- 12.1. Key Findings
- 12.2. Electronic Ceramics Market Size (Value - US$ Bn), Analysis, and Forecasts, by End-Use Industry, 2021-2035
- 12.2.1. Consumer Electronics
- 12.2.1.1. Smartphones
- 12.2.1.2. Laptops & Tablets
- 12.2.1.3. Wearable Devices
- 12.2.1.4. Home Appliances
- 12.2.1.5. Audio/Video Equipment
- 12.2.1.6. Others
- 12.2.2. Automotive
- 12.2.2.1. Electric Vehicles (EVs)
- 12.2.2.2. Advanced Driver Assistance Systems (ADAS)
- 12.2.2.3. Infotainment Systems
- 12.2.2.4. Powertrain Systems
- 12.2.2.5. Safety Systems
- 12.2.2.6. Others
- 12.2.3. Telecommunications
- 12.2.4. Industrial
- 12.2.5. Medical & Healthcare
- 12.2.6. Aerospace & Defense
- 12.2.7. Energy & Power
- 12.2.8. Computing & Data Centers
- 12.2.9. Other End-users
- 12.2.1. Consumer Electronics
- 13. Global Electronic Ceramics Market Analysis and Forecasts, by Region
- 13.1. Key Findings
- 13.2. Electronic Ceramics Market Size (Value - US$ Bn), Analysis, and Forecasts, by Region, 2021-2035
- 13.2.1. North America
- 13.2.2. Europe
- 13.2.3. Asia Pacific
- 13.2.4. Middle East
- 13.2.5. Africa
- 13.2.6. South America
- 14. North America Electronic Ceramics Market Analysis
- 14.1. Key Segment Analysis
- 14.2. Regional Snapshot
- 14.3. North America Electronic Ceramics Market Size (Value - US$ Bn), Analysis, and Forecasts, 2021-2035
- 14.3.1. Material Type
- 14.3.2. Product Type
- 14.3.3. Dielectric Properties
- 14.3.4. Voltage Rating
- 14.3.5. Temperature Coefficient
- 14.3.6. Form Factor
- 14.3.7. End-Use Industry
- 14.3.8. Country
- 14.3.8.1. USA
- 14.3.8.2. Canada
- 14.3.8.3. Mexico
- 14.4. USA Electronic Ceramics Market
- 14.4.1. Country Segmental Analysis
- 14.4.2. Material Type
- 14.4.3. Product Type
- 14.4.4. Dielectric Properties
- 14.4.5. Voltage Rating
- 14.4.6. Temperature Coefficient
- 14.4.7. Form Factor
- 14.4.8. End-Use Industry
- 14.5. Canada Electronic Ceramics Market
- 14.5.1. Country Segmental Analysis
- 14.5.2. Material Type
- 14.5.3. Product Type
- 14.5.4. Dielectric Properties
- 14.5.5. Voltage Rating
- 14.5.6. Temperature Coefficient
- 14.5.7. Form Factor
- 14.5.8. End-Use Industry
- 14.6. Mexico Electronic Ceramics Market
- 14.6.1. Country Segmental Analysis
- 14.6.2. Material Type
- 14.6.3. Product Type
- 14.6.4. Dielectric Properties
- 14.6.5. Voltage Rating
- 14.6.6. Temperature Coefficient
- 14.6.7. Form Factor
- 14.6.8. End-Use Industry
- 15. Europe Electronic Ceramics Market Analysis
- 15.1. Key Segment Analysis
- 15.2. Regional Snapshot
- 15.3. Europe Electronic Ceramics Market Size (Value - US$ Bn), Analysis, and Forecasts, 2021-2035
- 15.3.1. Material Type
- 15.3.2. Product Type
- 15.3.3. Dielectric Properties
- 15.3.4. Voltage Rating
- 15.3.5. Temperature Coefficient
- 15.3.6. Form Factor
- 15.3.7. End-Use Industry
- 15.3.8. Country
- 15.3.8.1. Germany
- 15.3.8.2. United Kingdom
- 15.3.8.3. France
- 15.3.8.4. Italy
- 15.3.8.5. Spain
- 15.3.8.6. Netherlands
- 15.3.8.7. Nordic Countries
- 15.3.8.8. Poland
- 15.3.8.9. Russia & CIS
- 15.3.8.10. Rest of Europe
- 15.4. Germany Electronic Ceramics Market
- 15.4.1. Country Segmental Analysis
- 15.4.2. Material Type
- 15.4.3. Product Type
- 15.4.4. Dielectric Properties
- 15.4.5. Voltage Rating
- 15.4.6. Temperature Coefficient
- 15.4.7. Form Factor
- 15.4.8. End-Use Industry
- 15.5. United Kingdom Electronic Ceramics Market
- 15.5.1. Country Segmental Analysis
- 15.5.2. Material Type
- 15.5.3. Product Type
- 15.5.4. Dielectric Properties
- 15.5.5. Voltage Rating
- 15.5.6. Temperature Coefficient
- 15.5.7. Form Factor
- 15.5.8. End-Use Industry
- 15.6. France Electronic Ceramics Market
- 15.6.1. Country Segmental Analysis
- 15.6.2. Material Type
- 15.6.3. Product Type
- 15.6.4. Dielectric Properties
- 15.6.5. Voltage Rating
- 15.6.6. Temperature Coefficient
- 15.6.7. Form Factor
- 15.6.8. End-Use Industry
- 15.7. Italy Electronic Ceramics Market
- 15.7.1. Country Segmental Analysis
- 15.7.2. Material Type
- 15.7.3. Product Type
- 15.7.4. Dielectric Properties
- 15.7.5. Voltage Rating
- 15.7.6. Temperature Coefficient
- 15.7.7. Form Factor
- 15.7.8. End-Use Industry
- 15.8. Spain Electronic Ceramics Market
- 15.8.1. Country Segmental Analysis
- 15.8.2. Material Type
- 15.8.3. Product Type
- 15.8.4. Dielectric Properties
- 15.8.5. Voltage Rating
- 15.8.6. Temperature Coefficient
- 15.8.7. Form Factor
- 15.8.8. End-Use Industry
- 15.9. Netherlands Electronic Ceramics Market
- 15.9.1. Country Segmental Analysis
- 15.9.2. Material Type
- 15.9.3. Product Type
- 15.9.4. Dielectric Properties
- 15.9.5. Voltage Rating
- 15.9.6. Temperature Coefficient
- 15.9.7. Form Factor
- 15.9.8. End-Use Industry
- 15.10. Nordic Countries Electronic Ceramics Market
- 15.10.1. Country Segmental Analysis
- 15.10.2. Material Type
- 15.10.3. Product Type
- 15.10.4. Dielectric Properties
- 15.10.5. Voltage Rating
- 15.10.6. Temperature Coefficient
- 15.10.7. Form Factor
- 15.10.8. End-Use Industry
- 15.11. Poland Electronic Ceramics Market
- 15.11.1. Country Segmental Analysis
- 15.11.2. Material Type
- 15.11.3. Product Type
- 15.11.4. Dielectric Properties
- 15.11.5. Voltage Rating
- 15.11.6. Temperature Coefficient
- 15.11.7. Form Factor
- 15.11.8. End-Use Industry
- 15.12. Russia & CIS Electronic Ceramics Market
- 15.12.1. Country Segmental Analysis
- 15.12.2. Material Type
- 15.12.3. Product Type
- 15.12.4. Dielectric Properties
- 15.12.5. Voltage Rating
- 15.12.6. Temperature Coefficient
- 15.12.7. Form Factor
- 15.12.8. End-Use Industry
- 15.13. Rest of Europe Electronic Ceramics Market
- 15.13.1. Country Segmental Analysis
- 15.13.2. Material Type
- 15.13.3. Product Type
- 15.13.4. Dielectric Properties
- 15.13.5. Voltage Rating
- 15.13.6. Temperature Coefficient
- 15.13.7. Form Factor
- 15.13.8. End-Use Industry
- 16. Asia Pacific Electronic Ceramics Market Analysis
- 16.1. Key Segment Analysis
- 16.2. Regional Snapshot
- 16.3. Asia Pacific Electronic Ceramics Market Size (Value - US$ Bn), Analysis, and Forecasts, 2021-2035
- 16.3.1. Material Type
- 16.3.2. Product Type
- 16.3.3. Dielectric Properties
- 16.3.4. Voltage Rating
- 16.3.5. Temperature Coefficient
- 16.3.6. Form Factor
- 16.3.7. End-Use Industry
- 16.3.8. Country
- 16.3.8.1. China
- 16.3.8.2. India
- 16.3.8.3. Japan
- 16.3.8.4. South Korea
- 16.3.8.5. Australia and New Zealand
- 16.3.8.6. Indonesia
- 16.3.8.7. Malaysia
- 16.3.8.8. Thailand
- 16.3.8.9. Vietnam
- 16.3.8.10. Rest of Asia Pacific
- 16.4. China Electronic Ceramics Market
- 16.4.1. Country Segmental Analysis
- 16.4.2. Material Type
- 16.4.3. Product Type
- 16.4.4. Dielectric Properties
- 16.4.5. Voltage Rating
- 16.4.6. Temperature Coefficient
- 16.4.7. Form Factor
- 16.4.8. End-Use Industry
- 16.5. India Electronic Ceramics Market
- 16.5.1. Country Segmental Analysis
- 16.5.2. Material Type
- 16.5.3. Product Type
- 16.5.4. Dielectric Properties
- 16.5.5. Voltage Rating
- 16.5.6. Temperature Coefficient
- 16.5.7. Form Factor
- 16.5.8. End-Use Industry
- 16.6. Japan Electronic Ceramics Market
- 16.6.1. Country Segmental Analysis
- 16.6.2. Material Type
- 16.6.3. Product Type
- 16.6.4. Dielectric Properties
- 16.6.5. Voltage Rating
- 16.6.6. Temperature Coefficient
- 16.6.7. Form Factor
- 16.6.8. End-Use Industry
- 16.7. South Korea Electronic Ceramics Market
- 16.7.1. Country Segmental Analysis
- 16.7.2. Material Type
- 16.7.3. Product Type
- 16.7.4. Dielectric Properties
- 16.7.5. Voltage Rating
- 16.7.6. Temperature Coefficient
- 16.7.7. Form Factor
- 16.7.8. End-Use Industry
- 16.8. Australia and New Zealand Electronic Ceramics Market
- 16.8.1. Country Segmental Analysis
- 16.8.2. Material Type
- 16.8.3. Product Type
- 16.8.4. Dielectric Properties
- 16.8.5. Voltage Rating
- 16.8.6. Temperature Coefficient
- 16.8.7. Form Factor
- 16.8.8. End-Use Industry
- 16.9. Indonesia Electronic Ceramics Market
- 16.9.1. Country Segmental Analysis
- 16.9.2. Material Type
- 16.9.3. Product Type
- 16.9.4. Dielectric Properties
- 16.9.5. Voltage Rating
- 16.9.6. Temperature Coefficient
- 16.9.7. Form Factor
- 16.9.8. End-Use Industry
- 16.10. Malaysia Electronic Ceramics Market
- 16.10.1. Country Segmental Analysis
- 16.10.2. Material Type
- 16.10.3. Product Type
- 16.10.4. Dielectric Properties
- 16.10.5. Voltage Rating
- 16.10.6. Temperature Coefficient
- 16.10.7. Form Factor
- 16.10.8. End-Use Industry
- 16.11. Thailand Electronic Ceramics Market
- 16.11.1. Country Segmental Analysis
- 16.11.2. Material Type
- 16.11.3. Product Type
- 16.11.4. Dielectric Properties
- 16.11.5. Voltage Rating
- 16.11.6. Temperature Coefficient
- 16.11.7. Form Factor
- 16.11.8. End-Use Industry
- 16.12. Vietnam Electronic Ceramics Market
- 16.12.1. Country Segmental Analysis
- 16.12.2. Material Type
- 16.12.3. Product Type
- 16.12.4. Dielectric Properties
- 16.12.5. Voltage Rating
- 16.12.6. Temperature Coefficient
- 16.12.7. Form Factor
- 16.12.8. End-Use Industry
- 16.13. Rest of Asia Pacific Electronic Ceramics Market
- 16.13.1. Country Segmental Analysis
- 16.13.2. Material Type
- 16.13.3. Product Type
- 16.13.4. Dielectric Properties
- 16.13.5. Voltage Rating
- 16.13.6. Temperature Coefficient
- 16.13.7. Form Factor
- 16.13.8. End-Use Industry
- 17. Middle East Electronic Ceramics Market Analysis
- 17.1. Key Segment Analysis
- 17.2. Regional Snapshot
- 17.3. Middle East Electronic Ceramics Market Size (Value - US$ Bn), Analysis, and Forecasts, 2021-2035
- 17.3.1. Material Type
- 17.3.2. Product Type
- 17.3.3. Dielectric Properties
- 17.3.4. Voltage Rating
- 17.3.5. Temperature Coefficient
- 17.3.6. Form Factor
- 17.3.7. End-Use Industry
- 17.3.8. Country
- 17.3.8.1. Turkey
- 17.3.8.2. UAE
- 17.3.8.3. Saudi Arabia
- 17.3.8.4. Israel
- 17.3.8.5. Rest of Middle East
- 17.4. Turkey Electronic Ceramics Market
- 17.4.1. Country Segmental Analysis
- 17.4.2. Material Type
- 17.4.3. Product Type
- 17.4.4. Dielectric Properties
- 17.4.5. Voltage Rating
- 17.4.6. Temperature Coefficient
- 17.4.7. Form Factor
- 17.4.8. End-Use Industry
- 17.5. UAE Electronic Ceramics Market
- 17.5.1. Country Segmental Analysis
- 17.5.2. Material Type
- 17.5.3. Product Type
- 17.5.4. Dielectric Properties
- 17.5.5. Voltage Rating
- 17.5.6. Temperature Coefficient
- 17.5.7. Form Factor
- 17.5.8. End-Use Industry
- 17.6. Saudi Arabia Electronic Ceramics Market
- 17.6.1. Country Segmental Analysis
- 17.6.2. Material Type
- 17.6.3. Product Type
- 17.6.4. Dielectric Properties
- 17.6.5. Voltage Rating
- 17.6.6. Temperature Coefficient
- 17.6.7. Form Factor
- 17.6.8. End-Use Industry
- 17.7. Israel Electronic Ceramics Market
- 17.7.1. Country Segmental Analysis
- 17.7.2. Material Type
- 17.7.3. Product Type
- 17.7.4. Dielectric Properties
- 17.7.5. Voltage Rating
- 17.7.6. Temperature Coefficient
- 17.7.7. Form Factor
- 17.7.8. End-Use Industry
- 17.8. Rest of Middle East Electronic Ceramics Market
- 17.8.1. Country Segmental Analysis
- 17.8.2. Material Type
- 17.8.3. Product Type
- 17.8.4. Dielectric Properties
- 17.8.5. Voltage Rating
- 17.8.6. Temperature Coefficient
- 17.8.7. Form Factor
- 17.8.8. End-Use Industry
- 18. Africa Electronic Ceramics Market Analysis
- 18.1. Key Segment Analysis
- 18.2. Regional Snapshot
- 18.3. Africa Electronic Ceramics Market Size (Value - US$ Bn), Analysis, and Forecasts, 2021-2035
- 18.3.1. Material Type
- 18.3.2. Product Type
- 18.3.3. Dielectric Properties
- 18.3.4. Voltage Rating
- 18.3.5. Temperature Coefficient
- 18.3.6. Form Factor
- 18.3.7. End-Use Industry
- 18.3.8. Country
- 18.3.8.1. South Africa
- 18.3.8.2. Egypt
- 18.3.8.3. Nigeria
- 18.3.8.4. Algeria
- 18.3.8.5. Rest of Africa
- 18.4. South Africa Electronic Ceramics Market
- 18.4.1. Country Segmental Analysis
- 18.4.2. Material Type
- 18.4.3. Product Type
- 18.4.4. Dielectric Properties
- 18.4.5. Voltage Rating
- 18.4.6. Temperature Coefficient
- 18.4.7. Form Factor
- 18.4.8. End-Use Industry
- 18.5. Egypt Electronic Ceramics Market
- 18.5.1. Country Segmental Analysis
- 18.5.2. Material Type
- 18.5.3. Product Type
- 18.5.4. Dielectric Properties
- 18.5.5. Voltage Rating
- 18.5.6. Temperature Coefficient
- 18.5.7. Form Factor
- 18.5.8. End-Use Industry
- 18.6. Nigeria Electronic Ceramics Market
- 18.6.1. Country Segmental Analysis
- 18.6.2. Material Type
- 18.6.3. Product Type
- 18.6.4. Dielectric Properties
- 18.6.5. Voltage Rating
- 18.6.6. Temperature Coefficient
- 18.6.7. Form Factor
- 18.6.8. End-Use Industry
- 18.7. Algeria Electronic Ceramics Market
- 18.7.1. Country Segmental Analysis
- 18.7.2. Material Type
- 18.7.3. Product Type
- 18.7.4. Dielectric Properties
- 18.7.5. Voltage Rating
- 18.7.6. Temperature Coefficient
- 18.7.7. Form Factor
- 18.7.8. End-Use Industry
- 18.8. Rest of Africa Electronic Ceramics Market
- 18.8.1. Country Segmental Analysis
- 18.8.2. Material Type
- 18.8.3. Product Type
- 18.8.4. Dielectric Properties
- 18.8.5. Voltage Rating
- 18.8.6. Temperature Coefficient
- 18.8.7. Form Factor
- 18.8.8. End-Use Industry
- 19. South America Electronic Ceramics Market Analysis
- 19.1. Key Segment Analysis
- 19.2. Regional Snapshot
- 19.3. South America Electronic Ceramics Market Size (Value - US$ Bn), Analysis, and Forecasts, 2021-2035
- 19.3.1. Material Type
- 19.3.2. Product Type
- 19.3.3. Dielectric Properties
- 19.3.4. Voltage Rating
- 19.3.5. Temperature Coefficient
- 19.3.6. Form Factor
- 19.3.7. End-Use Industry
- 19.3.8. Country
- 19.3.8.1. Brazil
- 19.3.8.2. Argentina
- 19.3.8.3. Rest of South America
- 19.4. Brazil Electronic Ceramics Market
- 19.4.1. Country Segmental Analysis
- 19.4.2. Material Type
- 19.4.3. Product Type
- 19.4.4. Dielectric Properties
- 19.4.5. Voltage Rating
- 19.4.6. Temperature Coefficient
- 19.4.7. Form Factor
- 19.4.8. End-Use Industry
- 19.5. Argentina Electronic Ceramics Market
- 19.5.1. Country Segmental Analysis
- 19.5.2. Material Type
- 19.5.3. Product Type
- 19.5.4. Dielectric Properties
- 19.5.5. Voltage Rating
- 19.5.6. Temperature Coefficient
- 19.5.7. Form Factor
- 19.5.8. End-Use Industry
- 19.6. Rest of South America Electronic Ceramics Market
- 19.6.1. Country Segmental Analysis
- 19.6.2. Material Type
- 19.6.3. Product Type
- 19.6.4. Dielectric Properties
- 19.6.5. Voltage Rating
- 19.6.6. Temperature Coefficient
- 19.6.7. Form Factor
- 19.6.8. End-Use Industry
- 20. Key Players/ Company Profile
- 20.1. AVX Corporation
- 20.1.1. Company Details/ Overview
- 20.1.2. Company Financials
- 20.1.3. Key Customers and Competitors
- 20.1.4. Business/ Industry Portfolio
- 20.1.5. Product Portfolio/ Specification Details
- 20.1.6. Pricing Data
- 20.1.7. Strategic Overview
- 20.1.8. Recent Developments
- 20.2. CeramTec GmbH
- 20.3. CoorsTek Inc.
- 20.4. Ferro Corporation
- 20.5. Holy Stone Enterprise Co., Ltd.
- 20.6. Johanson Dielectrics Inc.
- 20.7. KEMET Corporation
- 20.8. Knowles Corporation
- 20.9. Kyocera Corporation
- 20.10. Materion Corporation
- 20.11. Morgan Advanced Materials
- 20.12. Murata Manufacturing Co., Ltd.
- 20.13. NGK Spark Plug Co., Ltd.
- 20.14. Nippon Chemi-Con Corporation
- 20.15. PI Ceramic GmbH
- 20.16. Rogers Corporation
- 20.17. Samsung Electro-Mechanics
- 20.18. Taiyo Yuden Co., Ltd.
- 20.19. TDK Corporation
- 20.20. Vishay Intertechnology
- 20.21. Walsin Technology Corporation
- 20.22. Yageo Corporation
- 20.23. Other Key Players
- 20.1. AVX Corporation
Note* - This is just tentative list of players. While providing the report, we will cover more number of players based on their revenue and share for each geography
Research Design
Our research design integrates both demand-side and supply-side analysis through a balanced combination of primary and secondary research methodologies. By utilizing both bottom-up and top-down approaches alongside rigorous data triangulation methods, we deliver robust market intelligence that supports strategic decision-making.
MarketGenics' comprehensive research design framework ensures the delivery of accurate, reliable, and actionable market intelligence. Through the integration of multiple research approaches, rigorous validation processes, and expert analysis, we provide our clients with the insights needed to make informed strategic decisions and capitalize on market opportunities.

MarketGenics leverages a dedicated industry panel of experts and a comprehensive suite of paid databases to effectively collect, consolidate, and analyze market intelligence.
Our approach has consistently proven to be reliable and effective in generating accurate market insights, identifying key industry trends, and uncovering emerging business opportunities.
Through both primary and secondary research, we capture and analyze critical company-level data such as manufacturing footprints, including technical centers, R&D facilities, sales offices, and headquarters.
Our expert panel further enhances our ability to estimate market size for specific brands based on validated field-level intelligence.
Our data mining techniques incorporate both parametric and non-parametric methods, allowing for structured data collection, sorting, processing, and cleaning.
Demand projections are derived from large-scale data sets analyzed through proprietary algorithms, culminating in robust and reliable market sizing.
Research Approach
The bottom-up approach builds market estimates by starting with the smallest addressable market units and systematically aggregating them to create comprehensive market size projections.
This method begins with specific, granular data points and builds upward to create the complete market landscape.
Customer Analysis → Segmental Analysis → Geographical Analysis
The top-down approach starts with the broadest possible market data and systematically narrows it down through a series of filters and assumptions to arrive at specific market segments or opportunities.
This method begins with the big picture and works downward to increasingly specific market slices.
TAM → SAM → SOM


Research Methods
Desk / Secondary Research
While analysing the market, we extensively study secondary sources, directories, and databases to identify and collect information useful for this technical, market-oriented, and commercial report. Secondary sources that we utilize are not only the public sources, but it is a combination of Open Source, Associations, Paid Databases, MG Repository & Knowledgebase, and others.
- Company websites, annual reports, financial reports, broker reports, and investor presentations
- National government documents, statistical databases and reports
- News articles, press releases and web-casts specific to the companies operating in the market, Magazines, reports, and others
- We gather information from commercial data sources for deriving company specific data such as segmental revenue, share for geography, product revenue, and others
- Internal and external proprietary databases (industry-specific), relevant patent, and regulatory databases
- Governing Bodies, Government Organizations
- Relevant Authorities, Country-specific Associations for Industries
We also employ the model mapping approach to estimate the product level market data through the players' product portfolio
Primary Research
Primary research/ interviews is vital in analyzing the market. Most of the cases involves paid primary interviews. Primary sources include primary interviews through e-mail interactions, telephonic interviews, surveys as well as face-to-face interviews with the different stakeholders across the value chain including several industry experts.
| Type of Respondents | Number of Primaries |
|---|---|
| Tier 2/3 Suppliers | ~20 |
| Tier 1 Suppliers | ~25 |
| End-users | ~25 |
| Industry Expert/ Panel/ Consultant | ~30 |
| Total | ~100 |
MG Knowledgebase
• Repository of industry blog, newsletter and case studies
• Online platform covering detailed market reports, and company profiles
Forecasting Factors and Models
Forecasting Factors
- Historical Trends – Past market patterns, cycles, and major events that shaped how markets behave over time. Understanding past trends helps predict future behavior.
- Industry Factors – Specific characteristics of the industry like structure, regulations, and innovation cycles that affect market dynamics.
- Macroeconomic Factors – Economic conditions like GDP growth, inflation, and employment rates that affect how much money people have to spend.
- Demographic Factors – Population characteristics like age, income, and location that determine who can buy your product.
- Technology Factors – How quickly people adopt new technology and how much technology infrastructure exists.
- Regulatory Factors – Government rules, laws, and policies that can help or restrict market growth.
- Competitive Factors – Analyzing competition structure such as degree of competition and bargaining power of buyers and suppliers.
Forecasting Models / Techniques
Multiple Regression Analysis
- Identify and quantify factors that drive market changes
- Statistical modeling to establish relationships between market drivers and outcomes
Time Series Analysis – Seasonal Patterns
- Understand regular cyclical patterns in market demand
- Advanced statistical techniques to separate trend, seasonal, and irregular components
Time Series Analysis – Trend Analysis
- Identify underlying market growth patterns and momentum
- Statistical analysis of historical data to project future trends
Expert Opinion – Expert Interviews
- Gather deep industry insights and contextual understanding
- In-depth interviews with key industry stakeholders
Multi-Scenario Development
- Prepare for uncertainty by modeling different possible futures
- Creating optimistic, pessimistic, and most likely scenarios
Time Series Analysis – Moving Averages
- Sophisticated forecasting for complex time series data
- Auto-regressive integrated moving average models with seasonal components
Econometric Models
- Apply economic theory to market forecasting
- Sophisticated economic models that account for market interactions
Expert Opinion – Delphi Method
- Harness collective wisdom of industry experts
- Structured, multi-round expert consultation process
Monte Carlo Simulation
- Quantify uncertainty and probability distributions
- Thousands of simulations with varying input parameters
Research Analysis
Our research framework is built upon the fundamental principle of validating market intelligence from both demand and supply perspectives. This dual-sided approach ensures comprehensive market understanding and reduces the risk of single-source bias.
Demand-Side Analysis: We understand end-user/application behavior, preferences, and market needs along with the penetration of the product for specific application.
Supply-Side Analysis: We estimate overall market revenue, analyze the segmental share along with industry capacity, competitive landscape, and market structure.
Validation & Evaluation
Data triangulation is a validation technique that uses multiple methods, sources, or perspectives to examine the same research question, thereby increasing the credibility and reliability of research findings. In market research, triangulation serves as a quality assurance mechanism that helps identify and minimize bias, validate assumptions, and ensure accuracy in market estimates.
- Data Source Triangulation – Using multiple data sources to examine the same phenomenon
- Methodological Triangulation – Using multiple research methods to study the same research question
- Investigator Triangulation – Using multiple researchers or analysts to examine the same data
- Theoretical Triangulation – Using multiple theoretical perspectives to interpret the same data

Custom Market Research Services
We will customise the research for you, in case the report listed above does not meet your requirements.
Get 10% Free Customisation