Green Packaging Market Size, Share & Trends Analysis Report by Material Type (Recycled Content Material, Biodegradable Material, Reusable Material), Packaging Type, Technology, Product Form, Capacity Range, Distribution Channel, End-use Industry, and Geography (North America, Europe, Asia Pacific, Middle East, Africa, and South America) – Global Industry Data, Trends, and Forecasts, 2026–2035
|
|
|
Segmental Data Insights |
|
|
Demand Trends |
|
|
Competitive Landscape |
|
|
Strategic Development |
|
|
Future Outlook & Opportunities |
|
Green-Packaging-Market Size, Share, and Growth
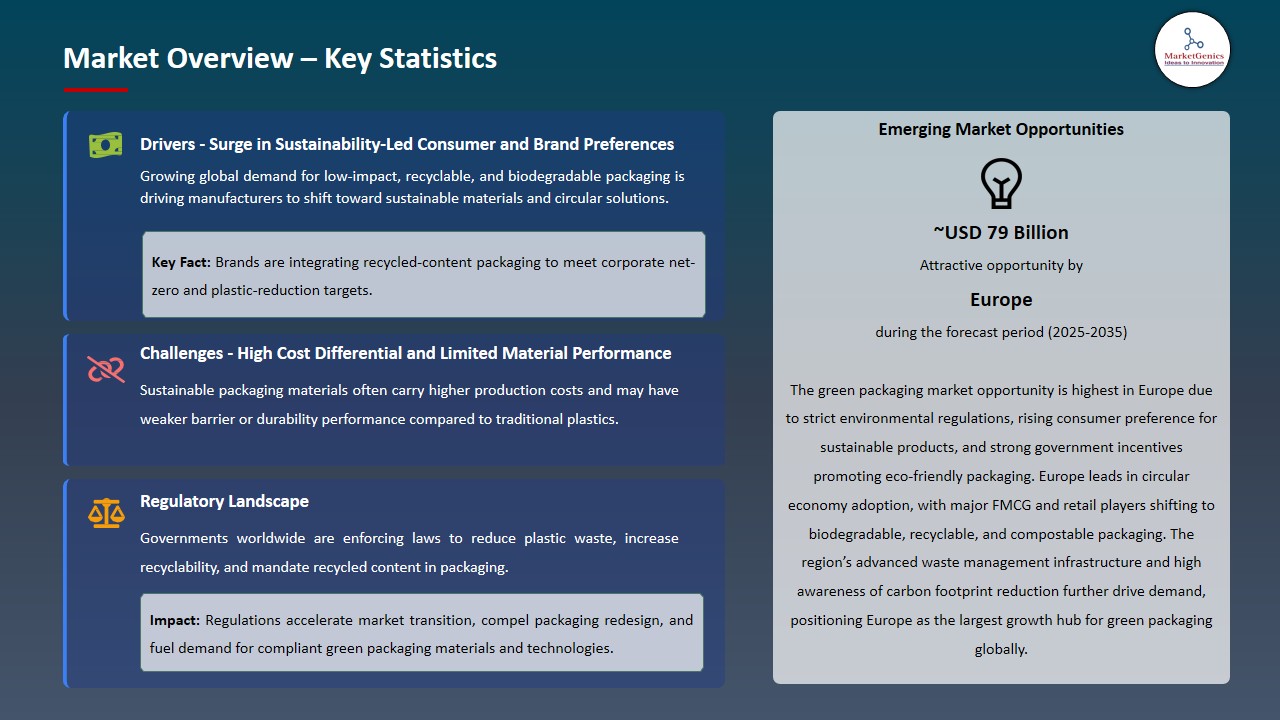
The global green packaging market is experiencing robust growth, with its estimated value of USD 307.4 billion in the year 2025 and USD 530.1 billion by the period 2035, registering a CAGR of 5.6%, during the forecast period. The green packaging market is rapidly growing with manufacturers, brands and regulators identifying the need to adopt sustainable, recyclable and circular packaging strategies to secure better product integrity, less environmental impact and meet the current global regulations.

Dirk Gabriel, COO Consumer Flexibles at Mondi, FunctionalBarrier Paper Ultimate is the result of customer-driven innovation. With this solution, we are helping brands to move away from multi-material packaging that is unrecyclable, without compromising on performance. This is another concrete step towards our MAP2030 sustainability commitments of designing circular-driven solutions, created by empowered people, and taking action on climate. As of today, 87% of Mondi’s packaging solutions are already reusable, recyclable, or compostable.
The green packaging market is shifting more on a compliance-based strategy rather than a strategic enabler to brand differentiation, risk management, and premium positioning in food, beverage, pharmaceuticals, personal-care and household chemical industries. The increasing consumer demand on the sustainability factor, government stipulations of recyclability and increased emphasis on product integrity are causing manufacturers to redesign bottles, pouches, closures, and rigid/flexible format packaging to enhance safety, functionality, and environmental performance.
The sustainability goals with product protection, shelf-life, and compliance with regulatory requirements are contributing to innovation. Companies are going towards mono-material solutions, high barrier paper, bio-based polymers, recycled PET and compostable laminates to minimize the environmental impact, yet retain performance. The implementation of closed-loop and circular packaging plans, automation-friendly fill and seal devices, and efficient production, uniform quality, and compliance are being implemented throughout the global supply chains.
Adjacent opportunities to the green packaging market include biodegradable polymers, paper-based barrier coatings, compostable flexible packaging, reusable packaging systems, and bio-based adhesives and inks, driven by sustainability regulations and circular economy goals, thereby expanding market scope, accelerating adoption across food, consumer goods, and e-commerce, and reducing dependence on conventional plastic packaging.
Green-Packaging-Market Dynamics and Trends
Driver: Regulatory Pressure and Mandatory Sustainability Compliance
-
As the level of green regulations and producer responsibility (EPR) becomes longer, the global market towards green packaging is being impetuated. Most governments follow the policy of requiring recyclable, compostable, or recycled content packaging in food, beverage, personal care, and e-commerce industries, requiring manufacturers of goods to use sustainable materials that lower carbon footprint and waste.
- Firms are using eco-efficient materials and designs made of mono materials to adhere to sustainability requirements and plastic-cutting quotas. For instance, the European Union regulation in 20232024, where all packaging is to be recyclable by 2030, with plastic packaging having a minimum recycled-content target (e.g. 30 percentage points of single use bottles, rising to 2040). These regulations compel manufacturers to replace the existing plastics with bio-based plastic, recycled PET, and paper-based formats, pushing the demand towards the compliant green-packaging solutions without compromising on the product protection and shelf-life.
- The increasing consumer awareness of the environment, combined with regulatory fines in case of non-compliance, strengthens usage in packaged-food, beverage and personal-care industries, boosting growth in the global market at an increased pace.
Restraint: High Cost Structure and Limited Infrastructure in Emerging Markets
-
One of the biggest barriers to the green packaging market is that the sustainable materials like bio-based polymers, recycled PET and fiber-based substrates are very expensive and cost much more than traditional plastics or laminated fabrics. The necessity of sophisticated processing, barrier finishes, and other specialized equipment increases the costs of production, which affects the price and profitability, especially of small and middle-sized manufacturers.
- The difficulty is augmented by supply chain variability of raw materials. Availability of high-quality post-consumer recycled (PCR) plastics, certified bio-polymers and sustainably sourced paper may vary in different regions because of the lack of collection facilities, seasonal variations or regulatory limits, making it unpredictable in terms of production schedules and cost of procurement.
- Additionally, there are pressures on food processing costs, logistics of handling delicate or wet goods, and quality assurance testing processes are an issue to manufacturers to satisfy food grade and regulatory requirements. All these are limiting adoption factors particularly in new markets where supply chains are not as developed and economies of scale do not exist.
Opportunity: Expansion of Circular Economy and Closed-Loop Packaging Systems
-
The prospect of increased utilisation of circular economy and closed-loop packaging solutions in food, beverage, personal-care, and e-commerce markets is opportunity to the global green packaging market. An increase in regulatory pressure on recycled-content packaging, and the growing popularity of sustainable and low-carbon products among consumers, is putting pressure on the need to have materials and systems that are easy to collect, recycle or compost.
- Manufacturers are trying to take advantage of these opportunities by innovating. For instance, in November 2024, Faerch introduced chilled ready-meal trays with at least 40% of post-consumer recycled PET (rPET) produced in kerbside collection. These trays were fully food-grade safe and had market-leading barrier performance, and minimized use of virgin plastics and carbon footprint, which proved the commercial feasibility of closed-loop, recycled-content packaging solutions.
- As brands are now actively engaged in the use of packaging that is circular, recycled-content, and refillable, this trend presents packaging producers with a strategic opportunity to broaden portfolios, introduce multifunctional solutions and satisfy emerging and high-growth markets with growing demands on sustainability.
Key Trend: Rapid Innovation in Bio-Based and Mono-Material Packaging Solutions
-
The global green packaging environment is also seeing a high trend in adoption of high-performance bio-based and mono-material packaging systems, which have become recyclable, with less carbon intensity and adherence to new requirements of the circular-economy. Firms are rushing to use cellulose-based films, bio-PE, bio-PP and fiber-engineered rigid forms to substitute the complicated multi-layer constructions without damaging the protection of the product or its shelf-life characteristics.
- Innovation in mono-material and bio-based platforms has intensified. For instance, in August 2025, Mondi launched its FunctionalBarrier Paper Ultimate, a high-barrier paper-based packaging solution designed to replace multi-layer plastics and aluminium laminates. The solution delivered excellent moisture and oxygen barrier performance while being fully recyclable, supporting large-scale adoption across food, beverage, and personal-care segments and reinforcing Europe’s leadership in sustainable packaging innovation.
- Bio-based and mono-material solutions are widely accepted because of their performance, compliance with the regulations, and because low-impact packaging is preferred by consumers. The trend has remained in the process of increasing brand differentiation, recyclability and sustainability of supply chains across the globe.
Green-Packaging-Market Analysis and Segmental Data
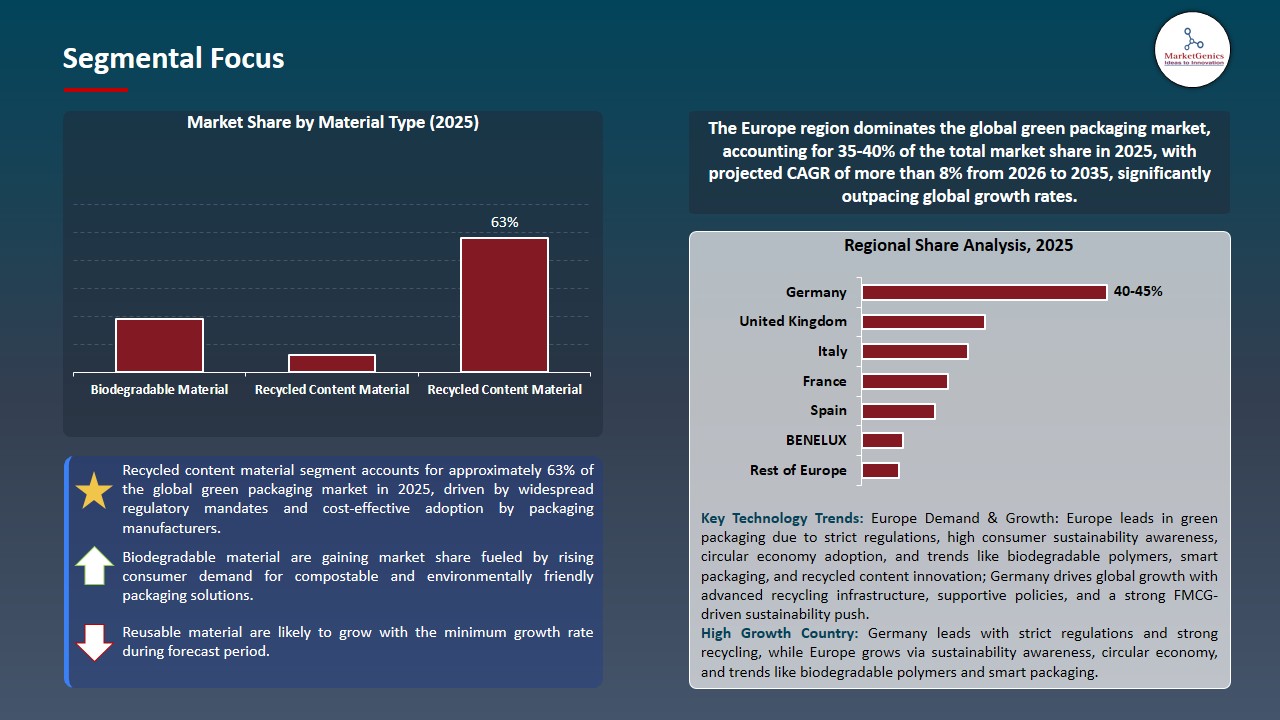
Recycled Content Material Dominate Global Green Packaging Market
-
Recycled-content materials dominate the global green packaging market because they are known to perform circularly, comply with regulations regarding recycled-content requirements, and be dependable in food, beverage, personal-care and household markets. Their consistent barrier characteristics, cost-effectiveness, and lower carbon footprint allow manufacturers to satisfy sustainability objectives and keep packaging intact throughout the international retail and e-commerce chains.
- The recycled-material packaging trend in the area of innovation is still growing. For instance, in 2024, ALPLA and Coca-Cola have collaborated on the release of the first 100 percent recycled PET (rPET) bottle with packed drinking water in India, which proves its food-grade purity, structural integrity, and 100 percent adherence to safety standards. This achievement demonstrated the feasibility of high-recycled-content solutions on commercial volumes.
- Materials have gained material as an alternative to virgin plastics since they can be predictable and can be processed with other advanced materials. Their use in both rigid and flexible forms keeps on increasing their application in major food and beverage segments to aid in the various categories of sustainable, safe, and shelf-stable packaging solutions.
Europe Leads Global Green Packaging Market Demand
-
Europe leads the global green packaging market, driven by strict sustainability requirements in EU, high rates of adoption of circular economy, and high penetration in the high-end food, beverage, and specialty retail sectors. Regulations in the area such as PPWR, SUPD and carbon-neutrality targets are hastening the shift to full recyclability, composability, and bio-based packaging systems, increasing more transparency and compliance preparedness in supply lines.
- Manufacturers in Europe are also launching next-generation eco-effective packaging designs, such as fiber-enhanced rigid designs, a laminates based on mono materials and enzyme-enabled bio-polymers. For instance, in 2023, Huhtamaki introduced its mono-material flexible packaging line (blueloop), which is fully recyclable, has a high barrier, and no multi-layer non-recyclable structures, which clearly represent the green-packaging innovation in Europe.
- The advanced recycling infrastructure, digital watermarking technology, closed loop recovery and lightweighting technologies further depict Europe as the global leader in green packaging innovation.
Green-Packaging-Market Ecosystem
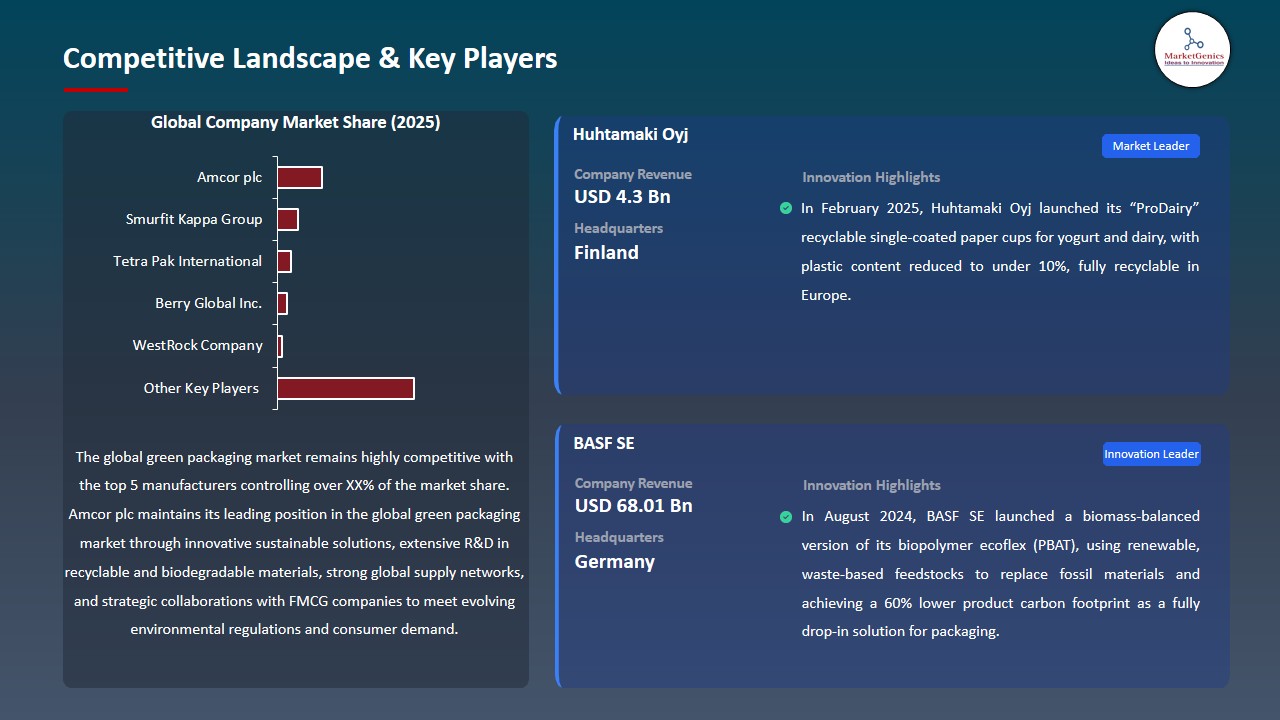
The global green packaging market is fairly fragmented where multinational packaging vendors, sustainable solutions providers, and regional players supply the food, beverage, pharmaceutical, and personal-care industries. The notable Tier-1 participants are Amcor plc, Smurfit Kappa Group, and Tetra Pak International that take advantage of production networks around the world, ongoing research and development, and sustainability-oriented innovations to offer recyclable, compostable, and bio-based packaging options at large-scale. Tier-2 competitors like Berry Global Inc. and WestRock Company brings to the market tightly focused and specialized sustainable packaging solutions, like molded-pulp, recycled-content, and barrier-coated solutions, and usually to regional or niche end-use markets.
The green packaging value chain includes raw material suppliers (paperboard, bioplastics, PLA, recycled polymers), converters and designers of the packaging, the brand owner, the contract packaging company, the downstream processing food and beverage and consumer good retail and e-commerce distribution. Compostable, recyclable, and renewable packaging materials, automation-driven production, and online monitoring are some of the areas that market players are investing in to guarantee compliance on performance and sustainability.
The other ecosystem improvements are vertical integration, life cycle assessment, eco-design, and regulatory alignment to achieve the ESG targets, decrease carbon footprint, and preserve product quality. All these efforts enhance competitiveness in the market, regulatory compliance, and market adoption in different end-use markets.
Recent Development and Strategic Overview
-
In May 2025, BASF and Metpack introduced a home-compostable coated paperboard in May 2025 named Ezycompost and used to package food products. The material is coated with a biodegradable polymer coating, is compostable, is food contact approved, and offers good barrier properties to liquids, greased, oils, and heat which will provide a sustainable alternative to traditional packaging.
- In January 2025, Rottneros Packaging AB declared the introduction of its NATURE line of sustainable food-packaging trays, created of 8698 percent renewable material, with FSC-certified fibre, compostable liners and barrier characteristics to prolong the shelf-life of its food items and reducing plastic amounts to less than 10 percent.
Report Scope
|
Detail |
|
|
Market Size in 2025 |
USD 307.4 Bn |
|
Market Forecast Value in 2035 |
USD 530.1 Bn |
|
Growth Rate (CAGR) |
5.6% |
|
Forecast Period |
2026 – 2035 |
|
Historical Data Available for |
2021 – 2024 |
|
Market Size Units |
US$ Billion for Value |
|
Report Format |
Electronic (PDF) + Excel |
|
North America |
Europe |
Asia Pacific |
Middle East |
Africa |
South America |
|
|
|
|
|
|
|
Companies Covered |
|||||
|
|
|
|
|
|
Green-Packaging-Market Segmentation and Highlights
|
Segment |
Sub-segment |
|
Green Packaging Market, By Material Type |
|
|
Green Packaging Market, By Packaging Type |
|
|
Green Packaging Market, By Technology |
|
|
Green Packaging Market, By Product Form |
|
|
Green Packaging Market, By Capacity Range |
|
|
Green Packaging Market, By Distribution Channel |
|
|
Green Packaging Market, By End-use Industry |
|
Frequently Asked Questions
Table of Contents
- 1. Research Methodology and Assumptions
- 1.1. Definitions
- 1.2. Research Design and Approach
- 1.3. Data Collection Methods
- 1.4. Base Estimates and Calculations
- 1.5. Forecasting Models
- 1.5.1. Key Forecast Factors & Impact Analysis
- 1.6. Secondary Research
- 1.6.1. Open Sources
- 1.6.2. Paid Databases
- 1.6.3. Associations
- 1.7. Primary Research
- 1.7.1. Primary Sources
- 1.7.2. Primary Interviews with Stakeholders across Ecosystem
- 2. Executive Summary
- 2.1. Global Green Packaging Market Outlook
- 2.1.1. Green Packaging Market Size (Value - US$ Bn), and Forecasts, 2021-2035
- 2.1.2. Compounded Annual Growth Rate Analysis
- 2.1.3. Growth Opportunity Analysis
- 2.1.4. Segmental Share Analysis
- 2.1.5. Geographical Share Analysis
- 2.2. Market Analysis and Facts
- 2.3. Supply-Demand Analysis
- 2.4. Competitive Benchmarking
- 2.5. Go-to- Market Strategy
- 2.5.1. Customer/ End-use Industry Assessment
- 2.5.2. Growth Opportunity Data, 2026-2035
- 2.5.2.1. Regional Data
- 2.5.2.2. Country Data
- 2.5.2.3. Segmental Data
- 2.5.3. Identification of Potential Market Spaces
- 2.5.4. GAP Analysis
- 2.5.5. Potential Attractive Price Points
- 2.5.6. Prevailing Market Risks & Challenges
- 2.5.7. Preferred Sales & Marketing Strategies
- 2.5.8. Key Recommendations and Analysis
- 2.5.9. A Way Forward
- 2.1. Global Green Packaging Market Outlook
- 3. Industry Data and Premium Insights
- 3.1. Global Packaging Industry Overview, 2025
- 3.1.1. Packaging Industry Ecosystem Analysis
- 3.1.2. Key Trends for Packaging Industry
- 3.1.3. Regional Distribution for Packaging Industry
- 3.2. Supplier Customer Data
- 3.3. Technology Roadmap and Developments
- 3.4. Trade Analysis
- 3.4.1. Import & Export Analysis, 2025
- 3.4.2. Top Importing Countries
- 3.4.3. Top Exporting Countries
- 3.5. Trump Tariff Impact Analysis
- 3.5.1. Manufacturer
- 3.5.1.1. Based on the component & Raw material
- 3.5.2. Supply Chain
- 3.5.3. End Consumer
- 3.5.1. Manufacturer
- 3.6. Raw Material Analysis
- 3.1. Global Packaging Industry Overview, 2025
- 4. Market Overview
- 4.1. Market Dynamics
- 4.1.1. Drivers
- 4.1.1.1. Increasing consumer demand for sustainable, recyclable, and compostable packaging solutions.
- 4.1.1.2. Stringent environmental regulations and corporate sustainability initiatives driving adoption of eco-friendly materials.
- 4.1.1.3. Growth in packaged foods, beverages, and personal-care products requiring high-performance sustainable packaging.
- 4.1.2. Restraints
- 4.1.2.1. High production costs of bio-based and recycled materials compared to conventional packaging.
- 4.1.2.2. Limited recycling and waste-management infrastructure in emerging markets restricting large-scale adoption.
- 4.1.1. Drivers
- 4.2. Key Trend Analysis
- 4.3. Regulatory Framework
- 4.3.1. Key Regulations, Norms, and Subsidies, by Key Countries
- 4.3.2. Tariffs and Standards
- 4.3.3. Impact Analysis of Regulations on the Market
- 4.4. Value Chain Analysis
- 4.4.1. Raw Material Suppliers
- 4.4.2. Manufacturers
- 4.4.3. Dealers/ Distributors
- 4.4.4. End-Users/ Customers
- 4.5. Porter’s Five Forces Analysis
- 4.6. PESTEL Analysis
- 4.7. Global Green Packaging Market Demand
- 4.7.1. Historical Market Size – Value (US$ Bn), 2020-2024
- 4.7.2. Current and Future Market Size – Value (US$ Bn), 2026–2035
- 4.7.2.1. Y-o-Y Growth Trends
- 4.7.2.2. Absolute $ Opportunity Assessment
- 4.1. Market Dynamics
- 5. Competition Landscape
- 5.1. Competition structure
- 5.1.1. Fragmented v/s consolidated
- 5.2. Company Share Analysis, 2025
- 5.2.1. Global Company Market Share
- 5.2.2. By Region
- 5.2.2.1. North America
- 5.2.2.2. Europe
- 5.2.2.3. Asia Pacific
- 5.2.2.4. Middle East
- 5.2.2.5. Africa
- 5.2.2.6. South America
- 5.3. Product Comparison Matrix
- 5.3.1. Specifications
- 5.3.2. Market Positioning
- 5.3.3. Pricing
- 5.1. Competition structure
- 6. Global Green Packaging Market Analysis, by Material Type
- 6.1. Key Segment Analysis
- 6.2. Green Packaging Market Size (Value - US$ Bn), Analysis, and Forecasts, by Material Type, 2021-2035
- 6.2.1. Recycled Content Material
- 6.2.1.1. Recycled Paper & Paperboard
- 6.2.1.2. Recycled Plastics (rPET, rPE, rPP)
- 6.2.1.3. Recycled Glass
- 6.2.1.4. Recycled Metal
- 6.2.1.5. Others
- 6.2.2. Biodegradable Material
- 6.2.2.1. PLA (Polylactic Acid)
- 6.2.2.2. PHA (Polyhydroxyalkanoates)
- 6.2.2.3. Starch-based Plastics
- 6.2.2.4. Cellulose-based Materials
- 6.2.2.5. Others
- 6.2.3. Reusable Material
- 6.2.3.1. Durable Plastics
- 6.2.3.2. Metal Containers
- 6.2.3.3. Glass Containers
- 6.2.3.4. Fabric-based Packaging
- 6.2.3.5. Others
- 6.2.1. Recycled Content Material
- 7. Global Green Packaging Market Analysis, by Packaging Type
- 7.1. Key Segment Analysis
- 7.2. Green Packaging Market Size (Value - US$ Bn), Analysis, and Forecasts, by Packaging Type, 2021-2035
- 7.2.1. Primary Packaging
- 7.2.1.1. Bottles & Jars
- 7.2.1.2. Pouches & Sachets
- 7.2.1.3. Boxes & Cartons
- 7.2.1.4. Trays & Clamshells
- 7.2.1.5. Others
- 7.2.2. Secondary Packaging
- 7.2.2.1. Corrugated Boxes
- 7.2.2.2. Shrink Wrap
- 7.2.2.3. Display Packaging
- 7.2.2.4. Others
- 7.2.3. Tertiary Packaging
- 7.2.3.1. Pallets
- 7.2.3.2. Stretch Films
- 7.2.3.3. Strapping Materials
- 7.2.3.4. Others
- 7.2.1. Primary Packaging
- 8. Global Green Packaging Market Analysis, by Technology
- 8.1. Key Segment Analysis
- 8.2. Green Packaging Market Size (Value - US$ Bn), Analysis, and Forecasts, by Technology, 2021-2035
- 8.2.1. Molded Fiber Technology
- 8.2.2. Bio-coating Technology
- 8.2.3. Edible Coating Technology
- 8.2.4. Nanotechnology-based Packaging
- 8.2.5. Active Packaging Technology
- 8.2.6. Intelligent Packaging Technology
- 9. Global Green Packaging Market Analysis, by Product Form
- 9.1. Key Segment Analysis
- 9.2. Green Packaging Market Size (Value - US$ Bn), Analysis, and Forecasts, by Product Form, 2021-2035
- 9.2.1. Rigid Packaging
- 9.2.2. Flexible Packaging
- 9.2.3. Semi-rigid Packaging
- 10. Global Green Packaging Market Analysis, by Capacity Range
- 10.1. Key Segment Analysis
- 10.2. Green Packaging Market Size (Value - US$ Bn), Analysis, and Forecasts, by Capacity Range, 2021-2035
- 10.2.1. Small Capacity (< 100ml/grams)
- 10.2.2. Medium Capacity (100ml - 1L / 100g - 1kg)
- 10.2.3. Large Capacity (1L - 5L / 1kg - 5kg)
- 10.2.4. Bulk Capacity (> 5L / > 5kg)
- 11. Global Green Packaging Market Analysis, by Distribution Channel
- 11.1. Key Segment Analysis
- 11.2. Green Packaging Market Size (Value - US$ Bn), Analysis, and Forecasts, by Distribution Channel, 2021-2035
- 11.2.1. Direct Sales (B2B)
- 11.2.2. Distributors & Wholesalers
- 11.2.3. Online Channels
- 11.2.4. Retail Channels
- 12. Global Green Packaging Market Analysis, by End-use Industry
- 12.1. Key Segment Analysis
- 12.2. Green Packaging Market Size (Value - US$ Bn), Analysis, and Forecasts, by End-use Industry, 2021-2035
- 12.2.1. Food & Beverage
- 12.2.2. Personal Care & Cosmetics
- 12.2.3. Pharmaceutical & Healthcare
- 12.2.4. E-commerce & Retail
- 12.2.5. Consumer Electronics
- 12.2.6. Home Care & Cleaning Products
- 12.2.7. Industrial & B2B
- 12.2.8. Pet Care
- 13. Global Green Packaging Market Analysis and Forecasts, by Region
- 13.1. Key Findings
- 13.2. Green Packaging Market Size (Value - US$ Bn), Analysis, and Forecasts, by Region, 2021-2035
- 13.2.1. North America
- 13.2.2. Europe
- 13.2.3. Asia Pacific
- 13.2.4. Middle East
- 13.2.5. Africa
- 13.2.6. South America
- 14. North America Green Packaging Market Analysis
- 14.1. Key Segment Analysis
- 14.2. Regional Snapshot
- 14.3. North America Green Packaging Market Size (Value - US$ Bn), Analysis, and Forecasts, 2021-2035
- 14.3.1. Material Type
- 14.3.2. Packaging Type
- 14.3.3. Technology
- 14.3.4. Product Form
- 14.3.5. Capacity Range
- 14.3.6. Distribution Channel
- 14.3.7. End-use Industry
- 14.3.8. Country
- 14.3.8.1. USA
- 14.3.8.2. Canada
- 14.3.8.3. Mexico
- 14.4. USA Green Packaging Market
- 14.4.1. Country Segmental Analysis
- 14.4.2. Material Type
- 14.4.3. Packaging Type
- 14.4.4. Technology
- 14.4.5. Product Form
- 14.4.6. Capacity Range
- 14.4.7. Distribution Channel
- 14.4.8. End-use Industry
- 14.5. Canada Green Packaging Market
- 14.5.1. Country Segmental Analysis
- 14.5.2. Material Type
- 14.5.3. Packaging Type
- 14.5.4. Technology
- 14.5.5. Product Form
- 14.5.6. Capacity Range
- 14.5.7. Distribution Channel
- 14.5.8. End-use Industry
- 14.6. Mexico Green Packaging Market
- 14.6.1. Country Segmental Analysis
- 14.6.2. Material Type
- 14.6.3. Packaging Type
- 14.6.4. Technology
- 14.6.5. Product Form
- 14.6.6. Capacity Range
- 14.6.7. Distribution Channel
- 14.6.8. End-use Industry
- 15. Europe Green Packaging Market Analysis
- 15.1. Key Segment Analysis
- 15.2. Regional Snapshot
- 15.3. Europe Green Packaging Market Size (Value - US$ Bn), Analysis, and Forecasts, 2021-2035
- 15.3.1. Material Type
- 15.3.2. Packaging Type
- 15.3.3. Technology
- 15.3.4. Product Form
- 15.3.5. Capacity Range
- 15.3.6. Distribution Channel
- 15.3.7. End-use Industry
- 15.3.8. Country
- 15.3.8.1. Germany
- 15.3.8.2. United Kingdom
- 15.3.8.3. France
- 15.3.8.4. Italy
- 15.3.8.5. Spain
- 15.3.8.6. Netherlands
- 15.3.8.7. Nordic Countries
- 15.3.8.8. Poland
- 15.3.8.9. Russia & CIS
- 15.3.8.10. Rest of Europe
- 15.4. Germany Green Packaging Market
- 15.4.1. Country Segmental Analysis
- 15.4.2. Material Type
- 15.4.3. Packaging Type
- 15.4.4. Technology
- 15.4.5. Product Form
- 15.4.6. Capacity Range
- 15.4.7. Distribution Channel
- 15.4.8. End-use Industry
- 15.5. United Kingdom Green Packaging Market
- 15.5.1. Country Segmental Analysis
- 15.5.2. Material Type
- 15.5.3. Packaging Type
- 15.5.4. Technology
- 15.5.5. Product Form
- 15.5.6. Capacity Range
- 15.5.7. Distribution Channel
- 15.5.8. End-use Industry
- 15.6. France Green Packaging Market
- 15.6.1. Country Segmental Analysis
- 15.6.2. Material Type
- 15.6.3. Packaging Type
- 15.6.4. Technology
- 15.6.5. Product Form
- 15.6.6. Capacity Range
- 15.6.7. Distribution Channel
- 15.6.8. End-use Industry
- 15.7. Italy Green Packaging Market
- 15.7.1. Country Segmental Analysis
- 15.7.2. Material Type
- 15.7.3. Packaging Type
- 15.7.4. Technology
- 15.7.5. Product Form
- 15.7.6. Capacity Range
- 15.7.7. Distribution Channel
- 15.7.8. End-use Industry
- 15.8. Spain Green Packaging Market
- 15.8.1. Country Segmental Analysis
- 15.8.2. Material Type
- 15.8.3. Packaging Type
- 15.8.4. Technology
- 15.8.5. Product Form
- 15.8.6. Capacity Range
- 15.8.7. Distribution Channel
- 15.8.8. End-use Industry
- 15.9. Netherlands Green Packaging Market
- 15.9.1. Country Segmental Analysis
- 15.9.2. Material Type
- 15.9.3. Packaging Type
- 15.9.4. Technology
- 15.9.5. Product Form
- 15.9.6. Capacity Range
- 15.9.7. Distribution Channel
- 15.9.8. End-use Industry
- 15.10. Nordic Countries Green Packaging Market
- 15.10.1. Country Segmental Analysis
- 15.10.2. Material Type
- 15.10.3. Packaging Type
- 15.10.4. Technology
- 15.10.5. Product Form
- 15.10.6. Capacity Range
- 15.10.7. Distribution Channel
- 15.10.8. End-use Industry
- 15.11. Poland Green Packaging Market
- 15.11.1. Country Segmental Analysis
- 15.11.2. Material Type
- 15.11.3. Packaging Type
- 15.11.4. Technology
- 15.11.5. Product Form
- 15.11.6. Capacity Range
- 15.11.7. Distribution Channel
- 15.11.8. End-use Industry
- 15.12. Russia & CIS Green Packaging Market
- 15.12.1. Country Segmental Analysis
- 15.12.2. Material Type
- 15.12.3. Packaging Type
- 15.12.4. Technology
- 15.12.5. Product Form
- 15.12.6. Capacity Range
- 15.12.7. Distribution Channel
- 15.12.8. End-use Industry
- 15.13. Rest of Europe Green Packaging Market
- 15.13.1. Country Segmental Analysis
- 15.13.2. Material Type
- 15.13.3. Packaging Type
- 15.13.4. Technology
- 15.13.5. Product Form
- 15.13.6. Capacity Range
- 15.13.7. Distribution Channel
- 15.13.8. End-use Industry
- 16. Asia Pacific Green Packaging Market Analysis
- 16.1. Key Segment Analysis
- 16.2. Regional Snapshot
- 16.3. Asia Pacific Green Packaging Market Size (Value - US$ Bn), Analysis, and Forecasts, 2021-2035
- 16.3.1. Material Type
- 16.3.2. Packaging Type
- 16.3.3. Technology
- 16.3.4. Product Form
- 16.3.5. Capacity Range
- 16.3.6. Distribution Channel
- 16.3.7. End-use Industry
- 16.3.8. Country
- 16.3.8.1. China
- 16.3.8.2. India
- 16.3.8.3. Japan
- 16.3.8.4. South Korea
- 16.3.8.5. Australia and New Zealand
- 16.3.8.6. Indonesia
- 16.3.8.7. Malaysia
- 16.3.8.8. Thailand
- 16.3.8.9. Vietnam
- 16.3.8.10. Rest of Asia Pacific
- 16.4. China Green Packaging Market
- 16.4.1. Country Segmental Analysis
- 16.4.2. Material Type
- 16.4.3. Packaging Type
- 16.4.4. Technology
- 16.4.5. Product Form
- 16.4.6. Capacity Range
- 16.4.7. Distribution Channel
- 16.4.8. End-use Industry
- 16.5. India Green Packaging Market
- 16.5.1. Country Segmental Analysis
- 16.5.2. Material Type
- 16.5.3. Packaging Type
- 16.5.4. Technology
- 16.5.5. Product Form
- 16.5.6. Capacity Range
- 16.5.7. Distribution Channel
- 16.5.8. End-use Industry
- 16.6. Japan Green Packaging Market
- 16.6.1. Country Segmental Analysis
- 16.6.2. Material Type
- 16.6.3. Packaging Type
- 16.6.4. Technology
- 16.6.5. Product Form
- 16.6.6. Capacity Range
- 16.6.7. Distribution Channel
- 16.6.8. End-use Industry
- 16.7. South Korea Green Packaging Market
- 16.7.1. Country Segmental Analysis
- 16.7.2. Material Type
- 16.7.3. Packaging Type
- 16.7.4. Technology
- 16.7.5. Product Form
- 16.7.6. Capacity Range
- 16.7.7. Distribution Channel
- 16.7.8. End-use Industry
- 16.8. Australia and New Zealand Green Packaging Market
- 16.8.1. Country Segmental Analysis
- 16.8.2. Material Type
- 16.8.3. Packaging Type
- 16.8.4. Technology
- 16.8.5. Product Form
- 16.8.6. Capacity Range
- 16.8.7. Distribution Channel
- 16.8.8. End-use Industry
- 16.9. Indonesia Green Packaging Market
- 16.9.1. Country Segmental Analysis
- 16.9.2. Material Type
- 16.9.3. Packaging Type
- 16.9.4. Technology
- 16.9.5. Product Form
- 16.9.6. Capacity Range
- 16.9.7. Distribution Channel
- 16.9.8. End-use Industry
- 16.10. Malaysia Green Packaging Market
- 16.10.1. Country Segmental Analysis
- 16.10.2. Material Type
- 16.10.3. Packaging Type
- 16.10.4. Technology
- 16.10.5. Product Form
- 16.10.6. Capacity Range
- 16.10.7. Distribution Channel
- 16.10.8. End-use Industry
- 16.11. Thailand Green Packaging Market
- 16.11.1. Country Segmental Analysis
- 16.11.2. Material Type
- 16.11.3. Packaging Type
- 16.11.4. Technology
- 16.11.5. Product Form
- 16.11.6. Capacity Range
- 16.11.7. Distribution Channel
- 16.11.8. End-use Industry
- 16.12. Vietnam Green Packaging Market
- 16.12.1. Country Segmental Analysis
- 16.12.2. Material Type
- 16.12.3. Packaging Type
- 16.12.4. Technology
- 16.12.5. Product Form
- 16.12.6. Capacity Range
- 16.12.7. Distribution Channel
- 16.12.8. End-use Industry
- 16.13. Rest of Asia Pacific Green Packaging Market
- 16.13.1. Country Segmental Analysis
- 16.13.2. Material Type
- 16.13.3. Packaging Type
- 16.13.4. Technology
- 16.13.5. Product Form
- 16.13.6. Capacity Range
- 16.13.7. Distribution Channel
- 16.13.8. End-use Industry
- 17. Middle East Green Packaging Market Analysis
- 17.1. Key Segment Analysis
- 17.2. Regional Snapshot
- 17.3. Middle East Green Packaging Market Size (Value - US$ Bn), Analysis, and Forecasts, 2021-2035
- 17.3.1. Material Type
- 17.3.2. Packaging Type
- 17.3.3. Technology
- 17.3.4. Product Form
- 17.3.5. Capacity Range
- 17.3.6. Distribution Channel
- 17.3.7. End-use Industry
- 17.3.8. Country
- 17.3.8.1. Turkey
- 17.3.8.2. UAE
- 17.3.8.3. Saudi Arabia
- 17.3.8.4. Israel
- 17.3.8.5. Rest of Middle East
- 17.4. Turkey Green Packaging Market
- 17.4.1. Country Segmental Analysis
- 17.4.2. Material Type
- 17.4.3. Packaging Type
- 17.4.4. Technology
- 17.4.5. Product Form
- 17.4.6. Capacity Range
- 17.4.7. Distribution Channel
- 17.4.8. End-use Industry
- 17.5. UAE Green Packaging Market
- 17.5.1. Country Segmental Analysis
- 17.5.2. Material Type
- 17.5.3. Packaging Type
- 17.5.4. Technology
- 17.5.5. Product Form
- 17.5.6. Capacity Range
- 17.5.7. Distribution Channel
- 17.5.8. End-use Industry
- 17.6. Saudi Arabia Green Packaging Market
- 17.6.1. Country Segmental Analysis
- 17.6.2. Material Type
- 17.6.3. Packaging Type
- 17.6.4. Technology
- 17.6.5. Product Form
- 17.6.6. Capacity Range
- 17.6.7. Distribution Channel
- 17.6.8. End-use Industry
- 17.7. Israel Green Packaging Market
- 17.7.1. Country Segmental Analysis
- 17.7.2. Material Type
- 17.7.3. Packaging Type
- 17.7.4. Technology
- 17.7.5. Product Form
- 17.7.6. Capacity Range
- 17.7.7. Distribution Channel
- 17.7.8. End-use Industry
- 17.8. Rest of Middle East Green Packaging Market
- 17.8.1. Country Segmental Analysis
- 17.8.2. Material Type
- 17.8.3. Packaging Type
- 17.8.4. Technology
- 17.8.5. Product Form
- 17.8.6. Capacity Range
- 17.8.7. Distribution Channel
- 17.8.8. End-use Industry
- 18. Africa Green Packaging Market Analysis
- 18.1. Key Segment Analysis
- 18.2. Regional Snapshot
- 18.3. Africa Green Packaging Market Size (Value - US$ Bn), Analysis, and Forecasts, 2021-2035
- 18.3.1. Material Type
- 18.3.2. Packaging Type
- 18.3.3. Technology
- 18.3.4. Product Form
- 18.3.5. Capacity Range
- 18.3.6. Distribution Channel
- 18.3.7. End-use Industry
- 18.3.8. Country
- 18.3.8.1. South Africa
- 18.3.8.2. Egypt
- 18.3.8.3. Nigeria
- 18.3.8.4. Algeria
- 18.3.8.5. Rest of Africa
- 18.4. South Africa Green Packaging Market
- 18.4.1. Country Segmental Analysis
- 18.4.2. Material Type
- 18.4.3. Packaging Type
- 18.4.4. Technology
- 18.4.5. Product Form
- 18.4.6. Capacity Range
- 18.4.7. Distribution Channel
- 18.4.8. End-use Industry
- 18.5. Egypt Green Packaging Market
- 18.5.1. Country Segmental Analysis
- 18.5.2. Material Type
- 18.5.3. Packaging Type
- 18.5.4. Technology
- 18.5.5. Product Form
- 18.5.6. Capacity Range
- 18.5.7. Distribution Channel
- 18.5.8. End-use Industry
- 18.6. Nigeria Green Packaging Market
- 18.6.1. Country Segmental Analysis
- 18.6.2. Material Type
- 18.6.3. Packaging Type
- 18.6.4. Technology
- 18.6.5. Product Form
- 18.6.6. Capacity Range
- 18.6.7. Distribution Channel
- 18.6.8. End-use Industry
- 18.7. Algeria Green Packaging Market
- 18.7.1. Country Segmental Analysis
- 18.7.2. Material Type
- 18.7.3. Packaging Type
- 18.7.4. Technology
- 18.7.5. Product Form
- 18.7.6. Capacity Range
- 18.7.7. Distribution Channel
- 18.7.8. End-use Industry
- 18.8. Rest of Africa Green Packaging Market
- 18.8.1. Country Segmental Analysis
- 18.8.2. Material Type
- 18.8.3. Packaging Type
- 18.8.4. Technology
- 18.8.5. Product Form
- 18.8.6. Capacity Range
- 18.8.7. Distribution Channel
- 18.8.8. End-use Industry
- 19. South America Green Packaging Market Analysis
- 19.1. Key Segment Analysis
- 19.2. Regional Snapshot
- 19.3. South Africa Green Packaging Market Size (Value - US$ Bn), Analysis, and Forecasts, 2021-2035
- 19.3.1. Material Type
- 19.3.2. Packaging Type
- 19.3.3. Technology
- 19.3.4. Product Form
- 19.3.5. Capacity Range
- 19.3.6. Distribution Channel
- 19.3.7. End-use Industry
- 19.3.8. Country
- 19.3.8.1. Brazil
- 19.3.8.2. Argentina
- 19.3.8.3. Rest of South America
- 19.4. Brazil Green Packaging Market
- 19.4.1. Country Segmental Analysis
- 19.4.2. Material Type
- 19.4.3. Packaging Type
- 19.4.4. Technology
- 19.4.5. Product Form
- 19.4.6. Capacity Range
- 19.4.7. Distribution Channel
- 19.4.8. End-use Industry
- 19.5. Argentina Green Packaging Market
- 19.5.1. Country Segmental Analysis
- 19.5.2. Material Type
- 19.5.3. Packaging Type
- 19.5.4. Technology
- 19.5.5. Product Form
- 19.5.6. Capacity Range
- 19.5.7. Distribution Channel
- 19.5.8. End-use Industry
- 19.6. Rest of South America Green Packaging Market
- 19.6.1. Country Segmental Analysis
- 19.6.2. Material Type
- 19.6.3. Packaging Type
- 19.6.4. Technology
- 19.6.5. Product Form
- 19.6.6. Capacity Range
- 19.6.7. Distribution Channel
- 19.6.8. End-use Industry
- 20. Key Players/ Company Profile
- 20.1. Amcor plc
- 20.1.1. Company Details/ Overview
- 20.1.2. Company Financials
- 20.1.3. Key Customers and Competitors
- 20.1.4. Business/ Industry Portfolio
- 20.1.5. Product Portfolio/ Specification Details
- 20.1.6. Pricing Data
- 20.1.7. Strategic Overview
- 20.1.8. Recent Developments
- 20.2. Ardagh Group
- 20.3. Ball Corporation
- 20.4. BASF SE
- 20.5. Berry Global Inc.
- 20.6. BioPak
- 20.7. Cascades Inc.
- 20.8. Coveris Holdings
- 20.9. DS Smith plc
- 20.10. Graphic Packaging International
- 20.11. Huhtamaki Oyj
- 20.12. International Paper Company
- 20.13. Mondi Group
- 20.14. NatureWorks LLC
- 20.15. Novamont S.p.A.
- 20.16. Sealed Air Corporation
- 20.17. Smurfit Kappa Group
- 20.18. Sonoco Products Company
- 20.19. Tetra Pak International
- 20.20. Vegware Ltd.
- 20.21. WestRock Company
- 20.22. Other Key Players
- 20.1. Amcor plc
Note* - This is just tentative list of players. While providing the report, we will cover more number of players based on their revenue and share for each geography
Research Design
Our research design integrates both demand-side and supply-side analysis through a balanced combination of primary and secondary research methodologies. By utilizing both bottom-up and top-down approaches alongside rigorous data triangulation methods, we deliver robust market intelligence that supports strategic decision-making.
MarketGenics' comprehensive research design framework ensures the delivery of accurate, reliable, and actionable market intelligence. Through the integration of multiple research approaches, rigorous validation processes, and expert analysis, we provide our clients with the insights needed to make informed strategic decisions and capitalize on market opportunities.

MarketGenics leverages a dedicated industry panel of experts and a comprehensive suite of paid databases to effectively collect, consolidate, and analyze market intelligence.
Our approach has consistently proven to be reliable and effective in generating accurate market insights, identifying key industry trends, and uncovering emerging business opportunities.
Through both primary and secondary research, we capture and analyze critical company-level data such as manufacturing footprints, including technical centers, R&D facilities, sales offices, and headquarters.
Our expert panel further enhances our ability to estimate market size for specific brands based on validated field-level intelligence.
Our data mining techniques incorporate both parametric and non-parametric methods, allowing for structured data collection, sorting, processing, and cleaning.
Demand projections are derived from large-scale data sets analyzed through proprietary algorithms, culminating in robust and reliable market sizing.
Research Approach
The bottom-up approach builds market estimates by starting with the smallest addressable market units and systematically aggregating them to create comprehensive market size projections.
This method begins with specific, granular data points and builds upward to create the complete market landscape.
Customer Analysis → Segmental Analysis → Geographical Analysis
The top-down approach starts with the broadest possible market data and systematically narrows it down through a series of filters and assumptions to arrive at specific market segments or opportunities.
This method begins with the big picture and works downward to increasingly specific market slices.
TAM → SAM → SOM


Research Methods
Desk / Secondary Research
While analysing the market, we extensively study secondary sources, directories, and databases to identify and collect information useful for this technical, market-oriented, and commercial report. Secondary sources that we utilize are not only the public sources, but it is a combination of Open Source, Associations, Paid Databases, MG Repository & Knowledgebase, and others.
- Company websites, annual reports, financial reports, broker reports, and investor presentations
- National government documents, statistical databases and reports
- News articles, press releases and web-casts specific to the companies operating in the market, Magazines, reports, and others
- We gather information from commercial data sources for deriving company specific data such as segmental revenue, share for geography, product revenue, and others
- Internal and external proprietary databases (industry-specific), relevant patent, and regulatory databases
- Governing Bodies, Government Organizations
- Relevant Authorities, Country-specific Associations for Industries
We also employ the model mapping approach to estimate the product level market data through the players' product portfolio
Primary Research
Primary research/ interviews is vital in analyzing the market. Most of the cases involves paid primary interviews. Primary sources include primary interviews through e-mail interactions, telephonic interviews, surveys as well as face-to-face interviews with the different stakeholders across the value chain including several industry experts.
| Type of Respondents | Number of Primaries |
|---|---|
| Tier 2/3 Suppliers | ~20 |
| Tier 1 Suppliers | ~25 |
| End-users | ~25 |
| Industry Expert/ Panel/ Consultant | ~30 |
| Total | ~100 |
MG Knowledgebase
• Repository of industry blog, newsletter and case studies
• Online platform covering detailed market reports, and company profiles
Forecasting Factors and Models
Forecasting Factors
- Historical Trends – Past market patterns, cycles, and major events that shaped how markets behave over time. Understanding past trends helps predict future behavior.
- Industry Factors – Specific characteristics of the industry like structure, regulations, and innovation cycles that affect market dynamics.
- Macroeconomic Factors – Economic conditions like GDP growth, inflation, and employment rates that affect how much money people have to spend.
- Demographic Factors – Population characteristics like age, income, and location that determine who can buy your product.
- Technology Factors – How quickly people adopt new technology and how much technology infrastructure exists.
- Regulatory Factors – Government rules, laws, and policies that can help or restrict market growth.
- Competitive Factors – Analyzing competition structure such as degree of competition and bargaining power of buyers and suppliers.
Forecasting Models / Techniques
Multiple Regression Analysis
- Identify and quantify factors that drive market changes
- Statistical modeling to establish relationships between market drivers and outcomes
Time Series Analysis – Seasonal Patterns
- Understand regular cyclical patterns in market demand
- Advanced statistical techniques to separate trend, seasonal, and irregular components
Time Series Analysis – Trend Analysis
- Identify underlying market growth patterns and momentum
- Statistical analysis of historical data to project future trends
Expert Opinion – Expert Interviews
- Gather deep industry insights and contextual understanding
- In-depth interviews with key industry stakeholders
Multi-Scenario Development
- Prepare for uncertainty by modeling different possible futures
- Creating optimistic, pessimistic, and most likely scenarios
Time Series Analysis – Moving Averages
- Sophisticated forecasting for complex time series data
- Auto-regressive integrated moving average models with seasonal components
Econometric Models
- Apply economic theory to market forecasting
- Sophisticated economic models that account for market interactions
Expert Opinion – Delphi Method
- Harness collective wisdom of industry experts
- Structured, multi-round expert consultation process
Monte Carlo Simulation
- Quantify uncertainty and probability distributions
- Thousands of simulations with varying input parameters
Research Analysis
Our research framework is built upon the fundamental principle of validating market intelligence from both demand and supply perspectives. This dual-sided approach ensures comprehensive market understanding and reduces the risk of single-source bias.
Demand-Side Analysis: We understand end-user/application behavior, preferences, and market needs along with the penetration of the product for specific application.
Supply-Side Analysis: We estimate overall market revenue, analyze the segmental share along with industry capacity, competitive landscape, and market structure.
Validation & Evaluation
Data triangulation is a validation technique that uses multiple methods, sources, or perspectives to examine the same research question, thereby increasing the credibility and reliability of research findings. In market research, triangulation serves as a quality assurance mechanism that helps identify and minimize bias, validate assumptions, and ensure accuracy in market estimates.
- Data Source Triangulation – Using multiple data sources to examine the same phenomenon
- Methodological Triangulation – Using multiple research methods to study the same research question
- Investigator Triangulation – Using multiple researchers or analysts to examine the same data
- Theoretical Triangulation – Using multiple theoretical perspectives to interpret the same data

Custom Market Research Services
We will customise the research for you, in case the report listed above does not meet your requirements.
Get 10% Free Customisation