Military Displays Market Size, Share & Trends Analysis Report by Display Type (LCD Display, LED Display, OLED Display, AMOLED Display, Electroluminescent Display (ELD), Thin Film Transistor (TFT) Display, Electronic Paper Display (EPD), Cathode Ray Tube (CRT) Display, Others), Display Size, Display Technology, Brightness Level, Display Configuration, Mounting Type, Durability Rating, End-Use X Applications, and Geography (North America, Europe, Asia Pacific, Middle East, Africa, and South America) – Global Industry Data, Trends, and Forecasts, 2026–2035
|
|
|
Segmental Data Insights |
|
|
Demand Trends |
|
|
Competitive Landscape |
|
|
Strategic Development |
|
|
Future Outlook & Opportunities |
|
Military Displays Market Size, Share, and Growth
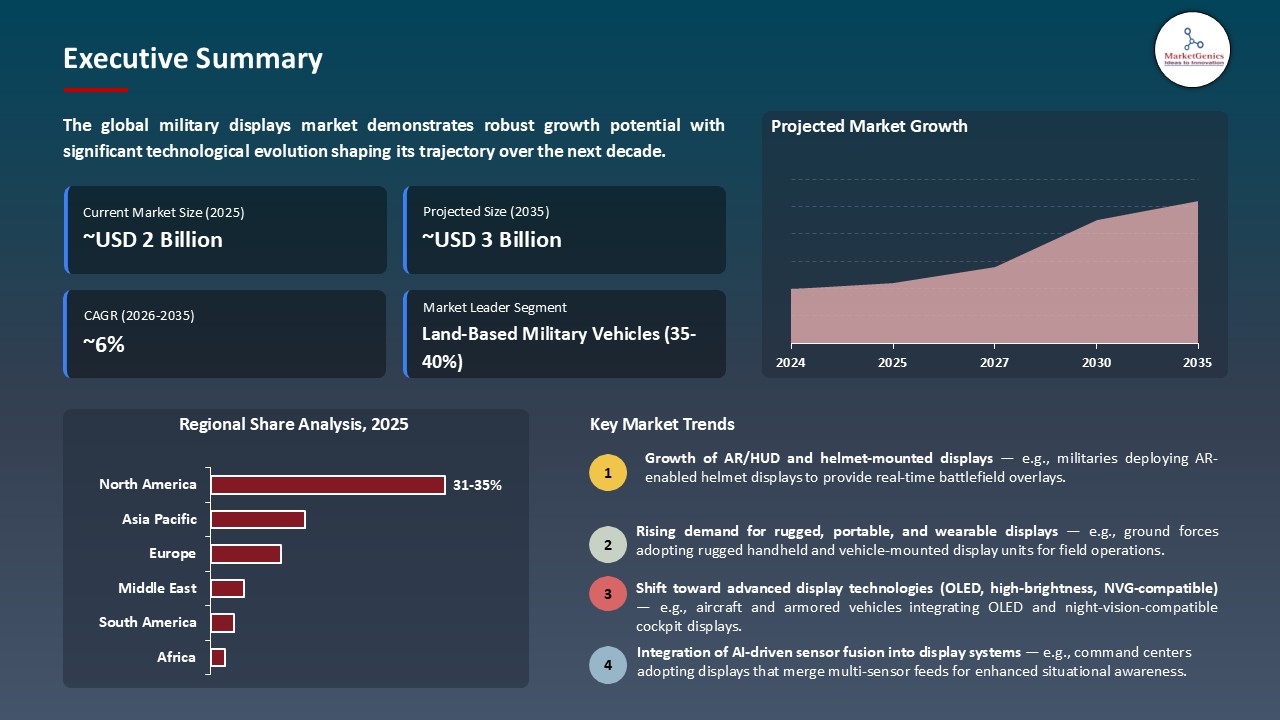
The global military displays market is experiencing robust growth, with its estimated value of USD 1.6 billion in the year 2025 and USD 2.8 billion by the period 2035, registering a CAGR of 5.8%, during the forecast period. The global military displays market demand is driven by rising defense budgets, modernization of aircraft and ground vehicles, the need for advanced situational awareness, integration of AR/HUD and sensor-fusion technologies, and the push for rugged, high-resolution, and mission-ready display systems across military platforms.
Matt Milas, President of Defense and Space, Honeywell Aerospace, said, “We are excited to collaborate with Rheinmetall AG to bring our cutting-edge technology to support the missions of our allies across the world. New and existing programs will benefit from our joint development, production and sustainment efforts across an extensive list of global defense platforms.”
The global military displays market is propelled by modernization efforts and the demand of next-generation avionics and helmet-mounted display systems. As an example, in February 2024, Collins Elbit Vision Systems was able to complete the 3,000th F 35 Gen III Helmet-Mounted Display System to deployed units, highlighting its scale in manufacturing and deploying its products. The achievement will solidify market dominance and hasten the use of sophisticated military display systems.
Additionally, the military displays market is further driven by the increasing demand of greater situational awareness and sensor-fusion facilities in the air, on land, and on the sea. For instance, in 2024, Elbit Systems of America secured a contract to supply helmet-mounted displays for U.S. Army helicopter crews, enhancing real-time battlefield visibility. This emergence increases the rate of gaining high-tech display systems and widens the possibility of market expansion.
The global military displays market presents adjacent opportunities in rugged wearable displays for soldiers, helmet-mounted augmented reality systems, unmanned aerial vehicle (UAV) control interfaces, naval bridge and command-center displays, and ground-vehicle sensor-fusion consoles. These adjacent markets increase the revenue potential, fuel technological advancement, and speed general implementation of sophisticated military display solutions.
Military Displays Market Dynamics and Trends
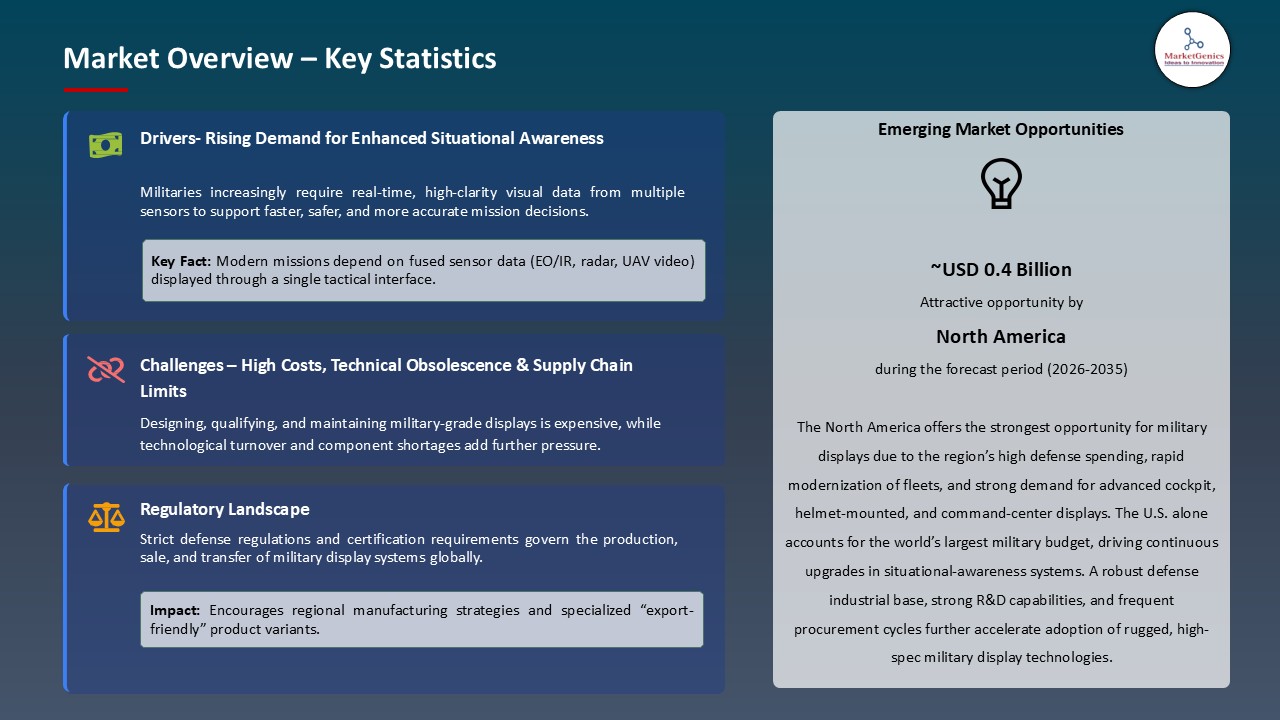
Driver: Increasing Global Defense Modernization Initiatives and Large-Scale Procurement of Next‑Gen Displays
- The military displays market strongly fueled by the efforts of global defence modernization and massive acquisition of next generation display systems. Countries around the globe are modernizing old airplanes, naval ships, and ground vehicles by providing them with sophisticated, mission-oriented displays to improve situational awareness, target accuracy and performance. This massive modernization is indicative of the strategic imperative of providing forces with the state-of-the-art capabilities.
- Modern displays, such as high-resolution cockpit displays, helmet-mounted displays, ruggedized vehicle displays, and increasingly sensor-fusion, augmented reality overlay, and real-time multi-source displays. These features allow more informed and rapid decision-making and enhance survival in complicated battlefields, and next-generation displays are essential to the present-day armies.
- For instance, in 2024, Kopin Corporation was awarded a follow-on production order of Collins Aerospace of high-brightness microdisplays in F-35 HMDS, which confirmed future usage of next-generation helmet-mounted displays.
- The increased volume of modern avionics and helmet-mounted displays deployments has fueled demand globally and increased the market share of mission-ready, advanced military display solutions.
Restraint: High Production and Integration Costs Limiting Adoption in Cost‑Sensitive Regions
- The military displays market faces significant constraints due to high cost of production and integration where adoption is limited especially among the cost-sensitive areas. The construction of hardened, MIL-specification display systems that can handle high temperatures, vibration, shock, and electromagnetic interference demands high materials, specialized parts, and test, which increase the cost of manufacturing.
- Furthermore, installing these displays into sophisticated systems like aircraft, armored vehicles or naval vessels requires a lot of engineering, software modification, and certification, which adds to the costs even more.
- The concentration of demand in more affluent countries impedes penetration around the world and limits market growth in developing markets, and high costs are the primary inhibition of growth.
Opportunity: Expansion into Rugged Land‑Vehicle and Ground‑System Display Markets
- The military displays market is experiencing significant opportunities by penetrating rugged land-vehicle and ground-system display segments. The military forces of many countries are engaging in the massive modernization of armored vehicles, tactical trucks, and command-and-control ground platforms, which prompts the need to use the high-performance displays that can be used successfully and efficiently in the fields of severe and non-foreseeable conditions.
- These rugged screens are designed to survive the toughest conditions including high temperatures, vibrations, shock, and electromagnetic interference besides providing real-time situational awareness. They combine themselves with sensors, communication systems and navigation tools to make the crews to make faster and more informed decisions in line of operation.
- For instance, Honeywell unveiled its 360° vehicle vision display for armored platforms at the AUSA conference, significantly enhancing crew visibility and operational efficiency in complex battlefield scenarios. This creation facilitates the manufacturers to access new revenue sources out of the aviation industry, which expands the market that can be addressed and the pace at which rugged military displays are being adopted globally.
- Diversification into rugged land-vehicle exhibits will increase market size and revenue lines other than aviation platforms.
Key Trend: Integration of Sensor‑Fusion and Multi‑Modal Data Overlays in Helmet and Cockpit Systems
- The military displays market is being transformed by the integration of sensor-fusion and multi-modal data overlays, which convert helmet and cockpit systems into advanced mission-management platforms. These technologies provide the opportunity to use several sensors as one and coherent visual visualization interface which improves the efficiency of operations and situational awareness.
- For instance, in August 2025, Sierra Nevada Corporation won a contract to deliver its Degraded Visual Environment Pilotage System (DVEPS), combining FLIR, radar, and LiDAR data to provide a real-time, 3D terrain and obstacle image on the helmet-mounted displays. This system enables crews in a helicopter to fly in low visibility conditions (e.g. dust, fog or darkness) and it greatly enhances the reliability of a mission.
- Additionally, the Scorpion Helmet-Mounted Display introduced by Thales Group superimposes targeting, pathfinding, and threat-tracking data on the visor of pilots in both daytime and night missions, increasing its efficiency. These innovations lower response times, enhancing the decision-making process and creating demand in the next generation of military display solutions and have been demonstrated by integrating multiple sensor streams to a single interface.
- These combined with advanced sensor-fusion and multi-modal display integration represent significant growth in situational awareness, operational efficiency, and drive the military displays market growth.
Military-Displays-Market Analysis and Segmental Data
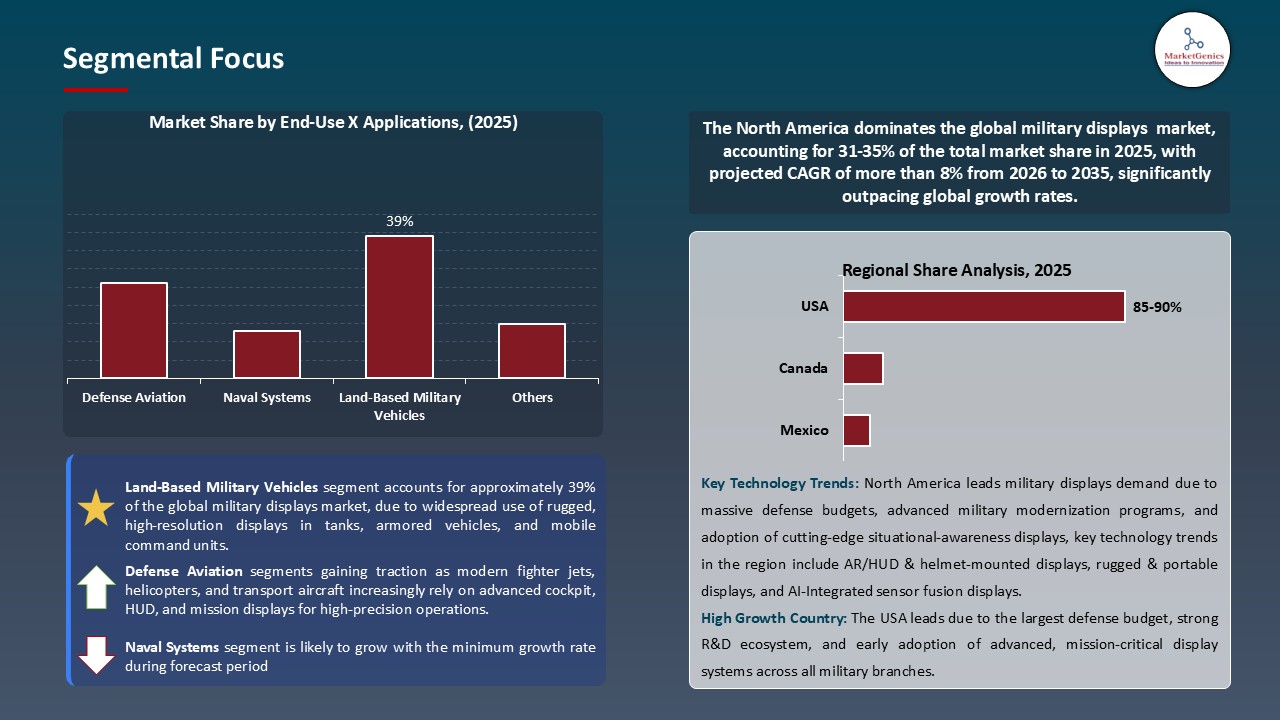
Land-Based Military Vehicles Dominate Global Military Displays Market
- The land-based military vehicles segment dominates the global military displays market because of the vast contemporary reconstruction and operation demands. Armored vehicles, main battle tanks, tactical trucks, and mobile command centers increasingly rely on high-resolution, ruggedized displays to provide crews with real-time situational awareness, navigation, targeting, and communication data.
- These display systems have high survivability to the battlefield, such as extreme temperature, shock, vibration, and electromagnetic interference, to guarantee their dependability on mission-critical tasks. These systems need to be durable and functional to the mission success and safety of the crew.
- For instance, in September 2025 Leonardo DRS introduced its new rugged smart displays ground line (Rugged Smart Displays Ground RSD-G), and marketing AI-enabled tough smart displays that are compatible with combat vehicles.
- The introduction of combat vehicles' robust smart displays with AI capabilities stimulates the development of the land-based military displays market, resulting in greater operational efficiency.
North America Leads Global Military Displays Market Demand
- North America leads the global military displays market, due to high spending on military, high modernization of its military and also because of high acceptance of latest technologies in its air, land and naval bases. The military forces in the region have focused on modernizing the old aircraft and armored vehicles and naval ships with high-resolution, rough, and mission-available displays.
- These displays have sensor-fusion, augmented reality, and real-time data, which enhance situational awareness, targeting, and decision-making, and are enhanced by the cockpit and helmet-mounted systems, which improve the efficiency of the missions.
- Recent acquisitions are related to the next-generation avionics orientation of North America with the robust defense sector and research and development resources supporting its status as the blargest and the fastest military displays market.
- For instance, in April 2025, Thales won a NATO bid to provide the U.S. Air Force with retrofit kits of Scorpion Helmet-Mounted Display on its F-16 fleet to replace old HMDs and standardize next-generation displays on all active and reserve units.
- North America investment in next generation displays enhances operational capabilities, expands the market and solidifies its dominance in the global military displays market.
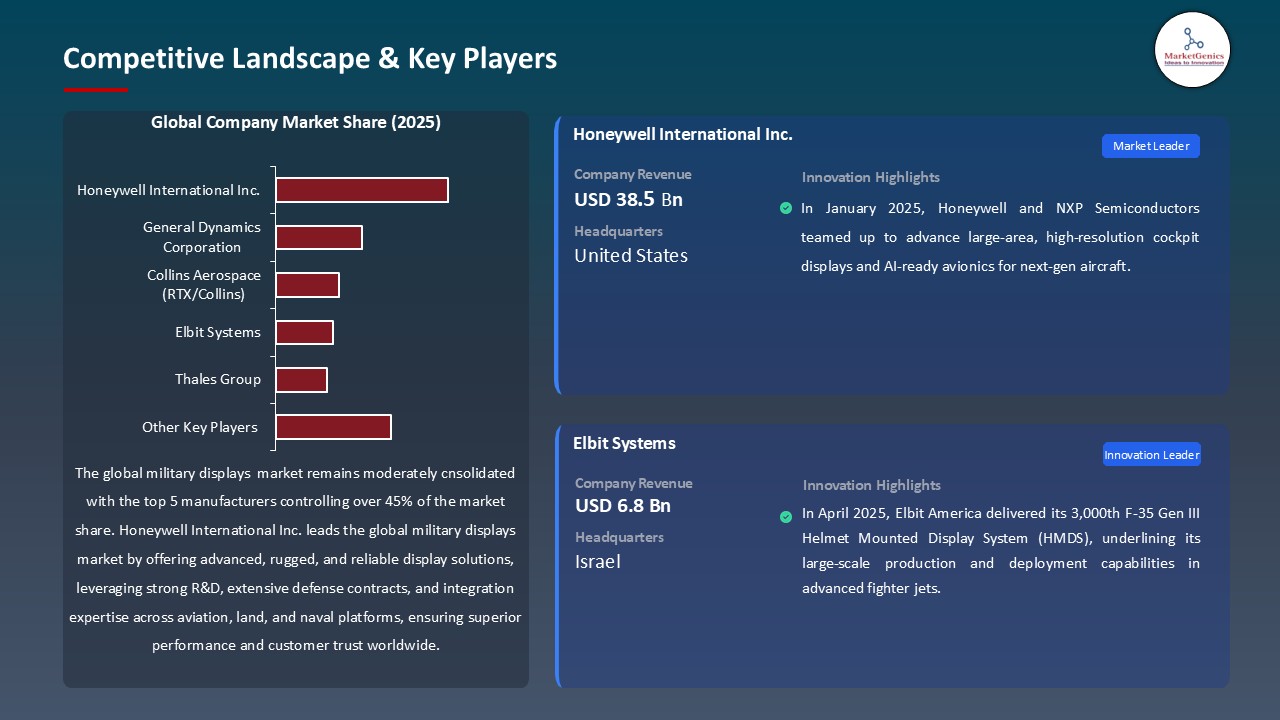
Military-Displays-Market Ecosystem
The global military displays market is moderately consolidated, with high concentration among key players such as Honeywell International Inc., General Dynamics Corporation, Collins Aerospace (RTX/Collins), Elbit Systems, and Thales Group, who dominate through continuous innovation, strategic defense contracts, advanced technology integration, and global supply chain network to provide rugged and high-performance display solutions to the air, land, and naval platforms.
Their robust R&D efforts and established connections with defense services enable them to win big contracts, shape the market standards, and shape the market trends, ensuring their continued leadership and competitive edge in the fast-changing display industry of the military domain.
Recent Development and Strategic Overview:
- In October 2024, Collins Aerospace demonstrated a modular open‑systems approach for U.S. Army aviation, showcasing how their display and avionics architecture can be flexibly upgraded across platforms.
- In September 2024, Honeywell and Rheinmetall AG have signed an MOU in order to use Honeywell expertise in displays and sensor fusions applied in vehicles together with Rheinmetall platforms, with a special focus on the creation of advanced visual systems in tactical and armored ground vehicles.
Report Scope
|
Detail |
|
|
Market Size in 2025 |
USD 1.6 Bn |
|
Market Forecast Value in 2035 |
USD 2.8 Bn |
|
Growth Rate (CAGR) |
5.8% |
|
Forecast Period |
2026 – 2035 |
|
Historical Data Available for |
2021 – 2024 |
|
Market Size Units |
US$ Billion for Value Million Units for Volume |
|
Report Format |
Electronic (PDF) + Excel |
|
North America |
Europe |
Asia Pacific |
Middle East |
Africa |
South America |
|
|
|
|
|
|
|
Companies Covered |
|
|||||
|
|
|
|
|
|
|
Military-Displays-Market Segmentation and Highlights
|
Segment |
Sub-segment |
|
Military Displays Market, By Display Type |
|
|
Military Displays Market, By Display Size |
|
|
Military Displays Market, By Display Technology |
|
|
Military Displays Market, By Rated Brightness Level |
|
|
Military Displays Market, By Display Configuration
|
|
|
Military Displays Market, By Mounting Type
|
|
|
Military Displays Market, By Durability Rating
|
|
|
Military Displays Market, By End-Use X Applications
|
|
Frequently Asked Questions
Table of Contents
- 1. Research Methodology and Assumptions
- 1.1. Definitions
- 1.2. Research Design and Approach
- 1.3. Data Collection Methods
- 1.4. Base Estimates and Calculations
- 1.5. Forecasting Models
- 1.5.1. Key Forecast Factors & Impact Analysis
- 1.6. Secondary Research
- 1.6.1. Open Sources
- 1.6.2. Paid Databases
- 1.6.3. Associations
- 1.7. Primary Research
- 1.7.1. Primary Sources
- 1.7.2. Primary Interviews with Stakeholders across Ecosystem
- 2. Executive Summary
- 2.1. Global Military Displays Market Outlook
- 2.1.1. Military Displays Market Size (Volume - Million Units and Value - US$ Bn), and Forecasts, 2021-2035
- 2.1.2. Compounded Annual Growth Rate Analysis
- 2.1.3. Growth Opportunity Analysis
- 2.1.4. Segmental Share Analysis
- 2.1.5. Geographical Share Analysis
- 2.2. Market Analysis and Facts
- 2.3. Supply-Demand Analysis
- 2.4. Competitive Benchmarking
- 2.5. Go-to- Market Strategy
- 2.5.1. Customer/ End-use Industry Assessment
- 2.5.2. Growth Opportunity Data, 2026-2035
- 2.5.2.1. Regional Data
- 2.5.2.2. Country Data
- 2.5.2.3. Segmental Data
- 2.5.3. Identification of Potential Market Spaces
- 2.5.4. GAP Analysis
- 2.5.5. Potential Attractive Price Points
- 2.5.6. Prevailing Market Risks & Challenges
- 2.5.7. Preferred Sales & Marketing Strategies
- 2.5.8. Key Recommendations and Analysis
- 2.5.9. A Way Forward
- 2.1. Global Military Displays Market Outlook
- 3. Industry Data and Premium Insights
- 3.1. Global Aerospace & Defense Industry Overview, 2025
- 3.1.1. Aerospace & Defense Industry Ecosystem Analysis
- 3.1.2. Key Trends for Aerospace & Defense Industry
- 3.1.3. Regional Distribution for Aerospace & Defense Industry
- 3.2. Supplier Customer Data
- 3.3. Technology Roadmap and Developments
- 3.4. Trade Analysis
- 3.4.1. Import & Export Analysis, 2025
- 3.4.2. Top Importing Countries
- 3.4.3. Top Exporting Countries
- 3.5. Trump Tariff Impact Analysis
- 3.5.1. Manufacturer
- 3.5.1.1. Based on the component & Raw material
- 3.5.2. Supply Chain
- 3.5.3. End Consumer
- 3.5.1. Manufacturer
- 3.6. Raw Material Analysis
- 3.1. Global Aerospace & Defense Industry Overview, 2025
- 4. Market Overview
- 4.1. Market Dynamics
- 4.1.1. Drivers
- 4.1.1.1. Rising global defense spending and modernization programs
- 4.1.1.2. Increasing need for advanced situational awareness and real-time visualization
- 4.1.1.3. Rapid technological advancements in rugged, high-resolution, and mission-ready displays
- 4.1.2. Restraints
- 4.1.2.1. High development, procurement, and lifecycle costs of military-grade displays
- 4.1.2.2. Strict regulatory, certification, and procurement constraints
- 4.1.1. Drivers
- 4.2. Key Trend Analysis
- 4.3. Regulatory Framework
- 4.3.1. Key Regulations, Norms, and Subsidies, by Key Countries
- 4.3.2. Tariffs and Standards
- 4.3.3. Impact Analysis of Regulations on the Market
- 4.4. Value Chain Analysis
- 4.4.1. Raw Material Suppliers
- 4.4.2. Military Displays Manufacturers
- 4.4.3. Distributors / Retailers
- 4.4.4. End-Users/Application
- 4.5. Porter’s Five Forces Analysis
- 4.6. PESTEL Analysis
- 4.7. Global Military Displays Market Demand
- 4.7.1. Historical Market Size – Volume (Million Units) and Value (US$ Bn), 2020-2024
- 4.7.2. Current and Future Market Size – Volume (Million Units) and Value (US$ Bn), 2026–2035
- 4.7.2.1. Y-o-Y Growth Trends
- 4.7.2.2. Absolute $ Opportunity Assessment
- 4.1. Market Dynamics
- 5. Competition Landscape
- 5.1. Competition structure
- 5.1.1. Fragmented v/s consolidated
- 5.2. Company Share Analysis, 2025
- 5.2.1. Global Company Market Share
- 5.2.2. By Region
- 5.2.2.1. North America
- 5.2.2.2. Europe
- 5.2.2.3. Asia Pacific
- 5.2.2.4. Middle East
- 5.2.2.5. Africa
- 5.2.2.6. South America
- 5.3. Product Comparison Matrix
- 5.3.1. Specifications
- 5.3.2. Market Positioning
- 5.3.3. Pricing
- 5.1. Competition structure
- 6. Global Military Displays Market Analysis, by Display Type
- 6.1. Key Segment Analysis
- 6.2. Military Displays Market Size (Volume - Million Units and Value - US$ Bn), Analysis, and Forecasts, by Display Type, 2021-2035
- 6.2.1. LCD Display
- 6.2.2. LED Display
- 6.2.3. OLED Display
- 6.2.4. AMOLED Display
- 6.2.5. Electroluminescent Display (ELD)
- 6.2.6. Thin Film Transistor (TFT) Display
- 6.2.7. Electronic Paper Display (EPD)
- 6.2.8. Cathode Ray Tube (CRT) Display
- 6.2.9. Others
- 7. Global Military Displays Market Analysis, by Display Size
- 7.1. Key Segment Analysis
- 7.2. Military Displays Market Size (Volume - Million Units and Value - US$ Bn), Analysis, and Forecasts, by Display Size, 2021-2035
- 7.2.1. Less than 10 inches
- 7.2.2. 10-20 inches
- 7.2.3. 20-30 inches
- 7.2.4. Above 30 inches
- 8. Global Military Displays Market Analysis, by Display Technology
- 8.1. Key Segment Analysis
- 8.2. Military Displays Market Size (Volume - Million Units and Value - US$ Bn), Analysis, and Forecasts, by Display Technology, 2021-2035
- 8.2.1. Touch Screen Display
- 8.2.1.1. Resistive Touch
- 8.2.1.2. Capacitive Touch
- 8.2.1.3. Surface Acoustic Wave (SAW)
- 8.2.1.4. Infrared Touch
- 8.2.1.5. Others
- 8.2.2. Non-Touch Screen Display
- 8.2.2.1. Head-Up Display (HUD)
- 8.2.2.2. Head-Mounted Display (HMD)
- 8.2.2.3. Helmet-Mounted Display
- 8.2.2.4. Others
- 8.2.1. Touch Screen Display
- 9. Global Military Displays Market Analysis, by Brightness Level
- 9.1. Key Segment Analysis
- 9.2. Military Displays Market Size (Volume - Million Units and Value - US$ Bn), Analysis, and Forecasts, by Brightness Level, 2021-2035
- 9.2.1. Less than 500 nits
- 9.2.2. 500-1000 nits
- 9.2.3. 1000-2000 nits
- 9.2.4. Above 2000 nits
- 10. Global Military Displays Market Analysis, by Display Configuration
- 10.1. Key Segment Analysis
- 10.2. Military Displays Market Size (Volume - Million Units and Value - US$ Bn), Analysis, and Forecasts, by Display Configuration, 2021-2035
- 10.2.1. Standalone Display
- 10.2.2. Multi-Display Systems
- 10.2.3. Reconfigurable Display Systems
- 10.2.4. Integrated Display Suites
- 11. Global Military Displays Market Analysis, by Mounting Type
- 11.1. Key Segment Analysis
- 11.1.1. Military Displays Market Size (Volume - Million Units and Value - US$ Bn), Analysis, and Forecasts, by Mounting Type, 2021-2035
- 11.1.2. Panel Mount
- 11.1.3. Rack Mount
- 11.1.4. Console Mount
- 11.1.5. Portable/Handheld
- 11.1.6. Vehicle/Platform Integrated
- 11.1. Key Segment Analysis
- 12. Global Military Displays Market Analysis, by Durability Rating
- 12.1. Key Segment Analysis
- 12.2. Military Displays Market Size (Volume - Million Units and Value - US$ Bn), Analysis, and Forecasts, by Durability Rating, 2021-2035
- 12.2.1. Commercial Grade
- 12.2.2. Industrial Grade
- 12.2.3. Military Standard (MIL-STD-810)
- 12.2.4. Ruggedized Military Grade
- 12.2.5. Extreme Environment Certified
- 13. Global Military Displays Market Analysis, by End-Use X Applications
- 13.1. Key Segment Analysis
- 13.2. Military Displays Market Size (Volume - Million Units and Value - US$ Bn), Analysis, and Forecasts, by End-Use X Applications, 2021-2035
- 13.2.1. Defense Aviation
- 13.2.1.1. Cockpit Display Systems
- 13.2.1.2. Navigation Displays
- 13.2.1.3. Mission Control Displays
- 13.2.1.4. Weapons Targeting Displays
- 13.2.1.5. Aircraft Health Monitoring Displays
- 13.2.1.6. Flight Training Simulators
- 13.2.1.7. Others
- 13.2.2. Naval Systems
- 13.2.2.1. Bridge Display Systems
- 13.2.2.2. Combat Information Center (CIC) Displays
- 13.2.2.3. Navigation and Sonar Displays
- 13.2.2.4. Submarine Periscope Displays
- 13.2.2.5. Weapons Control Displays
- 13.2.2.6. Ship Control and Monitoring
- 13.2.2.7. Others
- 13.2.3. Land-Based Military Vehicles
- 13.2.3.1. Tank Commander Displays
- 13.2.3.2. Driver Vision Displays
- 13.2.3.3. Weapons Sight Displays
- 13.2.3.4. Situational Awareness Displays
- 13.2.3.5. Vehicle Diagnostic Displays
- 13.2.3.6. Armored Personnel Carrier (APC) Systems
- 13.2.3.7. Others
- 13.2.4. Command and Control Centers
- 13.2.4.1. Situation Room Displays
- 13.2.4.2. Video Wall Systems
- 13.2.4.3. Tactical Operations Center Displays
- 13.2.4.4. Multi-Function Workstations
- 13.2.4.5. Intelligence Analysis Displays
- 13.2.4.6. Communication Monitoring Systems
- 13.2.4.7. Others
- 13.2.5. Soldier Systems
- 13.2.5.1. Wearable Tactical Displays
- 13.2.5.2. Night Vision Display Systems
- 13.2.5.3. Augmented Reality Combat Displays
- 13.2.5.4. Handheld Mission Computers
- 13.2.5.5. Body-Worn Cameras and Displays
- 13.2.5.6. Individual Soldier Systems
- 13.2.5.7. Others
- 13.2.6. Unmanned Systems
- 13.2.6.1. UAV (Unmanned Aerial Vehicle) Ground Control Displays
- 13.2.6.2. UGV (Unmanned Ground Vehicle) Control Stations
- 13.2.6.3. USV (Unmanned Surface Vehicle) Displays
- 13.2.6.4. Remote Weapons Station Displays
- 13.2.6.5. Drone Operator Consoles
- 13.2.6.6. Others
- 13.2.7. Simulation and Training
- 13.2.7.1. Flight Simulators
- 13.2.7.2. Combat Training Systems
- 13.2.7.3. Virtual Reality Training Displays
- 13.2.7.4. Mission Rehearsal Systems
- 13.2.7.5. Maintenance Training Displays
- 13.2.7.6. Others
- 13.2.8. Radar and Surveillance Systems
- 13.2.8.1. Air Defense Radar Displays
- 13.2.8.2. Ground Surveillance Displays
- 13.2.8.3. Maritime Radar Systems
- 13.2.8.4. Electronic Warfare Displays
- 13.2.8.5. Intelligence, Surveillance, and Reconnaissance (ISR) Displays
- 13.2.8.6. Others
- 13.2.1. Defense Aviation
- 14. Global Military Displays Market Analysis and Forecasts, by Region
- 14.1. Key Findings
- 14.2. Military Displays Market Size (Volume - Million Units and Value - US$ Bn), Analysis, and Forecasts, by Region, 2021-2035
- 14.2.1. North America
- 14.2.2. Europe
- 14.2.3. Asia Pacific
- 14.2.4. Middle East
- 14.2.5. Africa
- 14.2.6. South America
- 15. North America Military Displays Market Analysis
- 15.1. Key Segment Analysis
- 15.2. Regional Snapshot
- 15.3. North America Military Displays Market Size (Volume - Million Units and Value - US$ Bn), Analysis, and Forecasts, 2021-2035
- 15.3.1. Display Type
- 15.3.2. Display Size
- 15.3.3. Display Technology
- 15.3.4. Brightness Level
- 15.3.5. Display Configuration
- 15.3.6. Mounting Type
- 15.3.7. Durability Rating
- 15.3.8. End-Use X Applications
- 15.3.9. Country
- 15.3.9.1. USA
- 15.3.9.2. Canada
- 15.3.9.3. Mexico
- 15.4. USA Military Displays Market
- 15.4.1. Country Segmental Analysis
- 15.4.2. Display Type
- 15.4.3. Display Size
- 15.4.4. Display Technology
- 15.4.5. Brightness Level
- 15.4.6. Display Configuration
- 15.4.7. Mounting Type
- 15.4.8. Durability Rating
- 15.4.9. End-Use X Applications
- 15.5. Canada Military Displays Market
- 15.5.1. Country Segmental Analysis
- 15.5.2. Display Type
- 15.5.3. Display Size
- 15.5.4. Display Technology
- 15.5.5. Brightness Level
- 15.5.6. Display Configuration
- 15.5.7. Mounting Type
- 15.5.8. Durability Rating
- 15.5.9. End-Use X Applications
- 15.6. Mexico Military Displays Market
- 15.6.1. Country Segmental Analysis
- 15.6.2. Display Type
- 15.6.3. Display Size
- 15.6.4. Display Technology
- 15.6.5. Brightness Level
- 15.6.6. Display Configuration
- 15.6.7. Mounting Type
- 15.6.8. Durability Rating
- 15.6.9. End-Use X Applications
- 16. Europe Military Displays Market Analysis
- 16.1. Key Segment Analysis
- 16.2. Regional Snapshot
- 16.3. Europe Military Displays Market Size (Volume - Million Units and Value - US$ Bn), Analysis, and Forecasts, 2021-2035
- 16.3.1. Display Type
- 16.3.2. Display Size
- 16.3.3. Display Technology
- 16.3.4. Brightness Level
- 16.3.5. Display Configuration
- 16.3.6. Mounting Type
- 16.3.7. Durability Rating
- 16.3.8. End-Use X Applications
- 16.3.9. Country
- 16.3.9.1. Germany
- 16.3.9.2. United Kingdom
- 16.3.9.3. France
- 16.3.9.4. Italy
- 16.3.9.5. Spain
- 16.3.9.6. Netherlands
- 16.3.9.7. Nordic Countries
- 16.3.9.8. Poland
- 16.3.9.9. Russia & CIS
- 16.3.9.10. Rest of Europe
- 16.4. Germany Military Displays Market
- 16.4.1. Country Segmental Analysis
- 16.4.2. Display Type
- 16.4.3. Display Size
- 16.4.4. Display Technology
- 16.4.5. Brightness Level
- 16.4.6. Display Configuration
- 16.4.7. Mounting Type
- 16.4.8. Durability Rating
- 16.4.9. End-Use X Applications
- 16.5. United Kingdom Military Displays Market
- 16.5.1. Country Segmental Analysis
- 16.5.2. Display Type
- 16.5.3. Display Size
- 16.5.4. Display Technology
- 16.5.5. Brightness Level
- 16.5.6. Display Configuration
- 16.5.7. Mounting Type
- 16.5.8. Durability Rating
- 16.5.9. End-Use X Applications
- 16.6. France Military Displays Market
- 16.6.1. Country Segmental Analysis
- 16.6.2. Display Type
- 16.6.3. Display Size
- 16.6.4. Display Technology
- 16.6.5. Brightness Level
- 16.6.6. Display Configuration
- 16.6.7. Mounting Type
- 16.6.8. Durability Rating
- 16.6.9. End-Use X Applications
- 16.7. Italy Military Displays Market
- 16.7.1. Country Segmental Analysis
- 16.7.2. Display Type
- 16.7.3. Display Size
- 16.7.4. Display Technology
- 16.7.5. Brightness Level
- 16.7.6. Display Configuration
- 16.7.7. Mounting Type
- 16.7.8. Durability Rating
- 16.7.9. End-Use X Applications
- 16.8. Spain Military Displays Market
- 16.8.1. Country Segmental Analysis
- 16.8.2. Display Type
- 16.8.3. Display Size
- 16.8.4. Display Technology
- 16.8.5. Brightness Level
- 16.8.6. Display Configuration
- 16.8.7. Mounting Type
- 16.8.8. Durability Rating
- 16.8.9. End-Use X Applications
- 16.9. Netherlands Military Displays Market
- 16.9.1. Country Segmental Analysis
- 16.9.2. Display Type
- 16.9.3. Display Size
- 16.9.4. Display Technology
- 16.9.5. Brightness Level
- 16.9.6. Display Configuration
- 16.9.7. Mounting Type
- 16.9.8. Durability Rating
- 16.9.9. End-Use X Applications
- 16.10. Nordic Countries Military Displays Market
- 16.10.1. Country Segmental Analysis
- 16.10.2. Display Type
- 16.10.3. Display Size
- 16.10.4. Display Technology
- 16.10.5. Brightness Level
- 16.10.6. Display Configuration
- 16.10.7. Mounting Type
- 16.10.8. Durability Rating
- 16.10.9. End-Use X Applications
- 16.11. Poland Military Displays Market
- 16.11.1. Country Segmental Analysis
- 16.11.2. Display Type
- 16.11.3. Display Size
- 16.11.4. Display Technology
- 16.11.5. Brightness Level
- 16.11.6. Display Configuration
- 16.11.7. Mounting Type
- 16.11.8. Durability Rating
- 16.11.9. End-Use X Applications
- 16.12. Russia & CIS Military Displays Market
- 16.12.1. Country Segmental Analysis
- 16.12.2. Display Type
- 16.12.3. Display Size
- 16.12.4. Display Technology
- 16.12.5. Brightness Level
- 16.12.6. Display Configuration
- 16.12.7. Mounting Type
- 16.12.8. Durability Rating
- 16.12.9. End-Use X Applications
- 16.13. Rest of Europe Military Displays Market
- 16.13.1. Country Segmental Analysis
- 16.13.2. Display Type
- 16.13.3. Display Size
- 16.13.4. Display Technology
- 16.13.5. Brightness Level
- 16.13.6. Display Configuration
- 16.13.7. Mounting Type
- 16.13.8. Durability Rating
- 16.13.9. End-Use X Applications
- 17. Asia Pacific Military Displays Market Analysis
- 17.1. Key Segment Analysis
- 17.2. Regional Snapshot
- 17.3. Asia Pacific Military Displays Market Size (Volume - Million Units and Value - US$ Bn), Analysis, and Forecasts, 2021-2035
- 17.3.1. Display Type
- 17.3.2. Display Size
- 17.3.3. Display Technology
- 17.3.4. Brightness Level
- 17.3.5. Display Configuration
- 17.3.6. Mounting Type
- 17.3.7. Durability Rating
- 17.3.8. End-Use X Applications
- 17.3.9. Country
- 17.3.9.1. China
- 17.3.9.2. India
- 17.3.9.3. Japan
- 17.3.9.4. South Korea
- 17.3.9.5. Australia and New Zealand
- 17.3.9.6. Indonesia
- 17.3.9.7. Malaysia
- 17.3.9.8. Thailand
- 17.3.9.9. Vietnam
- 17.3.9.10. Rest of Asia Pacific
- 17.4. China Military Displays Market
- 17.4.1. Country Segmental Analysis
- 17.4.2. Display Type
- 17.4.3. Display Size
- 17.4.4. Display Technology
- 17.4.5. Brightness Level
- 17.4.6. Display Configuration
- 17.4.7. Mounting Type
- 17.4.8. Durability Rating
- 17.4.9. End-Use X Applications
- 17.5. India Military Displays Market
- 17.5.1. Country Segmental Analysis
- 17.5.2. Display Type
- 17.5.3. Display Size
- 17.5.4. Display Technology
- 17.5.5. Brightness Level
- 17.5.6. Display Configuration
- 17.5.7. Mounting Type
- 17.5.8. Durability Rating
- 17.5.9. End-Use X Applications
- 17.6. Japan Military Displays Market
- 17.6.1. Country Segmental Analysis
- 17.6.2. Display Type
- 17.6.3. Display Size
- 17.6.4. Display Technology
- 17.6.5. Brightness Level
- 17.6.6. Display Configuration
- 17.6.7. Mounting Type
- 17.6.8. Durability Rating
- 17.6.9. End-Use X Applications
- 17.7. South Korea Military Displays Market
- 17.7.1. Country Segmental Analysis
- 17.7.2. Display Type
- 17.7.3. Display Size
- 17.7.4. Display Technology
- 17.7.5. Brightness Level
- 17.7.6. Display Configuration
- 17.7.7. Mounting Type
- 17.7.8. Durability Rating
- 17.7.9. End-Use X Applications
- 17.8. Australia and New Zealand Military Displays Market
- 17.8.1. Country Segmental Analysis
- 17.8.2. Display Type
- 17.8.3. Display Size
- 17.8.4. Display Technology
- 17.8.5. Brightness Level
- 17.8.6. Display Configuration
- 17.8.7. Mounting Type
- 17.8.8. Durability Rating
- 17.8.9. End-Use X Applications
- 17.9. Indonesia Military Displays Market
- 17.9.1. Country Segmental Analysis
- 17.9.2. Display Type
- 17.9.3. Display Size
- 17.9.4. Display Technology
- 17.9.5. Brightness Level
- 17.9.6. Display Configuration
- 17.9.7. Mounting Type
- 17.9.8. Durability Rating
- 17.9.9. End-Use X Applications
- 17.10. Malaysia Military Displays Market
- 17.10.1. Country Segmental Analysis
- 17.10.2. Display Type
- 17.10.3. Display Size
- 17.10.4. Display Technology
- 17.10.5. Brightness Level
- 17.10.6. Display Configuration
- 17.10.7. Mounting Type
- 17.10.8. Durability Rating
- 17.10.9. End-Use X Applications
- 17.11. Thailand Military Displays Market
- 17.11.1. Country Segmental Analysis
- 17.11.2. Display Type
- 17.11.3. Display Size
- 17.11.4. Display Technology
- 17.11.5. Brightness Level
- 17.11.6. Display Configuration
- 17.11.7. Mounting Type
- 17.11.8. Durability Rating
- 17.11.9. End-Use X Applications
- 17.12. Vietnam Military Displays Market
- 17.12.1. Country Segmental Analysis
- 17.12.2. Display Type
- 17.12.3. Display Size
- 17.12.4. Display Technology
- 17.12.5. Brightness Level
- 17.12.6. Display Configuration
- 17.12.7. Mounting Type
- 17.12.8. Durability Rating
- 17.12.9. End-Use X Applications
- 17.13. Rest of Asia Pacific Military Displays Market
- 17.13.1. Country Segmental Analysis
- 17.13.2. Display Type
- 17.13.3. Display Size
- 17.13.4. Display Technology
- 17.13.5. Brightness Level
- 17.13.6. Display Configuration
- 17.13.7. Mounting Type
- 17.13.8. Durability Rating
- 17.13.9. End-Use X Applications
- 18. Middle East Military Displays Market Analysis
- 18.1. Key Segment Analysis
- 18.2. Regional Snapshot
- 18.3. Middle East Military Displays Market Size (Volume - Million Units and Value - US$ Bn), Analysis, and Forecasts, 2021-2035
- 18.3.1. Display Type
- 18.3.2. Display Size
- 18.3.3. Display Technology
- 18.3.4. Brightness Level
- 18.3.5. Display Configuration
- 18.3.6. Mounting Type
- 18.3.7. Durability Rating
- 18.3.8. End-Use X Applications
- 18.3.9. Country
- 18.3.9.1. Turkey
- 18.3.9.2. UAE
- 18.3.9.3. Saudi Arabia
- 18.3.9.4. Israel
- 18.3.9.5. Rest of Middle East
- 18.4. Turkey Military Displays Market
- 18.4.1. Country Segmental Analysis
- 18.4.2. Display Type
- 18.4.3. Display Size
- 18.4.4. Display Technology
- 18.4.5. Brightness Level
- 18.4.6. Display Configuration
- 18.4.7. Mounting Type
- 18.4.8. Durability Rating
- 18.4.9. End-Use X Applications
- 18.5. UAE Military Displays Market
- 18.5.1. Country Segmental Analysis
- 18.5.2. Display Type
- 18.5.3. Display Size
- 18.5.4. Display Technology
- 18.5.5. Brightness Level
- 18.5.6. Display Configuration
- 18.5.7. Mounting Type
- 18.5.8. Durability Rating
- 18.5.9. End-Use X Applications
- 18.6. Saudi Arabia Military Displays Market
- 18.6.1. Country Segmental Analysis
- 18.6.2. Display Type
- 18.6.3. Display Size
- 18.6.4. Display Technology
- 18.6.5. Brightness Level
- 18.6.6. Display Configuration
- 18.6.7. Mounting Type
- 18.6.8. Durability Rating
- 18.6.9. End-Use X Applications
- 18.7. Israel Military Displays Market
- 18.7.1. Country Segmental Analysis
- 18.7.2. Display Type
- 18.7.3. Display Size
- 18.7.4. Display Technology
- 18.7.5. Brightness Level
- 18.7.6. Display Configuration
- 18.7.7. Mounting Type
- 18.7.8. Durability Rating
- 18.7.9. End-Use X Applications
- 18.8. Rest of Middle East Military Displays Market
- 18.8.1. Country Segmental Analysis
- 18.8.2. Display Type
- 18.8.3. Display Size
- 18.8.4. Display Technology
- 18.8.5. Brightness Level
- 18.8.6. Display Configuration
- 18.8.7. Mounting Type
- 18.8.8. Durability Rating
- 18.8.9. End-Use X Applications
- 19. Africa Military Displays Market Analysis
- 19.1. Key Segment Analysis
- 19.2. Regional Snapshot
- 19.3. Africa Military Displays Market Size (Volume - Million Units and Value - US$ Bn), Analysis, and Forecasts, 2021-2035
- 19.3.1. Display Type
- 19.3.2. Display Size
- 19.3.3. Display Technology
- 19.3.4. Brightness Level
- 19.3.5. Display Configuration
- 19.3.6. Mounting Type
- 19.3.7. Durability Rating
- 19.3.8. End-Use X Applications
- 19.3.9. Country
- 19.3.9.1. South Africa
- 19.3.9.2. Egypt
- 19.3.9.3. Nigeria
- 19.3.9.4. Algeria
- 19.3.9.5. Rest of Africa
- 19.4. South Africa Military Displays Market
- 19.4.1. Country Segmental Analysis
- 19.4.2. Display Type
- 19.4.3. Display Size
- 19.4.4. Display Technology
- 19.4.5. Brightness Level
- 19.4.6. Display Configuration
- 19.4.7. Mounting Type
- 19.4.8. Durability Rating
- 19.4.9. End-Use X Applications
- 19.5. Egypt Military Displays Market
- 19.5.1. Country Segmental Analysis
- 19.5.2. Display Type
- 19.5.3. Display Size
- 19.5.4. Display Technology
- 19.5.5. Brightness Level
- 19.5.6. Display Configuration
- 19.5.7. Mounting Type
- 19.5.8. Durability Rating
- 19.5.9. End-Use X Applications
- 19.6. Nigeria Military Displays Market
- 19.6.1. Country Segmental Analysis
- 19.6.2. Display Type
- 19.6.3. Display Size
- 19.6.4. Display Technology
- 19.6.5. Brightness Level
- 19.6.6. Display Configuration
- 19.6.7. Mounting Type
- 19.6.8. Durability Rating
- 19.6.9. End-Use X Applications
- 19.7. Algeria Military Displays Market
- 19.7.1. Country Segmental Analysis
- 19.7.2. Display Type
- 19.7.3. Display Size
- 19.7.4. Display Technology
- 19.7.5. Brightness Level
- 19.7.6. Display Configuration
- 19.7.7. Mounting Type
- 19.7.8. Durability Rating
- 19.7.9. End-Use X Applications
- 19.8. Rest of Africa Military Displays Market
- 19.8.1. Country Segmental Analysis
- 19.8.2. Display Type
- 19.8.3. Display Size
- 19.8.4. Display Technology
- 19.8.5. Brightness Level
- 19.8.6. Display Configuration
- 19.8.7. Mounting Type
- 19.8.8. Durability Rating
- 19.8.9. End-Use X Applications
- 20. South America Military Displays Market Analysis
- 20.1. Key Segment Analysis
- 20.2. Regional Snapshot
- 20.3. South America Military Displays Market Size (Volume - Million Units and Value - US$ Bn), Analysis, and Forecasts, 2021-2035
- 20.3.1. Display Type
- 20.3.2. Display Size
- 20.3.3. Display Technology
- 20.3.4. Brightness Level
- 20.3.5. Display Configuration
- 20.3.6. Mounting Type
- 20.3.7. Durability Rating
- 20.3.8. End-Use X Applications
- 20.3.9. Country
- 20.3.9.1. Brazil
- 20.3.9.2. Argentina
- 20.3.9.3. Rest of South America
- 20.4. Brazil Military Displays Market
- 20.4.1. Country Segmental Analysis
- 20.4.2. Display Type
- 20.4.3. Display Size
- 20.4.4. Display Technology
- 20.4.5. Brightness Level
- 20.4.6. Display Configuration
- 20.4.7. Mounting Type
- 20.4.8. Durability Rating
- 20.4.9. End-Use X Applications
- 20.5. Argentina Military Displays Market
- 20.5.1. Country Segmental Analysis
- 20.5.2. Display Type
- 20.5.3. Display Size
- 20.5.4. Display Technology
- 20.5.5. Brightness Level
- 20.5.6. Display Configuration
- 20.5.7. Mounting Type
- 20.5.8. Durability Rating
- 20.5.9. End-Use X Applications
- 20.6. Rest of South America Military Displays Market
- 20.6.1. Country Segmental Analysis
- 20.6.2. Display Type
- 20.6.3. Display Size
- 20.6.4. Display Technology
- 20.6.5. Brightness Level
- 20.6.6. Display Configuration
- 20.6.7. Mounting Type
- 20.6.8. Durability Rating
- 20.6.9. End-Use X Applications
- 21. Key Players/ Company Profile
- 21.1. Advanced Displays & Systems
- 21.1.1. Company Details/ Overview
- 21.1.2. Company Financials
- 21.1.3. Key Customers and Competitors
- 21.1.4. Business/ Industry Portfolio
- 21.1.5. Product Portfolio/ Specification Details
- 21.1.6. Pricing Data
- 21.1.7. Strategic Overview
- 21.1.8. Recent Developments
- 21.2. Alphatron Marine
- 21.3. Astronics Corporation
- 21.4. Aydin Displays
- 21.5. BAE Systems
- 21.6. Collins Aerospace (RTX Corporation)
- 21.7. CP Technologies BAE Systems
- 21.8. Crystal Group Inc.
- 21.9. Curtiss-Wright Corporation
- 21.10. Elbit Systems
- 21.11. Esterline Technologies (TransDigm Group)
- 21.12. General Dynamics Corporation
- 21.13. General Dynamics Mission Systems
- 21.14. Honeywell International Inc.
- 21.15. Kontron AG
- 21.16. L3Harris Technologies
- 21.17. Leonardo S.p.A.
- 21.18. LG Display
- 21.19. Lockheed Martin Corporation
- 21.20. Neuro Logic Systems
- 21.21. Northrop Grumman Corporation
- 21.22. Saab AB
- 21.23. Samsung Electronics
- 21.24. Thales Group
- 21.25. Vartech Systems
- 21.26. Winmate Inc.
- 21.27. Other Key Players
- 21.1. Advanced Displays & Systems
Note* - This is just tentative list of players. While providing the report, we will cover more number of players based on their revenue and share for each geography
Research Design
Our research design integrates both demand-side and supply-side analysis through a balanced combination of primary and secondary research methodologies. By utilizing both bottom-up and top-down approaches alongside rigorous data triangulation methods, we deliver robust market intelligence that supports strategic decision-making.
MarketGenics' comprehensive research design framework ensures the delivery of accurate, reliable, and actionable market intelligence. Through the integration of multiple research approaches, rigorous validation processes, and expert analysis, we provide our clients with the insights needed to make informed strategic decisions and capitalize on market opportunities.

MarketGenics leverages a dedicated industry panel of experts and a comprehensive suite of paid databases to effectively collect, consolidate, and analyze market intelligence.
Our approach has consistently proven to be reliable and effective in generating accurate market insights, identifying key industry trends, and uncovering emerging business opportunities.
Through both primary and secondary research, we capture and analyze critical company-level data such as manufacturing footprints, including technical centers, R&D facilities, sales offices, and headquarters.
Our expert panel further enhances our ability to estimate market size for specific brands based on validated field-level intelligence.
Our data mining techniques incorporate both parametric and non-parametric methods, allowing for structured data collection, sorting, processing, and cleaning.
Demand projections are derived from large-scale data sets analyzed through proprietary algorithms, culminating in robust and reliable market sizing.
Research Approach
The bottom-up approach builds market estimates by starting with the smallest addressable market units and systematically aggregating them to create comprehensive market size projections.
This method begins with specific, granular data points and builds upward to create the complete market landscape.
Customer Analysis → Segmental Analysis → Geographical Analysis
The top-down approach starts with the broadest possible market data and systematically narrows it down through a series of filters and assumptions to arrive at specific market segments or opportunities.
This method begins with the big picture and works downward to increasingly specific market slices.
TAM → SAM → SOM


Research Methods
Desk / Secondary Research
While analysing the market, we extensively study secondary sources, directories, and databases to identify and collect information useful for this technical, market-oriented, and commercial report. Secondary sources that we utilize are not only the public sources, but it is a combination of Open Source, Associations, Paid Databases, MG Repository & Knowledgebase, and others.
- Company websites, annual reports, financial reports, broker reports, and investor presentations
- National government documents, statistical databases and reports
- News articles, press releases and web-casts specific to the companies operating in the market, Magazines, reports, and others
- We gather information from commercial data sources for deriving company specific data such as segmental revenue, share for geography, product revenue, and others
- Internal and external proprietary databases (industry-specific), relevant patent, and regulatory databases
- Governing Bodies, Government Organizations
- Relevant Authorities, Country-specific Associations for Industries
We also employ the model mapping approach to estimate the product level market data through the players' product portfolio
Primary Research
Primary research/ interviews is vital in analyzing the market. Most of the cases involves paid primary interviews. Primary sources include primary interviews through e-mail interactions, telephonic interviews, surveys as well as face-to-face interviews with the different stakeholders across the value chain including several industry experts.
| Type of Respondents | Number of Primaries |
|---|---|
| Tier 2/3 Suppliers | ~20 |
| Tier 1 Suppliers | ~25 |
| End-users | ~25 |
| Industry Expert/ Panel/ Consultant | ~30 |
| Total | ~100 |
MG Knowledgebase
• Repository of industry blog, newsletter and case studies
• Online platform covering detailed market reports, and company profiles
Forecasting Factors and Models
Forecasting Factors
- Historical Trends – Past market patterns, cycles, and major events that shaped how markets behave over time. Understanding past trends helps predict future behavior.
- Industry Factors – Specific characteristics of the industry like structure, regulations, and innovation cycles that affect market dynamics.
- Macroeconomic Factors – Economic conditions like GDP growth, inflation, and employment rates that affect how much money people have to spend.
- Demographic Factors – Population characteristics like age, income, and location that determine who can buy your product.
- Technology Factors – How quickly people adopt new technology and how much technology infrastructure exists.
- Regulatory Factors – Government rules, laws, and policies that can help or restrict market growth.
- Competitive Factors – Analyzing competition structure such as degree of competition and bargaining power of buyers and suppliers.
Forecasting Models / Techniques
Multiple Regression Analysis
- Identify and quantify factors that drive market changes
- Statistical modeling to establish relationships between market drivers and outcomes
Time Series Analysis – Seasonal Patterns
- Understand regular cyclical patterns in market demand
- Advanced statistical techniques to separate trend, seasonal, and irregular components
Time Series Analysis – Trend Analysis
- Identify underlying market growth patterns and momentum
- Statistical analysis of historical data to project future trends
Expert Opinion – Expert Interviews
- Gather deep industry insights and contextual understanding
- In-depth interviews with key industry stakeholders
Multi-Scenario Development
- Prepare for uncertainty by modeling different possible futures
- Creating optimistic, pessimistic, and most likely scenarios
Time Series Analysis – Moving Averages
- Sophisticated forecasting for complex time series data
- Auto-regressive integrated moving average models with seasonal components
Econometric Models
- Apply economic theory to market forecasting
- Sophisticated economic models that account for market interactions
Expert Opinion – Delphi Method
- Harness collective wisdom of industry experts
- Structured, multi-round expert consultation process
Monte Carlo Simulation
- Quantify uncertainty and probability distributions
- Thousands of simulations with varying input parameters
Research Analysis
Our research framework is built upon the fundamental principle of validating market intelligence from both demand and supply perspectives. This dual-sided approach ensures comprehensive market understanding and reduces the risk of single-source bias.
Demand-Side Analysis: We understand end-user/application behavior, preferences, and market needs along with the penetration of the product for specific application.
Supply-Side Analysis: We estimate overall market revenue, analyze the segmental share along with industry capacity, competitive landscape, and market structure.
Validation & Evaluation
Data triangulation is a validation technique that uses multiple methods, sources, or perspectives to examine the same research question, thereby increasing the credibility and reliability of research findings. In market research, triangulation serves as a quality assurance mechanism that helps identify and minimize bias, validate assumptions, and ensure accuracy in market estimates.
- Data Source Triangulation – Using multiple data sources to examine the same phenomenon
- Methodological Triangulation – Using multiple research methods to study the same research question
- Investigator Triangulation – Using multiple researchers or analysts to examine the same data
- Theoretical Triangulation – Using multiple theoretical perspectives to interpret the same data

Custom Market Research Services
We will customise the research for you, in case the report listed above does not meet your requirements.
Get 10% Free Customisation