Nanomaterials Market Size, Share & Trends Analysis Report by Type (Carbon-based Nanomaterials, Metal & Metal Oxide Nanomaterials, Ceramic Nanomaterials, Polymeric Nanomaterials, Lipid-based Nanomaterials, Dendrimers, Quantum Dots, Others), Dimensionality, Form, Particle Size, Purity Level, Application, and Geography (North America, Europe, Asia Pacific, Middle East, Africa, and South America) – Global Industry Data, Trends, and Forecasts, 2026–2035
Market Overview:
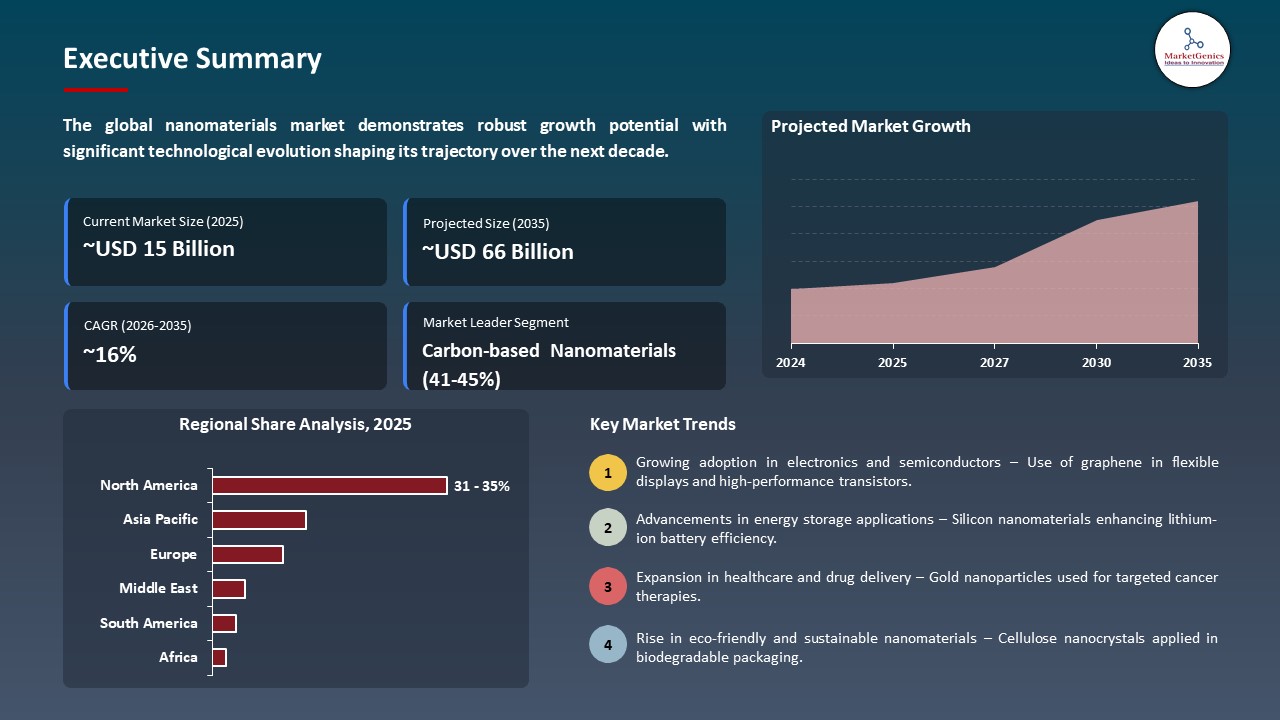
According to MarketGenics analysis, the global Nanomaterials Market is witnessing strong and sustained growth and is projected to expand from approximately USD 14.5 billion in 2025 to nearly USD 65.6 billion by 2035, registering a robust CAGR of 16.3% during the forecast period
|
|
|
Segmental Data Insights |
|
|
Demand Trends |
|
|
Competitive Landscape |
|
|
Strategic Development |
|
|
Future Outlook & Opportunities |
|
Nanomaterials market Size, Share, and Growth
The development of material engineering, nanoscale fabrication and real-time performance analysis are driving the global nanomaterials market as industries continually aim at optimising electrical conductivity, mechanical strength and thermal stability among applications in electronics, energy storage, and advanced manufacturing.
William R. Florman, Co-Founder and President of International Industrial Partners, expressed his enthusiasm for the collaboration, stating, We are very excited to partner with Nissan Chemical America to supply nanoActiv technology, which we believe will transform Enhanced Oil Recovery in the region.
The global nanomaterials market are vibrant due to the high-performance, miniaturization, and sustainability requirements installed by industries in electronic, energy storage, health, and advanced manufacturing. Innovations in nanomaterials including graphene based conductive inks, carbon nanotube composite as well as metal oxide nanoparticles are facilitating the realization of consistent performance enhancement in semiconductors, batteries and precision coating.
AI-based nanomaterial design platforms and automated synthesis laboratories are enhancing innovation by predicting materials, optimizing formulations and reducing trial and error in R&D, real-time predictive analytics and simulation based testing is increasing efficiency in R&D and reducing the cost of development in industries.
Adjacent opportunities in sustainable manufacturing processes, hybrid nanomaterials and functionalized surface engineering are improving market appeal. Movement to the next generation nanomaterials are moving beyond materials to complete systems in next-generation applications, energy systems and medical systems, high performance, operational efficiency, and long-term sustainability, making the global nanomaterials market a key enabler of technological innovation across the globe.
 Nanomaterials market Dynamics and Trends
Driver: Growing Demand in Electronics and Energy Storage
-
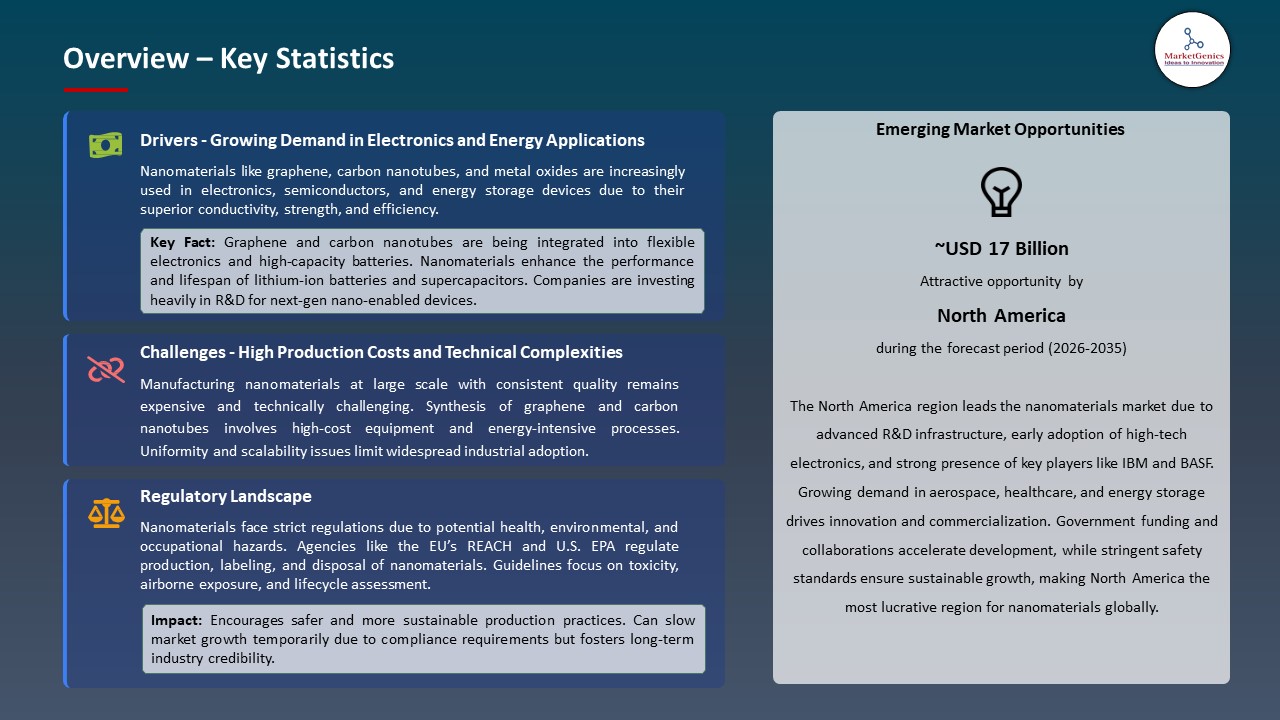
The global nanomaterials market is driven by the growing demand of consumer electronics, IoT systems, and miniaturized semiconductors, with such materials as carbon nanotubes, graphene, and metal oxide nanoparticles leading to improved conductivity, durability, and power efficiency.
- The increasing usage of nanomaterials in next-generation energy storage systems such as battery electrodes, supercapacitors, and conductive composites is growing market demand; for instance, in July, Nanovace Technologies patented proprietary nanomaterials in next-generation lithium-ion battery anodes and is building a pilot plant in Gujarat to scale-up production to serve commercial energy storage uses.
- The increasing amount of nanomaterials in the development of advanced batteries and energy solutions all over the world is strengthening the market growth and integration of the technologies in the long run.
Restraint: High Production Costs and Scalability Issues
-
The initial capital cost of the production of industrial scale nanomaterials (such as advanced reactors and ultra-clean processing conditions) remains a deterrent to its use, especially when considering small and mid-sized manufacturers.
- Present-day operational costs, including the quality control laboratories, energy-intensive synthesis, surface functionalization apparatus, and wages of the highly trained working staff, continue to increase the initial financial overhead costs of the nanomaterials operators.
- The lack of access to specialized manufacturing facilities, high-purity raw materials, and trained staff in the emerging economies remains to be a setback in the implementation of nanomaterials at large-scale all through the globe.
Opportunity: Integration in Sustainable and Advanced Materials
-
Nanomaterials and next-generation battery and energy technologies are converging to provide powerful global opportunities that allow increased energy density, rapidity in charge and extended lifecycle in clean energy storage and electrification solutions.
- Marketing sustainable solutions Commercialization of sustainable solutions is being facilitated by collaborations between nanomaterials innovators and energy technology companies. For instance, in May 2025, Zeon Corporation and Sino Applied Technology (SiAT) joined to increase the production of single-walled carbon nanotube (SWCNT) conductive paste, which enhances conductivity and cycle life on the lithium-ion battery in EVs and grid storage systems.
- SWCNT conductive pastes can allow cost-effective, scalable, and high-performance worldwide adoption of nanomaterials.
Key Trend: AI-Driven Design and Manufacturing of Nanomaterials
-
The integration of predictive modeling and automated synthesis platforms through AI is driving the global nanomaterials market at an accelerated pace since it allows the rapid discovery of high-performance nanomaterials with specific properties to serve the electronic, energy storage, and biomedical sectors.
- AI analytics in real-time, cloud-based simulation platforms, autonomous robotic labs are being increasingly used to design materials more efficiently, predict stability, and scale-up; for instance, in January 2024 partnership between Chemical.AI and Nanyang Technological University (NTU Singapore) to opening an AI-driven nanomaterials laboratory to discover the most effective nanoparticle formulations, shortening the time spent in R&D and experimentation.
- Nanomaterials production in industries is efficient, scaled and sustainable with AI-integrated platforms.
Nanomaterials Market Analysis and Segmental Data
Carbon-based Nanomaterials Dominate Global Nanomaterials Market
-
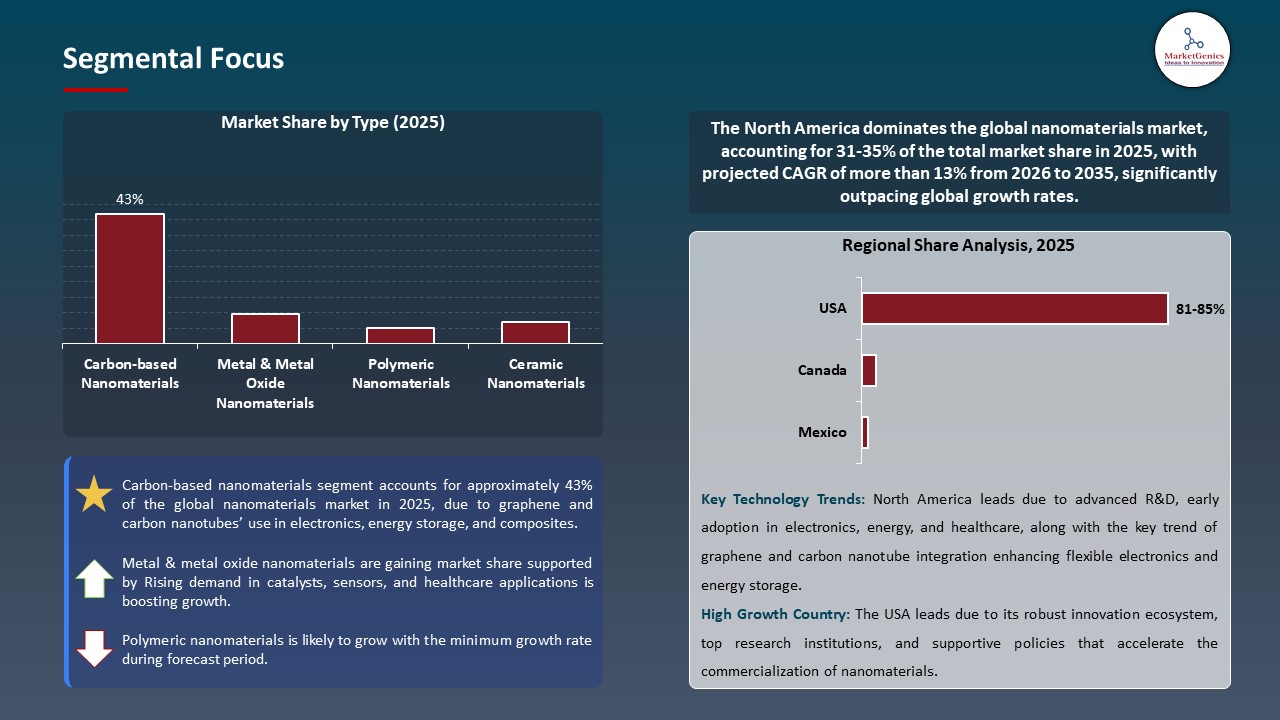
Carbon-based nanomaterials such as carbon nanotube, graphene and nanodiamond forms are the leading nanomaterials market with its huge superior electrical conductivity, mechanical strength and thermal stability relative to the traditional materials.
- High-purity carbon nanotubes, graphene nanoplatelets, and hybrid carbon nanocomposites are being embraced quickly and are allowing lighter, stronger, and energy-efficient components in energy storage, electronics, as well as industries.
- The use of nanomaterials in energy storage, electronics, and industrial applications has only strengthened the dominance of carbon-based nanomaterials in the global nanomaterials market segment.
North America Leads Global Nanomaterials Market Demand
-
North America leads the nanomaterials market because of good nanotechnology research clusters, substantial industrial performance of nano-enhanced materials in semiconductors, aerospace, healthcare, and energy and powerful government programs that enhance large scale commercialization and localization of the supply chain.
- Nanomaterials are quickly finding use in high tech electronics, energy storage, medicine and in aerospace, for instance, in July 2025, the University at Albany, the Center for Advanced Technology in Nanomaterials and Nanoelectronics (CATN2) was awarded a $10million state grant to enhance research and industry partnership in accelerating the commercialization of nanomaterials-based technologies in North America.
- Federal R&D, Industry and scale-up initiatives also further support the leadership position of North America in the global nanomaterials market.
Nanomaterials Market Ecosystem
The nanomaterials market is moderately consolidated with the competition centered on high-performance nanoparticles, carbon-based nanomaterials, advanced coatings, functional nanocomposites and specialty electronic materials. Their integrated nanomaterials ecosystems comprising of advanced material formulations, surface functionalization technologies, nanocomposites, and application-specific production capabilities are what makes the market share strong because of the presence of BASF SE, 3M Company, DuPont de Nemours, Inc., Evonik Industries AG, and Cabot Corporation.
BASF SE targets high-performance nano clay, silica and carbon nanotube dispersions in the automotive, coatings and electronics industries. 3M Company is developing nanomaterials and nanoscale films and adhesives in industrial and consumer electronics. Nanoparticle-enabled polymers, protective coating, and semiconductor materials are the focus of DuPont de Nemours, Inc. Evonik Industries AG is a producer of surface modified nanoparticles and silica in surface modification in the aspects of coatings, healthcare and electronics. Cabot Corporation is a supplier of carbon black, fumed silica, and specialty nanocarbon products used in energy storage, composite and electronics.
The rapid progress in nanoscale functionalization, high-performance dispersions, and application-specific nanocomposites is increasing their usage in electronics, energy, automotive and medical industries with collaboration with industrial partners, research institutes and technology startups enhancing competition differentiation and facilitating large-scale use and innovation in the global nanomaterials market.
 Recent Development and Strategic Overview
-
In October 2025, International Industrial Partners (IIP) and Nissan Chemical America declared to collaborate in the sale and distribution of nanoActiv, the first brine-resistant nanoparticle technology in the world Enhanced Oil Recovery (EOR) in the Middle East and North Africa (MENA), a step that is likely to increase efficiency in the energy industry of the region and enhance sustainability.
- In September 2025, Hong Kong Polytechnic University (PolyU) and the University of Waterloo (Canada) formally established the Research Centre on Nanoscience and Nanotechnology (RCNN) a strategic alliance to promote interdisciplinary nano research and innovation in clean energy, environmental technologies, functional devices, and biomedical applications and consolidate knowledge in nanotechnology in both countries, acting as a global collaborator in nanotechnology.
Report Scope
|
Detail |
|
|
Market Size in 2025 |
USD 14.5 Bn |
|
Market Forecast Value in 2035 |
USD 65.6 Bn |
|
Growth Rate (CAGR) |
16.3% |
|
Forecast Period |
2026 – 2035 |
|
Historical Data Available for |
2021 – 2024 |
|
Market Size Units |
US$ Billion for Value Tons for Volume |
|
Report Format |
Electronic (PDF) + Excel |
|
North America |
Europe |
Asia Pacific |
Middle East |
Africa |
South America |
|
|
|
|
|
|
|
Companies Covered |
|||||
|
|
|
|
|
|
Nanomaterials Market Segmentation and Highlights
|
Segment |
Sub-segment |
|
Nanomaterials Market, By Type |
|
|
Nanomaterials Market, By Dimensionality |
|
|
Nanomaterials Market, By Form |
|
|
Nanomaterials Market, By Particle Size |
|
|
Nanomaterials Market, By Purity Level |
|
|
Nanomaterials Market, By Application |
|
Frequently Asked Questions
Table of Contents
- 1. Research Methodology and Assumptions
- 1.1. Definitions
- 1.2. Research Design and Approach
- 1.3. Data Collection Methods
- 1.4. Base Estimates and Calculations
- 1.5. Forecasting Models
- 1.5.1. Key Forecast Factors & Impact Analysis
- 1.6. Secondary Research
- 1.6.1. Open Sources
- 1.6.2. Paid Databases
- 1.6.3. Associations
- 1.7. Primary Research
- 1.7.1. Primary Sources
- 1.7.2. Primary Interviews with Stakeholders across Ecosystem
- 2. Executive Summary
- 2.1. Global Nanomaterials Market Outlook
- 2.1.1. Nanomaterials Market Size (Volume - Tons & Value - US$ Bn), and Forecasts, 2021-2035
- 2.1.2. Compounded Annual Growth Rate Analysis
- 2.1.3. Growth Opportunity Analysis
- 2.1.4. Segmental Share Analysis
- 2.1.5. Geographical Share Analysis
- 2.2. Market Analysis and Facts
- 2.3. Supply-Demand Analysis
- 2.4. Competitive Benchmarking
- 2.5. Go-to- Market Strategy
- 2.5.1. Customer/ End-use Industry Assessment
- 2.5.2. Growth Opportunity Data, 2026-2035
- 2.5.2.1. Regional Data
- 2.5.2.2. Country Data
- 2.5.2.3. Segmental Data
- 2.5.3. Identification of Potential Market Spaces
- 2.5.4. GAP Analysis
- 2.5.5. Potential Attractive Price Points
- 2.5.6. Prevailing Market Risks & Challenges
- 2.5.7. Preferred Sales & Marketing Strategies
- 2.5.8. Key Recommendations and Analysis
- 2.5.9. A Way Forward
- 2.1. Global Nanomaterials Market Outlook
- 3. Industry Data and Premium Insights
- 3.1. Global Chemicals & Materials Industry Overview, 2025
- 3.1.1. Chemicals & Materials Industry Ecosystem Analysis
- 3.1.2. Key Trends for Chemicals & Materials Industry
- 3.1.3. Regional Distribution for Chemicals & Materials Industry
- 3.2. Supplier Customer Data
- 3.3. Technology Roadmap and Developments
- 3.4. Trade Analysis
- 3.4.1. Import & Export Analysis, 2025
- 3.4.2. Top Importing Countries
- 3.4.3. Top Exporting Countries
- 3.5. Trump Tariff Impact Analysis
- 3.5.1. Manufacturer
- 3.5.1.1. Based on the raw material
- 3.5.2. Supply Chain
- 3.5.3. End Consumer
- 3.5.1. Manufacturer
- 3.6. Raw Material Analysis
- 3.1. Global Chemicals & Materials Industry Overview, 2025
- 4. Market Overview
- 4.1. Market Dynamics
- 4.1.1. Drivers
- 4.1.1.1. Rapid advancements in nanotechnology and continuous innovation in material science expanding applications and performance capabilities.
- 4.1.1.2. Increasing demand from key end‑use industries such as electronics, healthcare, energy, automotive, and construction seeking high‑performance, lightweight, and efficient materials.
- 4.1.1.3. Growing focus on sustainability and energy‑efficient solutions driving adoption of nanomaterials in renewable energy technologies, environmental remediation, and eco‑friendly products.
- 4.1.2. Restraints
- 4.1.2.1. High production and manufacturing costs, including complex synthesis and scalability challenges, limiting commercial adoption.
- 4.1.2.2. Regulatory uncertainties, health, safety, and environmental concerns related to nanoparticle exposure and lack of standardized frameworks, hindering market expansion.
- 4.1.1. Drivers
- 4.2. Key Trend Analysis
- 4.3. Regulatory Framework
- 4.3.1. Key Regulations, Norms, and Subsidies, by Key Countries
- 4.3.2. Tariffs and Standards
- 4.3.3. Impact Analysis of Regulations on the Market
- 4.4. Value Chain Analysis
- 4.4.1. Raw Material Suppliers
- 4.4.2. Nanomaterial Manufacturers
- 4.4.3. Distributors
- 4.4.4. End-Users/ Customers
- 4.5. Porter’s Five Forces Analysis
- 4.6. PESTEL Analysis
- 4.7. Global Nanomaterials Market Demand
- 4.7.1. Historical Market Size – Volume (Tons) & Value (US$ Bn), 2020-2024
- 4.7.2. Current and Future Market Size – Volume (Tons) & Value (US$ Bn), 2026–2035
- 4.7.2.1. Y-o-Y Growth Trends
- 4.7.2.2. Absolute $ Opportunity Assessment
- 4.1. Market Dynamics
- 5. Competition Landscape
- 5.1. Competition structure
- 5.1.1. Fragmented v/s consolidated
- 5.2. Company Share Analysis, 2025
- 5.2.1. Global Company Market Share
- 5.2.2. By Region
- 5.2.2.1. North America
- 5.2.2.2. Europe
- 5.2.2.3. Asia Pacific
- 5.2.2.4. Middle East
- 5.2.2.5. Africa
- 5.2.2.6. South America
- 5.3. Product Comparison Matrix
- 5.3.1. Specifications
- 5.3.2. Market Positioning
- 5.3.3. Pricing
- 5.1. Competition structure
- 6. Global Nanomaterials Market Analysis, by Type
- 6.1. Key Segment Analysis
- 6.2. Nanomaterials Market Size (Volume - Tons & Value - US$ Bn), Analysis, and Forecasts, by Solution Type, 2021-2035
- 6.2.1. Carbon-based Nanomaterials
- 6.2.1.1. Carbon Nanotubes (CNTs)
- 6.2.1.1.1. Single-Walled Carbon Nanotubes (SWCNTs)
- 6.2.1.1.2. Multi-Walled Carbon Nanotubes (MWCNTs)
- 6.2.1.2. Graphene
- 6.2.1.3. Fullerenes
- 6.2.1.4. Carbon Nanofibers
- 6.2.1.5. Others
- 6.2.1.1. Carbon Nanotubes (CNTs)
- 6.2.2. Metal & Metal Oxide Nanomaterials
- 6.2.2.1. Gold Nanoparticles
- 6.2.2.2. Silver Nanoparticles
- 6.2.2.3. Iron Oxide Nanoparticles
- 6.2.2.4. Titanium Dioxide (TiO2)
- 6.2.2.5. Zinc Oxide (ZnO)
- 6.2.2.6. Copper Oxide (CuO)
- 6.2.2.7. Aluminum Oxide (Al2O3)
- 6.2.2.8. Others
- 6.2.3. Ceramic Nanomaterials
- 6.2.4. Polymeric Nanomaterials
- 6.2.5. Lipid-based Nanomaterials
- 6.2.6. Dendrimers
- 6.2.7. Quantum Dots
- 6.2.8. Others
- 6.2.1. Carbon-based Nanomaterials
- 7. Global Nanomaterials Market Analysis, by Dimensionality
- 7.1. Key Segment Analysis
- 7.2. Nanomaterials Market Size (Volume - Tons & Value - US$ Bn), Analysis, and Forecasts, by Dimensionality, 2021-2035
- 7.2.1. 0D Nanomaterials
- 7.2.2. 1D Nanomaterials
- 7.2.3. 2D Nanomaterials
- 7.2.4. 3D Nanomaterials
- 8. Global Nanomaterials Market Analysis, by Form
- 8.1. Key Segment Analysis
- 8.2. Nanomaterials Market Size (Volume - Tons & Value - US$ Bn), Analysis, and Forecasts, by Form, 2021-2035
- 8.2.1. Powder
- 8.2.2. Suspension/Dispersion
- 8.2.3. Solution
- 8.2.4. Film/Coating
- 8.2.5. Others
- 9. Global Nanomaterials Market Analysis, by Particle Size
- 9.1. Key Segment Analysis
- 9.2. Nanomaterials Market Size (Volume - Tons & Value - US$ Bn), Analysis, and Forecasts, by Particle Size, 2021-2035
- 9.2.1. 1-10 nm
- 9.2.2. 10-50 nm
- 9.2.3. 50-100 nm
- 9.2.4. Above 100 nm
- 10. Global Nanomaterials Market Analysis, by Purity Level
- 10.1. Key Segment Analysis
- 10.2. Nanomaterials Market Size (Volume - Tons & Value - US$ Bn), Analysis, and Forecasts, by Purity Level, 2021-2035
- 10.2.1. High Purity (>99%)
- 10.2.2. Standard Purity (95-99%)
- 10.2.3. Commercial Grade (<95%)
- 11. Global Nanomaterials Market Analysis, by Application
- 11.1. Key Segment Analysis
- 11.2. Nanomaterials Market Size (Volume - Tons & Value - US$ Bn), Analysis, and Forecasts, by Application, 2021-2035
- 11.2.1. Electronics & Semiconductors
- 11.2.2. Energy Storage & Conversion
- 11.2.3. Medical & Healthcare
- 11.2.4. Coatings & Paints
- 11.2.5. Composites & Materials
- 11.2.6. Environmental Remediation
- 11.2.7. Catalysis
- 11.2.8. Sensors & Diagnostics
- 11.2.9. Cosmetics & Personal Care
- 11.2.10. Food & Packaging
- 11.2.11. Textiles
- 11.2.12. Construction
- 11.2.13. Others
- 12. Global Nanomaterials Market Analysis and Forecasts, by Region
- 12.1. Key Findings
- 12.2. Nanomaterials Market Size (Volume - Tons & Value - US$ Bn), Analysis, and Forecasts, by Region, 2021-2035
- 12.2.1. North America
- 12.2.2. Europe
- 12.2.3. Asia Pacific
- 12.2.4. Middle East
- 12.2.5. Africa
- 12.2.6. South America
- 13. North America Nanomaterials Market Analysis
- 13.1. Key Segment Analysis
- 13.2. Regional Snapshot
- 13.3. North America Nanomaterials Market Size (Volume - Tons & Value - US$ Bn), Analysis, and Forecasts, 2021-2035
- 13.3.1. Type
- 13.3.2. Dimensionality
- 13.3.3. Form
- 13.3.4. Particle Size
- 13.3.5. Purity Level
- 13.3.6. Application
- 13.3.7. Country
- 13.3.7.1. USA
- 13.3.7.2. Canada
- 13.3.7.3. Mexico
- 13.4. USA Nanomaterials Market
- 13.4.1. Country Segmental Analysis
- 13.4.2. Type
- 13.4.3. Dimensionality
- 13.4.4. Form
- 13.4.5. Particle Size
- 13.4.6. Purity Level
- 13.4.7. Application
- 13.5. Canada Nanomaterials Market
- 13.5.1. Country Segmental Analysis
- 13.5.2. Type
- 13.5.3. Dimensionality
- 13.5.4. Form
- 13.5.5. Particle Size
- 13.5.6. Purity Level
- 13.5.7. Application
- 13.6. Mexico Nanomaterials Market
- 13.6.1. Country Segmental Analysis
- 13.6.2. Type
- 13.6.3. Dimensionality
- 13.6.4. Form
- 13.6.5. Particle Size
- 13.6.6. Purity Level
- 13.6.7. Application
- 14. Europe Nanomaterials Market Analysis
- 14.1. Key Segment Analysis
- 14.2. Regional Snapshot
- 14.3. Europe Nanomaterials Market Size (Volume - Tons & Value - US$ Bn), Analysis, and Forecasts, 2021-2035
- 14.3.1. Type
- 14.3.2. Dimensionality
- 14.3.3. Form
- 14.3.4. Particle Size
- 14.3.5. Purity Level
- 14.3.6. Application
- 14.3.7. Country
- 14.3.7.1. Germany
- 14.3.7.2. United Kingdom
- 14.3.7.3. France
- 14.3.7.4. Italy
- 14.3.7.5. Spain
- 14.3.7.6. Netherlands
- 14.3.7.7. Nordic Countries
- 14.3.7.8. Poland
- 14.3.7.9. Russia & CIS
- 14.3.7.10. Rest of Europe
- 14.4. Germany Nanomaterials Market
- 14.4.1. Country Segmental Analysis
- 14.4.2. Type
- 14.4.3. Dimensionality
- 14.4.4. Form
- 14.4.5. Particle Size
- 14.4.6. Purity Level
- 14.4.7. Application
- 14.5. United Kingdom Nanomaterials Market
- 14.5.1. Country Segmental Analysis
- 14.5.2. Type
- 14.5.3. Dimensionality
- 14.5.4. Form
- 14.5.5. Particle Size
- 14.5.6. Purity Level
- 14.5.7. Application
- 14.6. France Nanomaterials Market
- 14.6.1. Country Segmental Analysis
- 14.6.2. Type
- 14.6.3. Dimensionality
- 14.6.4. Form
- 14.6.5. Particle Size
- 14.6.6. Purity Level
- 14.6.7. Application
- 14.7. Italy Nanomaterials Market
- 14.7.1. Country Segmental Analysis
- 14.7.2. Type
- 14.7.3. Dimensionality
- 14.7.4. Form
- 14.7.5. Particle Size
- 14.7.6. Purity Level
- 14.7.7. Application
- 14.8. Spain Nanomaterials Market
- 14.8.1. Country Segmental Analysis
- 14.8.2. Type
- 14.8.3. Dimensionality
- 14.8.4. Form
- 14.8.5. Particle Size
- 14.8.6. Purity Level
- 14.8.7. Application
- 14.9. Netherlands Nanomaterials Market
- 14.9.1. Country Segmental Analysis
- 14.9.2. Type
- 14.9.3. Dimensionality
- 14.9.4. Form
- 14.9.5. Particle Size
- 14.9.6. Purity Level
- 14.9.7. Application
- 14.10. Nordic Countries Nanomaterials Market
- 14.10.1. Country Segmental Analysis
- 14.10.2. Type
- 14.10.3. Dimensionality
- 14.10.4. Form
- 14.10.5. Particle Size
- 14.10.6. Purity Level
- 14.10.7. Application
- 14.11. Poland Nanomaterials Market
- 14.11.1. Country Segmental Analysis
- 14.11.2. Type
- 14.11.3. Dimensionality
- 14.11.4. Form
- 14.11.5. Particle Size
- 14.11.6. Purity Level
- 14.11.7. Application
- 14.12. Russia & CIS Nanomaterials Market
- 14.12.1. Country Segmental Analysis
- 14.12.2. Type
- 14.12.3. Dimensionality
- 14.12.4. Form
- 14.12.5. Particle Size
- 14.12.6. Purity Level
- 14.12.7. Application
- 14.13. Rest of Europe Nanomaterials Market
- 14.13.1. Country Segmental Analysis
- 14.13.2. Type
- 14.13.3. Dimensionality
- 14.13.4. Form
- 14.13.5. Particle Size
- 14.13.6. Purity Level
- 14.13.7. Application
- 15. Asia Pacific Nanomaterials Market Analysis
- 15.1. Key Segment Analysis
- 15.2. Regional Snapshot
- 15.3. Asia Pacific Nanomaterials Market Size (Volume - Tons & Value - US$ Bn), Analysis, and Forecasts, 2021-2035
- 15.3.1. Type
- 15.3.2. Dimensionality
- 15.3.3. Form
- 15.3.4. Particle Size
- 15.3.5. Purity Level
- 15.3.6. Application
- 15.3.7. Country
- 15.3.7.1. China
- 15.3.7.2. India
- 15.3.7.3. Japan
- 15.3.7.4. South Korea
- 15.3.7.5. Australia and New Zealand
- 15.3.7.6. Indonesia
- 15.3.7.7. Malaysia
- 15.3.7.8. Thailand
- 15.3.7.9. Vietnam
- 15.3.7.10. Rest of Asia Pacific
- 15.4. China Nanomaterials Market
- 15.4.1. Country Segmental Analysis
- 15.4.2. Type
- 15.4.3. Dimensionality
- 15.4.4. Form
- 15.4.5. Particle Size
- 15.4.6. Purity Level
- 15.4.7. Application
- 15.5. India Nanomaterials Market
- 15.5.1. Country Segmental Analysis
- 15.5.2. Type
- 15.5.3. Dimensionality
- 15.5.4. Form
- 15.5.5. Particle Size
- 15.5.6. Purity Level
- 15.5.7. Application
- 15.6. Japan Nanomaterials Market
- 15.6.1. Country Segmental Analysis
- 15.6.2. Type
- 15.6.3. Dimensionality
- 15.6.4. Form
- 15.6.5. Particle Size
- 15.6.6. Purity Level
- 15.6.7. Application
- 15.7. South Korea Nanomaterials Market
- 15.7.1. Country Segmental Analysis
- 15.7.2. Type
- 15.7.3. Dimensionality
- 15.7.4. Form
- 15.7.5. Particle Size
- 15.7.6. Purity Level
- 15.7.7. Application
- 15.8. Australia and New Zealand Nanomaterials Market
- 15.8.1. Country Segmental Analysis
- 15.8.2. Type
- 15.8.3. Dimensionality
- 15.8.4. Form
- 15.8.5. Particle Size
- 15.8.6. Purity Level
- 15.8.7. Application
- 15.9. Indonesia Nanomaterials Market
- 15.9.1. Country Segmental Analysis
- 15.9.2. Type
- 15.9.3. Dimensionality
- 15.9.4. Form
- 15.9.5. Particle Size
- 15.9.6. Purity Level
- 15.9.7. Application
- 15.10. Malaysia Nanomaterials Market
- 15.10.1. Country Segmental Analysis
- 15.10.2. Type
- 15.10.3. Dimensionality
- 15.10.4. Form
- 15.10.5. Particle Size
- 15.10.6. Purity Level
- 15.10.7. Application
- 15.11. Thailand Nanomaterials Market
- 15.11.1. Country Segmental Analysis
- 15.11.2. Type
- 15.11.3. Dimensionality
- 15.11.4. Form
- 15.11.5. Particle Size
- 15.11.6. Purity Level
- 15.11.7. Application
- 15.12. Vietnam Nanomaterials Market
- 15.12.1. Country Segmental Analysis
- 15.12.2. Type
- 15.12.3. Dimensionality
- 15.12.4. Form
- 15.12.5. Particle Size
- 15.12.6. Purity Level
- 15.12.7. Application
- 15.13. Rest of Asia Pacific Nanomaterials Market
- 15.13.1. Country Segmental Analysis
- 15.13.2. Type
- 15.13.3. Dimensionality
- 15.13.4. Form
- 15.13.5. Particle Size
- 15.13.6. Purity Level
- 15.13.7. Application
- 16. Middle East Nanomaterials Market Analysis
- 16.1. Key Segment Analysis
- 16.2. Regional Snapshot
- 16.3. Middle East Nanomaterials Market Size (Volume - Tons & Value - US$ Bn), Analysis, and Forecasts, 2021-2035
- 16.3.1. Type
- 16.3.2. Dimensionality
- 16.3.3. Form
- 16.3.4. Particle Size
- 16.3.5. Purity Level
- 16.3.6. Application
- 16.3.7. Country
- 16.3.7.1. Turkey
- 16.3.7.2. UAE
- 16.3.7.3. Saudi Arabia
- 16.3.7.4. Israel
- 16.3.7.5. Rest of Middle East
- 16.4. Turkey Nanomaterials Market
- 16.4.1. Country Segmental Analysis
- 16.4.2. Type
- 16.4.3. Dimensionality
- 16.4.4. Form
- 16.4.5. Particle Size
- 16.4.6. Purity Level
- 16.4.7. Application
- 16.5. UAE Nanomaterials Market
- 16.5.1. Country Segmental Analysis
- 16.5.2. Type
- 16.5.3. Dimensionality
- 16.5.4. Form
- 16.5.5. Particle Size
- 16.5.6. Purity Level
- 16.5.7. Application
- 16.6. Saudi Arabia Nanomaterials Market
- 16.6.1. Country Segmental Analysis
- 16.6.2. Type
- 16.6.3. Dimensionality
- 16.6.4. Form
- 16.6.5. Particle Size
- 16.6.6. Purity Level
- 16.6.7. Application
- 16.7. Israel Nanomaterials Market
- 16.7.1. Country Segmental Analysis
- 16.7.2. Type
- 16.7.3. Dimensionality
- 16.7.4. Form
- 16.7.5. Particle Size
- 16.7.6. Purity Level
- 16.7.7. Application
- 16.8. Rest of Middle East Nanomaterials Market
- 16.8.1. Country Segmental Analysis
- 16.8.2. Type
- 16.8.3. Dimensionality
- 16.8.4. Form
- 16.8.5. Particle Size
- 16.8.6. Purity Level
- 16.8.7. Application
- 17. Africa Nanomaterials Market Analysis
- 17.1. Key Segment Analysis
- 17.2. Regional Snapshot
- 17.3. Africa Nanomaterials Market Size (Volume - Tons & Value - US$ Bn), Analysis, and Forecasts, 2021-2035
- 17.3.1. Type
- 17.3.2. Dimensionality
- 17.3.3. Form
- 17.3.4. Particle Size
- 17.3.5. Purity Level
- 17.3.6. Application
- 17.3.7. Country
- 17.3.7.1. South Africa
- 17.3.7.2. Egypt
- 17.3.7.3. Nigeria
- 17.3.7.4. Algeria
- 17.3.7.5. Rest of Africa
- 17.4. South Africa Nanomaterials Market
- 17.4.1. Country Segmental Analysis
- 17.4.2. Type
- 17.4.3. Dimensionality
- 17.4.4. Form
- 17.4.5. Particle Size
- 17.4.6. Purity Level
- 17.4.7. Application
- 17.5. Egypt Nanomaterials Market
- 17.5.1. Country Segmental Analysis
- 17.5.2. Type
- 17.5.3. Dimensionality
- 17.5.4. Form
- 17.5.5. Particle Size
- 17.5.6. Purity Level
- 17.5.7. Application
- 17.6. Nigeria Nanomaterials Market
- 17.6.1. Country Segmental Analysis
- 17.6.2. Type
- 17.6.3. Dimensionality
- 17.6.4. Form
- 17.6.5. Particle Size
- 17.6.6. Purity Level
- 17.6.7. Application
- 17.7. Algeria Nanomaterials Market
- 17.7.1. Country Segmental Analysis
- 17.7.2. Type
- 17.7.3. Dimensionality
- 17.7.4. Form
- 17.7.5. Particle Size
- 17.7.6. Purity Level
- 17.7.7. Application
- 17.8. Rest of Africa Nanomaterials Market
- 17.8.1. Country Segmental Analysis
- 17.8.2. Type
- 17.8.3. Dimensionality
- 17.8.4. Form
- 17.8.5. Particle Size
- 17.8.6. Purity Level
- 17.8.7. Application
- 18. South America Nanomaterials Market Analysis
- 18.1. Key Segment Analysis
- 18.2. Regional Snapshot
- 18.3. South America Nanomaterials Market Size (Volume - Tons & Value - US$ Bn), Analysis, and Forecasts, 2021-2035
- 18.3.1. Type
- 18.3.2. Dimensionality
- 18.3.3. Form
- 18.3.4. Particle Size
- 18.3.5. Purity Level
- 18.3.6. Application
- 18.3.7. Country
- 18.3.7.1. Brazil
- 18.3.7.2. Argentina
- 18.3.7.3. Rest of South America
- 18.4. Brazil Nanomaterials Market
- 18.4.1. Country Segmental Analysis
- 18.4.2. Type
- 18.4.3. Dimensionality
- 18.4.4. Form
- 18.4.5. Particle Size
- 18.4.6. Purity Level
- 18.4.7. Application
- 18.5. Argentina Nanomaterials Market
- 18.5.1. Country Segmental Analysis
- 18.5.2. Type
- 18.5.3. Dimensionality
- 18.5.4. Form
- 18.5.5. Particle Size
- 18.5.6. Purity Level
- 18.5.7. Application
- 18.6. Rest of South America Nanomaterials Market
- 18.6.1. Country Segmental Analysis
- 18.6.2. Type
- 18.6.3. Dimensionality
- 18.6.4. Form
- 18.6.5. Particle Size
- 18.6.6. Purity Level
- 18.6.7. Application
- 19. Key Players/ Company Profile
- 19.1. BASF SE.
- 19.1.1. Company Details/ Overview
- 19.1.2. Company Financials
- 19.1.3. Key Customers and Competitors
- 19.1.4. Business/ Industry Portfolio
- 19.1.5. Product Portfolio/ Specification Details
- 19.1.6. Pricing Data
- 19.1.7. Strategic Overview
- 19.1.8. Recent Developments
- 19.2. 3M Company
- 19.3. Advanced Nano Products Co., Ltd.
- 19.4. American Elements
- 19.5. Applied Nanotech Holdings, Inc.
- 19.6. Arkema S.A.
- 19.7. Cabot Corporation
- 19.8. Carbon Nanotechnologies, Inc. (CNI)
- 19.9. DuPont de Nemours, Inc.
- 19.10. Evonik Industries AG
- 19.11. Inframat Advanced Materials LLC
- 19.12. MKnano
- 19.13. NanoComposix
- 19.14. Nanocyl SA
- 19.15. Nanophase Technologies Corporation
- 19.16. Nanoshel LLC
- 19.17. Nanostructured & Amorphous Materials, Inc.
- 19.18. Showa Denko K.K.
- 19.19. Sigma-Aldrich Corporation
- 19.20. Strem Chemicals, Inc.
- 19.21. Other Key Players
- 19.1. BASF SE.
Note* - This is just tentative list of players. While providing the report, we will cover more number of players based on their revenue and share for each geography
Research Design
Our research design integrates both demand-side and supply-side analysis through a balanced combination of primary and secondary research methodologies. By utilizing both bottom-up and top-down approaches alongside rigorous data triangulation methods, we deliver robust market intelligence that supports strategic decision-making.
MarketGenics' comprehensive research design framework ensures the delivery of accurate, reliable, and actionable market intelligence. Through the integration of multiple research approaches, rigorous validation processes, and expert analysis, we provide our clients with the insights needed to make informed strategic decisions and capitalize on market opportunities.

MarketGenics leverages a dedicated industry panel of experts and a comprehensive suite of paid databases to effectively collect, consolidate, and analyze market intelligence.
Our approach has consistently proven to be reliable and effective in generating accurate market insights, identifying key industry trends, and uncovering emerging business opportunities.
Through both primary and secondary research, we capture and analyze critical company-level data such as manufacturing footprints, including technical centers, R&D facilities, sales offices, and headquarters.
Our expert panel further enhances our ability to estimate market size for specific brands based on validated field-level intelligence.
Our data mining techniques incorporate both parametric and non-parametric methods, allowing for structured data collection, sorting, processing, and cleaning.
Demand projections are derived from large-scale data sets analyzed through proprietary algorithms, culminating in robust and reliable market sizing.
Research Approach
The bottom-up approach builds market estimates by starting with the smallest addressable market units and systematically aggregating them to create comprehensive market size projections.
This method begins with specific, granular data points and builds upward to create the complete market landscape.
Customer Analysis → Segmental Analysis → Geographical Analysis
The top-down approach starts with the broadest possible market data and systematically narrows it down through a series of filters and assumptions to arrive at specific market segments or opportunities.
This method begins with the big picture and works downward to increasingly specific market slices.
TAM → SAM → SOM


Research Methods
Desk / Secondary Research
While analysing the market, we extensively study secondary sources, directories, and databases to identify and collect information useful for this technical, market-oriented, and commercial report. Secondary sources that we utilize are not only the public sources, but it is a combination of Open Source, Associations, Paid Databases, MG Repository & Knowledgebase, and others.
- Company websites, annual reports, financial reports, broker reports, and investor presentations
- National government documents, statistical databases and reports
- News articles, press releases and web-casts specific to the companies operating in the market, Magazines, reports, and others
- We gather information from commercial data sources for deriving company specific data such as segmental revenue, share for geography, product revenue, and others
- Internal and external proprietary databases (industry-specific), relevant patent, and regulatory databases
- Governing Bodies, Government Organizations
- Relevant Authorities, Country-specific Associations for Industries
We also employ the model mapping approach to estimate the product level market data through the players' product portfolio
Primary Research
Primary research/ interviews is vital in analyzing the market. Most of the cases involves paid primary interviews. Primary sources include primary interviews through e-mail interactions, telephonic interviews, surveys as well as face-to-face interviews with the different stakeholders across the value chain including several industry experts.
| Type of Respondents | Number of Primaries |
|---|---|
| Tier 2/3 Suppliers | ~20 |
| Tier 1 Suppliers | ~25 |
| End-users | ~25 |
| Industry Expert/ Panel/ Consultant | ~30 |
| Total | ~100 |
MG Knowledgebase
• Repository of industry blog, newsletter and case studies
• Online platform covering detailed market reports, and company profiles
Forecasting Factors and Models
Forecasting Factors
- Historical Trends – Past market patterns, cycles, and major events that shaped how markets behave over time. Understanding past trends helps predict future behavior.
- Industry Factors – Specific characteristics of the industry like structure, regulations, and innovation cycles that affect market dynamics.
- Macroeconomic Factors – Economic conditions like GDP growth, inflation, and employment rates that affect how much money people have to spend.
- Demographic Factors – Population characteristics like age, income, and location that determine who can buy your product.
- Technology Factors – How quickly people adopt new technology and how much technology infrastructure exists.
- Regulatory Factors – Government rules, laws, and policies that can help or restrict market growth.
- Competitive Factors – Analyzing competition structure such as degree of competition and bargaining power of buyers and suppliers.
Forecasting Models / Techniques
Multiple Regression Analysis
- Identify and quantify factors that drive market changes
- Statistical modeling to establish relationships between market drivers and outcomes
Time Series Analysis – Seasonal Patterns
- Understand regular cyclical patterns in market demand
- Advanced statistical techniques to separate trend, seasonal, and irregular components
Time Series Analysis – Trend Analysis
- Identify underlying market growth patterns and momentum
- Statistical analysis of historical data to project future trends
Expert Opinion – Expert Interviews
- Gather deep industry insights and contextual understanding
- In-depth interviews with key industry stakeholders
Multi-Scenario Development
- Prepare for uncertainty by modeling different possible futures
- Creating optimistic, pessimistic, and most likely scenarios
Time Series Analysis – Moving Averages
- Sophisticated forecasting for complex time series data
- Auto-regressive integrated moving average models with seasonal components
Econometric Models
- Apply economic theory to market forecasting
- Sophisticated economic models that account for market interactions
Expert Opinion – Delphi Method
- Harness collective wisdom of industry experts
- Structured, multi-round expert consultation process
Monte Carlo Simulation
- Quantify uncertainty and probability distributions
- Thousands of simulations with varying input parameters
Research Analysis
Our research framework is built upon the fundamental principle of validating market intelligence from both demand and supply perspectives. This dual-sided approach ensures comprehensive market understanding and reduces the risk of single-source bias.
Demand-Side Analysis: We understand end-user/application behavior, preferences, and market needs along with the penetration of the product for specific application.
Supply-Side Analysis: We estimate overall market revenue, analyze the segmental share along with industry capacity, competitive landscape, and market structure.
Validation & Evaluation
Data triangulation is a validation technique that uses multiple methods, sources, or perspectives to examine the same research question, thereby increasing the credibility and reliability of research findings. In market research, triangulation serves as a quality assurance mechanism that helps identify and minimize bias, validate assumptions, and ensure accuracy in market estimates.
- Data Source Triangulation – Using multiple data sources to examine the same phenomenon
- Methodological Triangulation – Using multiple research methods to study the same research question
- Investigator Triangulation – Using multiple researchers or analysts to examine the same data
- Theoretical Triangulation – Using multiple theoretical perspectives to interpret the same data

Custom Market Research Services
We will customise the research for you, in case the report listed above does not meet your requirements.
Get 10% Free Customisation