Recyclable Packaging Market Size, Share & Trends Analysis Report by Material Type (Paper & Paperboard, Plastic, Glass, Metal, Wood & Fiber-Based, Biodegradable & Compostable Materials, Hybrid Recyclable), Packaging Type, Recyclability Level, Distribution Channel, End-Use Industry, and Geography (North America, Europe, Asia Pacific, Middle East, Africa, and South America) – Global Industry Data, Trends, and Forecasts, 2026–2035
|
|
|
Segmental Data Insights |
|
|
Demand Trends |
|
|
Competitive Landscape |
|
|
Strategic Development |
|
|
Future Outlook & Opportunities |
|
Recyclable Packaging Market Size, Share, and Growth
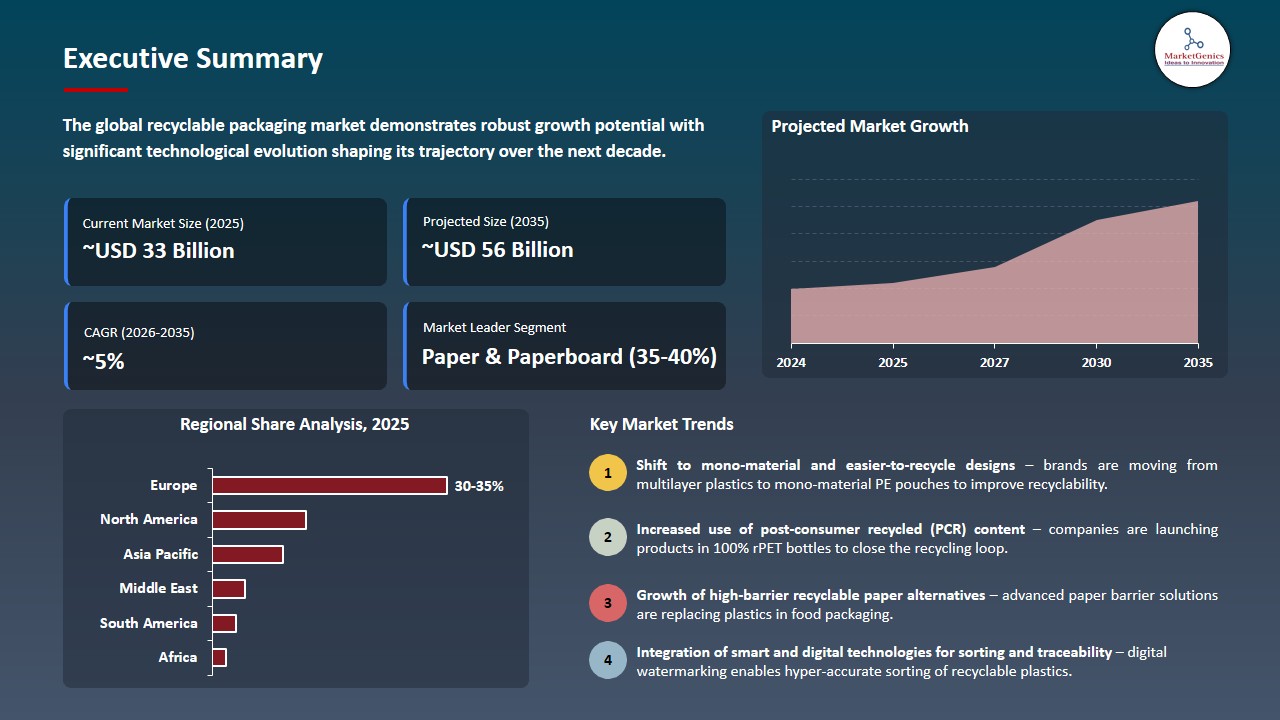
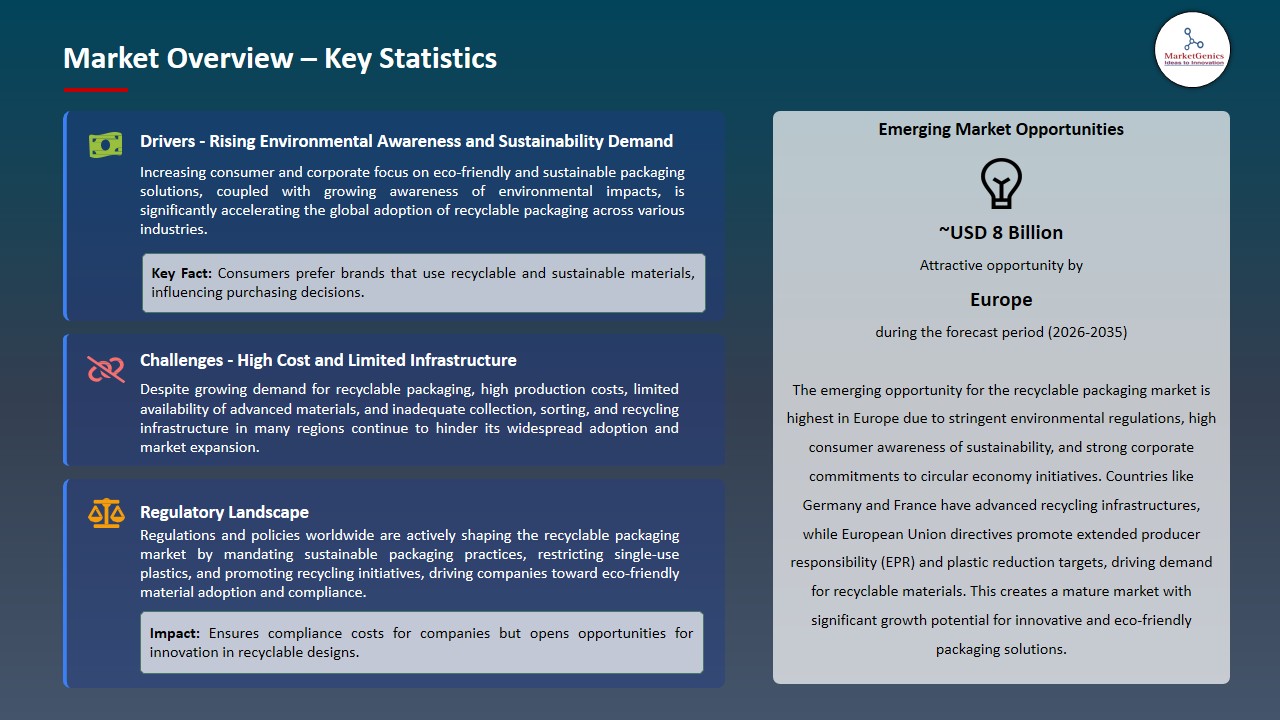
The global recyclable packaging market is exhibiting strong growth, with an estimated value of USD 32.9 billion in 2025 and USD 55.7 billion by 2035, achieving a CAGR of 5.4%, during the forecast period. The global recyclable packaging market is driven by stricter environmental regulations, extended producer responsibility mandates, rising consumer preference for sustainable packaging, brand commitments to circular economy targets, reduction of plastic waste, and continuous advances in recyclable materials and lightweight packaging technologies.
Giorgio Dini, Marketing Manager for Coffee at Amcor says: “This newest addition to the AmFiber™ family offers coffee and dry beverage brands a more attractive packaging solution that has a natural, paper-based appeal and is recycle-ready. Helping to advance more circular refill packaging, we are proud to announce the AmFiber™ Performance Paper stand-up pouch, as we continue to innovate in paper-based solutions.”
Growth in innovation of recyclable materials and solutions is driving the recyclable packaging market, as firms seek to address environmental imperatives and regulatory demands. For instance, in July 2025, Dow Inc. launched its INNATE TF 220 Precision Packaging Resin to make entirely recyclable BOPE film that could be used in flexible packaging so that brands such as Liby could introduce detergent packaging with 10% post-consumer recycled content, showing real-world use of advanced recyclable materials. The recyclable materials are remarkable in making it sustainable, ensure regulatory conformity, and fuel mass implementation of green packaging solutions.
Furthermore, the consumer and corporate drive toward sustainability and circular economy behavior is also pushing towards the need of recyclable packaging solutions. For instance, in January 2026, Bel Group held a press release that stated that by 2027, all packaging of Babybel cheese would be switched to fully recyclable paper wrapping (in its entirety), which reinforced the adoption of sustainability on a brand level. This move to sustainable packaging enhances brand reputation, fastens the use of recyclable solutions, and promotes circular economy initiatives in the world.
The global recyclable packaging market presents adjacent opportunities in biodegradable flexible films, compostable containers, post-consumer recycled plastics, reusable packaging systems, and sustainable labeling solutions. These sectors complement core recyclable packaging by offering alternative or enhanced eco-friendly options, enabling manufacturers to diversify portfolios, meet evolving consumer demands, and support regulatory compliance. The innovation enabled by expanding into these adjacent markets, sustainable credentials, and novel revenue streams are offered by packaging manufacturers.
Recyclable Packaging Market Dynamics and Trends
Driver: Breakthrough Recyclable Fiber Packaging Innovations by Leading Manufacturers
-
The innovations in materials are driving the recyclable packaging market as major manufacturers develops solutions that are highly recyclable, yet do not compromise the functional performance. These innovations will ensure product integrity, increase scalability and address increasing requirements of sustainability in the food, beverage and consumer goods industry.
- For instance, in November 2025, PAPACKS won The Sustainability Award 2025 in relation to its recyclable Fiber Bottle, a renewable-based material packaging system with an inbuilt barrier property that could access food and supplement products. This breakthrough is the move towards pre-commercialization and series production with industrial partners, which shows that the industry is dedicated to lessening the dependence on traditional plastics and provide high-performance packaging solutions.
- The development of materials that can be recycled increases sustainable packaging opportunities, promotes the use of circularity, and introduces new standards of performance and environmental responsibility to the global recyclable packaging market.
Restraint: Recycling Infrastructure Limitations Impede End‑of‑Life Material Recovery
-
The lack of recycling infrastructure in many areas limits the amount of packaging that can be efficiently collected, sorted, and reprocessed, which is a major barrier to the recyclable packaging market. Although manufacturers create fully recyclable formats, the lack of standardized collection and processing systems especially of flexible films and multi-material laminates reduces actual rates of recovery and negates the goals of the circular economy.
- This lack of infrastructure makes the cost of sophisticated sorting systems higher and does not encourage brand holders to design their products in a way that is easy to recycle when recycling routes are unpredictable or uneven in markets. By implication, recyclable packaging investment can be dampened even in the face of significant design innovation and increased sustainability pledges.
- The lack of recycling infrastructure in many areas restricts the recovery of material, the reduction of environmental advantages, and the acceleration of the global implementation of recyclable packaging policies.
Opportunity: Adoption of Mono‑Material Recyclable Formats for High‑Barrier Applications
-
The recyclable packaging market is experiencing a major growth potential through development and implementation of mono-material format which provides recyclability and high-barrier characteristics to liquids and other sensitive products.
- For example, Aran Group’s MonoFlex recyclable Bag‑in‑Box system, recognized at the Star of Israel 2026 Awards, utilizes over 95% polyethylene, with a small amount of a barrier coating, which can be recycled in the existing PE streams, and also protects liquid food products on the shelf.
- The mono-material innovations also decrease the use of complex multi-layered laminates that are difficult to recycle, which accelerates their use in food, beverage and personal care industries. The concept of mono-material formats offers a framework of cyclical economic goals by integrating both environmental sustainability and functionality.
- Adoption of mono-material recyclable packaging improves recyclability, reduces waste due to non-recyclable laminates, and stimulates demand of sustainable and high-performance packaging solutions.
Key Trend: Advanced Recyclable Material Innovation as a Key Market Trend Shaping Competitive Landscapes
-
The increasing growth rate of new improved materials and design solutions that can make recycling easier without impacting the performance is prominent trends with regard to the recyclable packaging. The latest technological developments such as Dow launching INNATE 220 recyclable resin of flexible BOPE films toward recycling shows how producers are streamlining material use, cutting down on waste during production, and enhancing the efforts to adopt the circular economy.
- This trend highlights a wider industry trend towards mono material films, high performance barrier coating and fully recyclable paperboard solutions that can be used with an existing collection and recycling infrastructure to reduce contamination and enhance the take-off of materials.
- The innovation of high-barrier recyclable films in food and pharmaceuticals by leading companies is a combination of performance with sustainability and an expanded variety of packaging could be recycled in personal care, pet food, and ready-to-eat products.
- The strategic innovation in materials helps to improve the competitive positioning, increase the market coverage, and speed up the implementation of sustainable packaging policies worldwide.
Recyclable Packaging Market Analysis and Segmental Data

Paper & Paperboard Dominate Global Recyclable Packaging Market
-
The paper & paperboard segment dominates the global recyclable packaging market because of their inherent recyclable nature, the fact that consumers and governments prefer sustainable material and because the recycling infrastructures are in place to support the goals of the circular economy.
- Paper-based recyclable packaging, including corrugated cardboard, folding cartons, and fiber-based packaging, has a significant share of the recyclable packaging demand, with the potential to be effectively collected and re-utilized through the available recycling mechanisms, and is therefore less wasteful and less harmful to the environment than many plastic packages.
- Major manufacturers such as the International Paper Company clearly focus on renewable fibers and circularity in their packaging portfolio where they create corrugated and paperboard products that can be easily recycled and incorporate recycled material, as explained in their sustainability endeavors.
- This leadership will accelerate the move towards circular packaging and value chains of renewable materials across the globe.
Europe Leads Global Recyclable Packaging Market Demand
-
Europe leads the recyclable packaging market, owing to the market demand created by regulations, where EU policies require the manufacturers and brands to use the recyclable packaging formats, such as cartons, PET bottles, mono-material solutions, and mono-material solutions. Good compliance and alignment with consumers have been observed in countries like Germany, France, and the Netherlands which have reported accelerated adoption rates.
- Additionally, corporate innovation and sustainable product development, such as Amcor which provides recyclable products, including AmFiber paper-based packaging and AmPrima mono-material pouches (developed to hit the European recyclability standards). These are proactive corporate alignment programs with regulatory and market needs.
- The intersection of regulatory pressure and the corporate innovativeness strengthens leadership in the European market, enhancing faster uptake of recyclable packages and setting the international standards of sustainability.
Recyclable Packaging Market Ecosystem
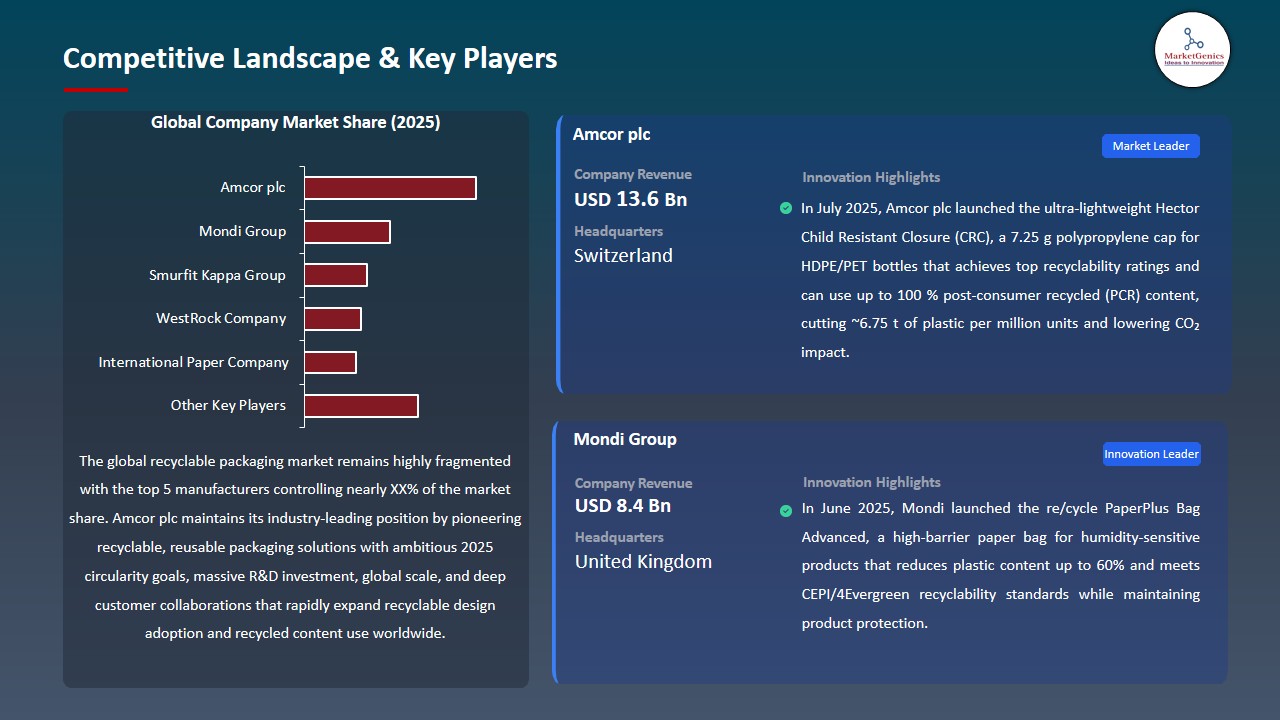
The global recyclable packaging market is highly fragmented, with global leaders such as Amcor plc, Mondi Group, Smurfit Kappa Group, WestRock Company, and International Paper Company dominating through their capabilities of large-scale manufacturing, proprietary materials science, and converting technology to facilitate high performance recyclable solutions in food, beverage, personal care and industrial end uses.
This trend has seen these companies focusing more on niche and specialized technologies, such as mono-material flexible packaging, high-barrier recyclable papers, fiber-based alternatives to plastic, and lightweight closures with post-consumer recycling (PCR) content. E.g. the paper-based refill packs of Amcor, high-barrier recyclable paper bags of Mondi, or paper-based Bag-in-Box systems of Smurfit Kappa are examples of how product engineering specifically is creating performance parity with traditional plastics at the same time enhancing recyclability.
Government organizations, institutions, and research and development agencies are at the center of increasing innovation through the funding of circular economy initiatives and recycling research. In June 2025, Mondi declared that it produced recycled containerboard at its Duino mill in Italy, and this would serve the European corrugated and flexible packaging infrastructure of recycled packaging and reinforce supply of recyclable fiber material to the recycled corrugated and flexible packaging process.
These advances have the effect of accelerating the uptake of circular packaging and boosting sustainable supply chains of materials and increasing access to high-performance recyclable solutions in global end-use segments.
Recent Development and Strategic Overview:
-
In September 2025, Smurfit Westrock announced the launch of its Bag-in-Box Powergrip solution, featuring up to 75% lower plastic content versus HDPE alternatives, supporting recyclable packaging formats and alignment with forthcoming EU Packaging & Packaging Waste Regulation (PPWR) requirements.
- In March 2025, Amcor introduced the AmFiber™ Performance Paper stand-up pouch for instant coffee and dry beverages, a recycle-ready, paper-based refill solution engineered for curbside recycling across select European markets, advancing carbon-reduction and circular economy objectives.
Report Scope
|
Detail |
|
|
Market Size in 2025 |
USD 32.9 Bn |
|
Market Forecast Value in 2035 |
USD 55.7 Bn |
|
Growth Rate (CAGR) |
5.4% |
|
Forecast Period |
2026 – 2035 |
|
Historical Data Available for |
2021 – 2024 |
|
Market Size Units |
US$ Billion for Value |
|
Report Format |
Electronic (PDF) + Excel |
|
North America |
Europe |
Asia Pacific |
Middle East |
Africa |
South America |
|
|
|
|
|
|
|
Companies Covered |
|||||
|
|
|
|
|
|
Recyclable Packaging Market Segmentation and Highlights
|
Segment |
Sub-segment |
|
Recyclable Packaging Market, By Material Type |
|
|
Recyclable Packaging Market, By Packaging Type |
|
|
Recyclable Packaging Market, By Recyclability Level |
|
|
Recyclable Packaging Market, By Distribution Channel |
|
|
Recyclable Packaging Market, By End-Use Industry |
|
Frequently Asked Questions
Table of Contents
- 1. Research Methodology and Assumptions
- 1.1. Definitions
- 1.2. Research Design and Approach
- 1.3. Data Collection Methods
- 1.4. Base Estimates and Calculations
- 1.5. Forecasting Models
- 1.5.1. Key Forecast Factors & Impact Analysis
- 1.6. Secondary Research
- 1.6.1. Open Sources
- 1.6.2. Paid Databases
- 1.6.3. Associations
- 1.7. Primary Research
- 1.7.1. Primary Sources
- 1.7.2. Primary Interviews with Stakeholders across Ecosystem
- 2. Executive Summary
- 2.1. Global Recyclable Packaging Market Outlook
- 2.1.1. Recyclable Packaging Market Size (Value - US$ Bn), and Forecasts, 2021-2035
- 2.1.2. Compounded Annual Growth Rate Analysis
- 2.1.3. Growth Opportunity Analysis
- 2.1.4. Segmental Share Analysis
- 2.1.5. Geographical Share Analysis
- 2.2. Market Analysis and Facts
- 2.3. Supply-Demand Analysis
- 2.4. Competitive Benchmarking
- 2.5. Go-to- Market Strategy
- 2.5.1. Customer/ End-use Industry Assessment
- 2.5.2. Growth Opportunity Data, 2026-2035
- 2.5.2.1. Regional Data
- 2.5.2.2. Country Data
- 2.5.2.3. Segmental Data
- 2.5.3. Identification of Potential Market Spaces
- 2.5.4. GAP Analysis
- 2.5.5. Potential Attractive Price Points
- 2.5.6. Prevailing Market Risks & Challenges
- 2.5.7. Preferred Sales & Marketing Strategies
- 2.5.8. Key Recommendations and Analysis
- 2.5.9. A Way Forward
- 2.1. Global Recyclable Packaging Market Outlook
- 3. Industry Data and Premium Insights
- 3.1. Global Packaging Industry Overview, 2025
- 3.1.1. Packaging Ecosystem Analysis
- 3.1.2. Key Trends for Packaging Industry
- 3.1.3. Regional Distribution for Packaging Industry
- 3.2. Supplier Customer Data
- 3.3. Technology Roadmap and Developments
- 3.4. Trade Analysis
- 3.4.1. Import & Export Analysis, 2025
- 3.4.2. Top Importing Countries
- 3.4.3. Top Exporting Countries
- 3.5. Trump Tariff Impact Analysis
- 3.5.1. Manufacturer
- 3.5.1.1. Based on the component & Raw material
- 3.5.2. Supply Chain
- 3.5.3. End Consumer
- 3.5.1. Manufacturer
- 3.6. Raw Material Analysis
- 3.1. Global Packaging Industry Overview, 2025
- 4. Market Overview
- 4.1. Market Dynamics
- 4.1.1. Drivers
- 4.1.1.1. Rising environmental awareness and consumer demand for sustainable packaging solutions
- 4.1.1.2. Innovations in recycling technologies and recyclable materials
- 4.1.1.3. Government regulations and policies promoting recyclable packaging and restricting single‑use plastics
- 4.1.2. Restraints
- 4.1.2.1. Limited recycling infrastructure and inadequate collection/sorting facilities
- 4.1.2.2. Higher costs and performance limitations of recyclable materials compared to traditional packaging
- 4.1.1. Drivers
- 4.2. Key Trend Analysis
- 4.3. Regulatory Framework
- 4.3.1. Key Regulations, Norms, and Subsidies, by Key Countries
- 4.3.2. Tariffs and Standards
- 4.3.3. Impact Analysis of Regulations on the Market
- 4.4. Value Chain Analysis
- 4.5. Porter’s Five Forces Analysis
- 4.6. PESTEL Analysis
- 4.7. Global Recyclable Packaging Market Demand
- 4.7.1. Historical Market Size – in Value (US$ Bn), 2020-2024
- 4.7.2. Current and Future Market Size – in Value (US$ Bn), 2026–2035
- 4.7.2.1. Y-o-Y Growth Trends
- 4.7.2.2. Absolute $ Opportunity Assessment
- 4.1. Market Dynamics
- 5. Competition Landscape
- 5.1. Competition structure
- 5.1.1. Fragmented v/s consolidated
- 5.2. Company Share Analysis, 2025
- 5.2.1. Global Company Market Share
- 5.2.2. By Region
- 5.2.2.1. North America
- 5.2.2.2. Europe
- 5.2.2.3. Asia Pacific
- 5.2.2.4. Middle East
- 5.2.2.5. Africa
- 5.2.2.6. South America
- 5.3. Product Comparison Matrix
- 5.3.1. Specifications
- 5.3.2. Market Positioning
- 5.3.3. Pricing
- 5.1. Competition structure
- 6. Global Recyclable Packaging Market Analysis, by Material Type
- 6.1. Key Segment Analysis
- 6.2. Recyclable Packaging Market Size (Value - US$ Bn), Analysis, and Forecasts, by Material Type, 2021-2035
- 6.2.1. Paper & Paperboard
- 6.2.1.1. Corrugated Board
- 6.2.1.2. Kraft Paper
- 6.2.1.3. Coated & Uncoated Paperboard
- 6.2.1.4. Molded Pulp
- 6.2.1.5. Others
- 6.2.2. Plastic
- 6.2.2.1. Polyethylene Terephthalate
- 6.2.2.2. High-Density Polyethylene
- 6.2.2.3. Low-Density Polyethylene
- 6.2.2.4. Polypropylene
- 6.2.2.5. Polyvinyl Chloride
- 6.2.2.6. Others
- 6.2.3. Glass
- 6.2.3.1. Clear/Flint Glass
- 6.2.3.2. Amber Glass
- 6.2.3.3. Borosilicate Glass
- 6.2.3.4. Others
- 6.2.4. Metal
- 6.2.4.1. Aluminum
- 6.2.4.2. Steel
- 6.2.5. Wood & Fiber-Based
- 6.2.6. Biodegradable & Compostable Materials
- 6.2.7. Hybrid Recyclable
- 6.2.1. Paper & Paperboard
- 7. Global Recyclable Packaging Market Analysis, by Packaging Type
- 7.1. Key Segment Analysis
- 7.2. Recyclable Packaging Market Size (Value - US$ Bn), Analysis, and Forecasts, by Packaging Type, 2021-2035
- 7.2.1. Rigid Packaging
- 7.2.1.1. Bottles & Jars
- 7.2.1.2. Cans & Tins
- 7.2.1.3. Trays & Tubs
- 7.2.1.4. Drums & IBCs
- 7.2.1.5. Clamshells & Blisters
- 7.2.1.6. Others
- 7.2.2. Flexible Packaging
- 7.2.2.1. Pouches
- 7.2.2.2. Wraps & Films
- 7.2.2.3. Bags & Sacks
- 7.2.2.4. Others
- 7.2.3. Semi-Rigid Packaging
- 7.2.3.1. Folding Cartons
- 7.2.3.2. Corrugated Boxes
- 7.2.3.3. Molded Fiber Trays
- 7.2.3.4. Others
- 7.2.4. Specialty Packaging
- 7.2.1. Rigid Packaging
- 8. Global Recyclable Packaging Market Analysis, by Recyclability Level
- 8.1. Key Segment Analysis
- 8.2. Recyclable Packaging Market Size (Value - US$ Bn), Analysis, and Forecasts, by Recyclability Level, 2021-2035
- 8.2.1. 100% Recyclable
- 8.2.2. Partially Recyclable
- 8.2.3. Recyclable with Specific Stream
- 8.2.4. Design-for-Recycling (DfR) Certified
- 8.2.5. Post-Consumer Recycled (PCR) Content-Based
- 8.2.5.1. 25%–50% PCR Content
- 8.2.5.2. 51%–75% PCR Content
- 8.2.5.3. 76%–100% PCR Content
- 9. Global Recyclable Packaging Market Analysis, by Distribution Channel
- 9.1. Key Segment Analysis
- 9.2. Recyclable Packaging Market Size (Value - US$ Bn), Analysis, and Forecasts, by Distribution Channel, 2021-2035
- 9.2.1. Business-to-Business (B2B)
- 9.2.2. Business-to-Consumer (B2C)
- 10. Global Recyclable Packaging Market Analysis, by End-Use Industry
- 10.1. Key Segment Analysis
- 10.2. Recyclable Packaging Market Size (Value - US$ Bn), Analysis, and Forecasts, by End-Use Industry, 2021-2035
- 10.2.1. Food & Beverage
- 10.2.2. Healthcare & Pharmaceuticals
- 10.2.3. Personal Care & Cosmetics
- 10.2.4. Household & Industrial Chemicals (HIC)
- 10.2.5. E-commerce & Retail
- 10.2.6. Consumer Electronics & Electricals
- 10.2.7. Apparel, Footwear & Textile
- 10.2.8. Agriculture & Horticulture
- 10.2.9. Foodservice & On-the-Go
- 10.2.10. Building & Construction
- 10.2.11. Industrial
- 10.2.12. Others
- 11. Global Recyclable Packaging Market Analysis, by Region
- 11.1. Key Findings
- 11.2. Recyclable Packaging Market Size (Value - US$ Bn), Analysis, and Forecasts, by Region, 2021-2035
- 11.2.1. North America
- 11.2.2. Europe
- 11.2.3. Asia Pacific
- 11.2.4. Middle East
- 11.2.5. Africa
- 11.2.6. South America
- 12. North America Recyclable Packaging Market Analysis
- 12.1. Key Segment Analysis
- 12.2. Regional Snapshot
- 12.3. North America Recyclable Packaging Market Size (Value - US$ Bn), Analysis, and Forecasts, 2021-2035
- 12.3.1. Material Type
- 12.3.2. Packaging Type
- 12.3.3. Recyclability Level
- 12.3.4. Distribution Channel
- 12.3.5. End-Use Industry
- 12.3.6. Country
- 12.3.6.1. USA
- 12.3.6.2. Canada
- 12.3.6.3. Mexico
- 12.4. USA Recyclable Packaging Market
- 12.4.1. Country Segmental Analysis
- 12.4.2. Material Type
- 12.4.3. Packaging Type
- 12.4.4. Recyclability Level
- 12.4.5. Distribution Channel
- 12.4.6. End-Use Industry
- 12.5. Canada Recyclable Packaging Market
- 12.5.1. Country Segmental Analysis
- 12.5.2. Material Type
- 12.5.3. Packaging Type
- 12.5.4. Recyclability Level
- 12.5.5. Distribution Channel
- 12.5.6. End-Use Industry
- 12.6. Mexico Recyclable Packaging Market
- 12.6.1. Country Segmental Analysis
- 12.6.2. Material Type
- 12.6.3. Packaging Type
- 12.6.4. Recyclability Level
- 12.6.5. Distribution Channel
- 12.6.6. End-Use Industry
- 13. Europe Recyclable Packaging Market Analysis
- 13.1. Key Segment Analysis
- 13.2. Regional Snapshot
- 13.3. Europe Recyclable Packaging Market Size (Value - US$ Bn), Analysis, and Forecasts, 2021-2035
- 13.3.1. Material Type
- 13.3.2. Packaging Type
- 13.3.3. Recyclability Level
- 13.3.4. Distribution Channel
- 13.3.5. End-Use Industry
- 13.3.6. Country
- 13.3.6.1. Germany
- 13.3.6.2. United Kingdom
- 13.3.6.3. France
- 13.3.6.4. Italy
- 13.3.6.5. Spain
- 13.3.6.6. Netherlands
- 13.3.6.7. Nordic Countries
- 13.3.6.8. Poland
- 13.3.6.9. Russia & CIS
- 13.3.6.10. Rest of Europe
- 13.4. Germany Recyclable Packaging Market
- 13.4.1. Country Segmental Analysis
- 13.4.2. Material Type
- 13.4.3. Packaging Type
- 13.4.4. Recyclability Level
- 13.4.5. Distribution Channel
- 13.4.6. End-Use Industry
- 13.5. United Kingdom Recyclable Packaging Market
- 13.5.1. Country Segmental Analysis
- 13.5.2. Material Type
- 13.5.3. Packaging Type
- 13.5.4. Recyclability Level
- 13.5.5. Distribution Channel
- 13.5.6. End-Use Industry
- 13.6. France Recyclable Packaging Market
- 13.6.1. Country Segmental Analysis
- 13.6.2. Material Type
- 13.6.3. Packaging Type
- 13.6.4. Recyclability Level
- 13.6.5. Distribution Channel
- 13.6.6. End-Use Industry
- 13.7. Italy Recyclable Packaging Market
- 13.7.1. Country Segmental Analysis
- 13.7.2. Material Type
- 13.7.3. Packaging Type
- 13.7.4. Recyclability Level
- 13.7.5. Distribution Channel
- 13.7.6. End-Use Industry
- 13.8. Spain Recyclable Packaging Market
- 13.8.1. Country Segmental Analysis
- 13.8.2. Material Type
- 13.8.3. Packaging Type
- 13.8.4. Recyclability Level
- 13.8.5. Distribution Channel
- 13.8.6. End-Use Industry
- 13.9. Netherlands Recyclable Packaging Market
- 13.9.1. Country Segmental Analysis
- 13.9.2. Material Type
- 13.9.3. Packaging Type
- 13.9.4. Recyclability Level
- 13.9.5. Distribution Channel
- 13.9.6. End-Use Industry
- 13.10. Nordic Countries Recyclable Packaging Market
- 13.10.1. Country Segmental Analysis
- 13.10.2. Material Type
- 13.10.3. Packaging Type
- 13.10.4. Recyclability Level
- 13.10.5. Distribution Channel
- 13.10.6. End-Use Industry
- 13.11. Poland Recyclable Packaging Market
- 13.11.1. Country Segmental Analysis
- 13.11.2. Material Type
- 13.11.3. Packaging Type
- 13.11.4. Recyclability Level
- 13.11.5. Distribution Channel
- 13.11.6. End-Use Industry
- 13.12. Russia & CIS Recyclable Packaging Market
- 13.12.1. Country Segmental Analysis
- 13.12.2. Material Type
- 13.12.3. Packaging Type
- 13.12.4. Recyclability Level
- 13.12.5. Distribution Channel
- 13.12.6. End-Use Industry
- 13.13. Rest of Europe Recyclable Packaging Market
- 13.13.1. Country Segmental Analysis
- 13.13.2. Material Type
- 13.13.3. Packaging Type
- 13.13.4. Recyclability Level
- 13.13.5. Distribution Channel
- 13.13.6. End-Use Industry
- 14. Asia Pacific Recyclable Packaging Market Analysis
- 14.1. Key Segment Analysis
- 14.2. Regional Snapshot
- 14.3. Asia Pacific Recyclable Packaging Market Size (Value - US$ Bn), Analysis, and Forecasts, 2021-2035
- 14.3.1. Material Type
- 14.3.2. Packaging Type
- 14.3.3. Recyclability Level
- 14.3.4. Distribution Channel
- 14.3.5. End-Use Industry
- 14.3.6. Country
- 14.3.6.1. China
- 14.3.6.2. India
- 14.3.6.3. Japan
- 14.3.6.4. South Korea
- 14.3.6.5. Australia and New Zealand
- 14.3.6.6. Indonesia
- 14.3.6.7. Malaysia
- 14.3.6.8. Thailand
- 14.3.6.9. Vietnam
- 14.3.6.10. Rest of Asia Pacific
- 14.4. China Recyclable Packaging Market
- 14.4.1. Country Segmental Analysis
- 14.4.2. Material Type
- 14.4.3. Packaging Type
- 14.4.4. Recyclability Level
- 14.4.5. Distribution Channel
- 14.4.6. End-Use Industry
- 14.5. India Recyclable Packaging Market
- 14.5.1. Country Segmental Analysis
- 14.5.2. Material Type
- 14.5.3. Packaging Type
- 14.5.4. Recyclability Level
- 14.5.5. Distribution Channel
- 14.5.6. End-Use Industry
- 14.6. Japan Recyclable Packaging Market
- 14.6.1. Country Segmental Analysis
- 14.6.2. Material Type
- 14.6.3. Packaging Type
- 14.6.4. Recyclability Level
- 14.6.5. Distribution Channel
- 14.6.6. End-Use Industry
- 14.7. South Korea Recyclable Packaging Market
- 14.7.1. Country Segmental Analysis
- 14.7.2. Material Type
- 14.7.3. Packaging Type
- 14.7.4. Recyclability Level
- 14.7.5. Distribution Channel
- 14.7.6. End-Use Industry
- 14.8. Australia and New Zealand Recyclable Packaging Market
- 14.8.1. Country Segmental Analysis
- 14.8.2. Material Type
- 14.8.3. Packaging Type
- 14.8.4. Recyclability Level
- 14.8.5. Distribution Channel
- 14.8.6. End-Use Industry
- 14.9. Indonesia Recyclable Packaging Market
- 14.9.1. Country Segmental Analysis
- 14.9.2. Material Type
- 14.9.3. Packaging Type
- 14.9.4. Recyclability Level
- 14.9.5. Distribution Channel
- 14.9.6. End-Use Industry
- 14.10. Malaysia Recyclable Packaging Market
- 14.10.1. Country Segmental Analysis
- 14.10.2. Material Type
- 14.10.3. Packaging Type
- 14.10.4. Recyclability Level
- 14.10.5. Distribution Channel
- 14.10.6. End-Use Industry
- 14.11. Thailand Recyclable Packaging Market
- 14.11.1. Country Segmental Analysis
- 14.11.2. Material Type
- 14.11.3. Packaging Type
- 14.11.4. Recyclability Level
- 14.11.5. Distribution Channel
- 14.11.6. End-Use Industry
- 14.12. Vietnam Recyclable Packaging Market
- 14.12.1. Country Segmental Analysis
- 14.12.2. Material Type
- 14.12.3. Packaging Type
- 14.12.4. Recyclability Level
- 14.12.5. Distribution Channel
- 14.12.6. End-Use Industry
- 14.13. Rest of Asia Pacific Recyclable Packaging Market
- 14.13.1. Country Segmental Analysis
- 14.13.2. Material Type
- 14.13.3. Packaging Type
- 14.13.4. Recyclability Level
- 14.13.5. Distribution Channel
- 14.13.6. End-Use Industry
- 15. Middle East Recyclable Packaging Market Analysis
- 15.1. Key Segment Analysis
- 15.2. Regional Snapshot
- 15.3. Middle East Recyclable Packaging Market Size (Value - US$ Bn), Analysis, and Forecasts, 2021-2035
- 15.3.1. Material Type
- 15.3.2. Packaging Type
- 15.3.3. Recyclability Level
- 15.3.4. Distribution Channel
- 15.3.5. End-Use Industry
- 15.3.6. Country
- 15.3.6.1. Turkey
- 15.3.6.2. UAE
- 15.3.6.3. Saudi Arabia
- 15.3.6.4. Israel
- 15.3.6.5. Rest of Middle East
- 15.4. Turkey Recyclable Packaging Market
- 15.4.1. Country Segmental Analysis
- 15.4.2. Material Type
- 15.4.3. Packaging Type
- 15.4.4. Recyclability Level
- 15.4.5. Distribution Channel
- 15.4.6. End-Use Industry
- 15.5. UAE Recyclable Packaging Market
- 15.5.1. Country Segmental Analysis
- 15.5.2. Material Type
- 15.5.3. Packaging Type
- 15.5.4. Recyclability Level
- 15.5.5. Distribution Channel
- 15.5.6. End-Use Industry
- 15.6. Saudi Arabia Recyclable Packaging Market
- 15.6.1. Country Segmental Analysis
- 15.6.2. Material Type
- 15.6.3. Packaging Type
- 15.6.4. Recyclability Level
- 15.6.5. Distribution Channel
- 15.6.6. End-Use Industry
- 15.7. Israel Recyclable Packaging Market
- 15.7.1. Country Segmental Analysis
- 15.7.2. Material Type
- 15.7.3. Packaging Type
- 15.7.4. Recyclability Level
- 15.7.5. Distribution Channel
- 15.7.6. End-Use Industry
- 15.8. Rest of Middle East Recyclable Packaging Market
- 15.8.1. Country Segmental Analysis
- 15.8.2. Material Type
- 15.8.3. Packaging Type
- 15.8.4. Recyclability Level
- 15.8.5. Distribution Channel
- 15.8.6. End-Use Industry
- 16. Africa Recyclable Packaging Market Analysis
- 16.1. Key Segment Analysis
- 16.2. Regional Snapshot
- 16.3. Africa Recyclable Packaging Market Size (Value - US$ Bn), Analysis, and Forecasts, 2021-2035
- 16.3.1. Material Type
- 16.3.2. Packaging Type
- 16.3.3. Recyclability Level
- 16.3.4. Distribution Channel
- 16.3.5. End-Use Industry
- 16.3.6. Country
- 16.3.6.1. South Africa
- 16.3.6.2. Egypt
- 16.3.6.3. Nigeria
- 16.3.6.4. Algeria
- 16.3.6.5. Rest of Africa
- 16.4. South Africa Recyclable Packaging Market
- 16.4.1. Country Segmental Analysis
- 16.4.2. Material Type
- 16.4.3. Packaging Type
- 16.4.4. Recyclability Level
- 16.4.5. Distribution Channel
- 16.4.6. End-Use Industry
- 16.5. Egypt Recyclable Packaging Market
- 16.5.1. Country Segmental Analysis
- 16.5.2. Material Type
- 16.5.3. Packaging Type
- 16.5.4. Recyclability Level
- 16.5.5. Distribution Channel
- 16.5.6. End-Use Industry
- 16.6. Nigeria Recyclable Packaging Market
- 16.6.1. Country Segmental Analysis
- 16.6.2. Material Type
- 16.6.3. Packaging Type
- 16.6.4. Recyclability Level
- 16.6.5. Distribution Channel
- 16.6.6. End-Use Industry
- 16.7. Algeria Recyclable Packaging Market
- 16.7.1. Country Segmental Analysis
- 16.7.2. Material Type
- 16.7.3. Packaging Type
- 16.7.4. Recyclability Level
- 16.7.5. Distribution Channel
- 16.7.6. End-Use Industry
- 16.8. Rest of Africa Recyclable Packaging Market
- 16.8.1. Country Segmental Analysis
- 16.8.2. Material Type
- 16.8.3. Packaging Type
- 16.8.4. Recyclability Level
- 16.8.5. Distribution Channel
- 16.8.6. End-Use Industry
- 17. South America Recyclable Packaging Market Analysis
- 17.1. Key Segment Analysis
- 17.2. Regional Snapshot
- 17.3. South America Recyclable Packaging Market Size (Value - US$ Bn), Analysis, and Forecasts, 2021-2035
- 17.3.1. Material Type
- 17.3.2. Packaging Type
- 17.3.3. Recyclability Level
- 17.3.4. Distribution Channel
- 17.3.5. End-Use Industry
- 17.3.6. Country
- 17.3.6.1. Brazil
- 17.3.6.2. Argentina
- 17.3.6.3. Rest of South America
- 17.4. Brazil Recyclable Packaging Market
- 17.4.1. Country Segmental Analysis
- 17.4.2. Material Type
- 17.4.3. Packaging Type
- 17.4.4. Recyclability Level
- 17.4.5. Distribution Channel
- 17.4.6. End-Use Industry
- 17.5. Argentina Recyclable Packaging Market
- 17.5.1. Country Segmental Analysis
- 17.5.2. Material Type
- 17.5.3. Packaging Type
- 17.5.4. Recyclability Level
- 17.5.5. Distribution Channel
- 17.5.6. End-Use Industry
- 17.6. Rest of South America Recyclable Packaging Market
- 17.6.1. Country Segmental Analysis
- 17.6.2. Material Type
- 17.6.3. Packaging Type
- 17.6.4. Recyclability Level
- 17.6.5. Distribution Channel
- 17.6.6. End-Use Industry
- 18. Key Players/ Company Profile
- 18.1. Amcor plc
- 18.1.1. Company Details/ Overview
- 18.1.2. Company Financials
- 18.1.3. Key Customers and Competitors
- 18.1.4. Business/ Industry Portfolio
- 18.1.5. Product Portfolio/ Specification Details
- 18.1.6. Pricing Data
- 18.1.7. Strategic Overview
- 18.1.8. Recent Developments
- 18.2. AptarGroup, Inc.
- 18.3. Berry Global Group, Inc.
- 18.4. Coveris Holdings
- 18.5. DS Smith plc
- 18.6. Elopak AS
- 18.7. Graphic Packaging International
- 18.8. Greif, Inc.
- 18.9. Huhtamaki Oyj
- 18.10. International Paper Company
- 18.11. Mondi Group
- 18.12. Novatek International
- 18.13. Pactiv Evergreen Inc.
- 18.14. Sealed Air Corporation
- 18.15. SIG Group AG
- 18.16. Silgan Holdings Inc.
- 18.17. Smurfit Kappa Group
- 18.18. Sonoco Products Company
- 18.19. Tetra Pak International S.A.
- 18.20. WestRock Company
- 18.21. Other Key Players
- 18.1. Amcor plc
Note* - This is just tentative list of players. While providing the report, we will cover more number of players based on their revenue and share for each geography
Research Design
Our research design integrates both demand-side and supply-side analysis through a balanced combination of primary and secondary research methodologies. By utilizing both bottom-up and top-down approaches alongside rigorous data triangulation methods, we deliver robust market intelligence that supports strategic decision-making.
MarketGenics' comprehensive research design framework ensures the delivery of accurate, reliable, and actionable market intelligence. Through the integration of multiple research approaches, rigorous validation processes, and expert analysis, we provide our clients with the insights needed to make informed strategic decisions and capitalize on market opportunities.

MarketGenics leverages a dedicated industry panel of experts and a comprehensive suite of paid databases to effectively collect, consolidate, and analyze market intelligence.
Our approach has consistently proven to be reliable and effective in generating accurate market insights, identifying key industry trends, and uncovering emerging business opportunities.
Through both primary and secondary research, we capture and analyze critical company-level data such as manufacturing footprints, including technical centers, R&D facilities, sales offices, and headquarters.
Our expert panel further enhances our ability to estimate market size for specific brands based on validated field-level intelligence.
Our data mining techniques incorporate both parametric and non-parametric methods, allowing for structured data collection, sorting, processing, and cleaning.
Demand projections are derived from large-scale data sets analyzed through proprietary algorithms, culminating in robust and reliable market sizing.
Research Approach
The bottom-up approach builds market estimates by starting with the smallest addressable market units and systematically aggregating them to create comprehensive market size projections.
This method begins with specific, granular data points and builds upward to create the complete market landscape.
Customer Analysis → Segmental Analysis → Geographical Analysis
The top-down approach starts with the broadest possible market data and systematically narrows it down through a series of filters and assumptions to arrive at specific market segments or opportunities.
This method begins with the big picture and works downward to increasingly specific market slices.
TAM → SAM → SOM


Research Methods
Desk / Secondary Research
While analysing the market, we extensively study secondary sources, directories, and databases to identify and collect information useful for this technical, market-oriented, and commercial report. Secondary sources that we utilize are not only the public sources, but it is a combination of Open Source, Associations, Paid Databases, MG Repository & Knowledgebase, and others.
- Company websites, annual reports, financial reports, broker reports, and investor presentations
- National government documents, statistical databases and reports
- News articles, press releases and web-casts specific to the companies operating in the market, Magazines, reports, and others
- We gather information from commercial data sources for deriving company specific data such as segmental revenue, share for geography, product revenue, and others
- Internal and external proprietary databases (industry-specific), relevant patent, and regulatory databases
- Governing Bodies, Government Organizations
- Relevant Authorities, Country-specific Associations for Industries
We also employ the model mapping approach to estimate the product level market data through the players' product portfolio
Primary Research
Primary research/ interviews is vital in analyzing the market. Most of the cases involves paid primary interviews. Primary sources include primary interviews through e-mail interactions, telephonic interviews, surveys as well as face-to-face interviews with the different stakeholders across the value chain including several industry experts.
| Type of Respondents | Number of Primaries |
|---|---|
| Tier 2/3 Suppliers | ~20 |
| Tier 1 Suppliers | ~25 |
| End-users | ~25 |
| Industry Expert/ Panel/ Consultant | ~30 |
| Total | ~100 |
MG Knowledgebase
• Repository of industry blog, newsletter and case studies
• Online platform covering detailed market reports, and company profiles
Forecasting Factors and Models
Forecasting Factors
- Historical Trends – Past market patterns, cycles, and major events that shaped how markets behave over time. Understanding past trends helps predict future behavior.
- Industry Factors – Specific characteristics of the industry like structure, regulations, and innovation cycles that affect market dynamics.
- Macroeconomic Factors – Economic conditions like GDP growth, inflation, and employment rates that affect how much money people have to spend.
- Demographic Factors – Population characteristics like age, income, and location that determine who can buy your product.
- Technology Factors – How quickly people adopt new technology and how much technology infrastructure exists.
- Regulatory Factors – Government rules, laws, and policies that can help or restrict market growth.
- Competitive Factors – Analyzing competition structure such as degree of competition and bargaining power of buyers and suppliers.
Forecasting Models / Techniques
Multiple Regression Analysis
- Identify and quantify factors that drive market changes
- Statistical modeling to establish relationships between market drivers and outcomes
Time Series Analysis – Seasonal Patterns
- Understand regular cyclical patterns in market demand
- Advanced statistical techniques to separate trend, seasonal, and irregular components
Time Series Analysis – Trend Analysis
- Identify underlying market growth patterns and momentum
- Statistical analysis of historical data to project future trends
Expert Opinion – Expert Interviews
- Gather deep industry insights and contextual understanding
- In-depth interviews with key industry stakeholders
Multi-Scenario Development
- Prepare for uncertainty by modeling different possible futures
- Creating optimistic, pessimistic, and most likely scenarios
Time Series Analysis – Moving Averages
- Sophisticated forecasting for complex time series data
- Auto-regressive integrated moving average models with seasonal components
Econometric Models
- Apply economic theory to market forecasting
- Sophisticated economic models that account for market interactions
Expert Opinion – Delphi Method
- Harness collective wisdom of industry experts
- Structured, multi-round expert consultation process
Monte Carlo Simulation
- Quantify uncertainty and probability distributions
- Thousands of simulations with varying input parameters
Research Analysis
Our research framework is built upon the fundamental principle of validating market intelligence from both demand and supply perspectives. This dual-sided approach ensures comprehensive market understanding and reduces the risk of single-source bias.
Demand-Side Analysis: We understand end-user/application behavior, preferences, and market needs along with the penetration of the product for specific application.
Supply-Side Analysis: We estimate overall market revenue, analyze the segmental share along with industry capacity, competitive landscape, and market structure.
Validation & Evaluation
Data triangulation is a validation technique that uses multiple methods, sources, or perspectives to examine the same research question, thereby increasing the credibility and reliability of research findings. In market research, triangulation serves as a quality assurance mechanism that helps identify and minimize bias, validate assumptions, and ensure accuracy in market estimates.
- Data Source Triangulation – Using multiple data sources to examine the same phenomenon
- Methodological Triangulation – Using multiple research methods to study the same research question
- Investigator Triangulation – Using multiple researchers or analysts to examine the same data
- Theoretical Triangulation – Using multiple theoretical perspectives to interpret the same data

Custom Market Research Services
We will customise the research for you, in case the report listed above does not meet your requirements.
Get 10% Free Customisation