Recycled Aluminum Alloys Market Size, Share & Trends Analysis Report by Alloy Series/Type (1xxx Series (Pure Aluminum), 2xxx Series (Aluminum-Copper), 3xxx Series (Aluminum-Manganese), 4xxx Series (Aluminum-Silicon), 5xxx Series (Aluminum-Magnesium), 6xxx Series (Aluminum-Magnesium-Silicon), 7xxx Series (Aluminum-Zinc), 8xxx Series (Other Elements)), Source/Scrap Type, Processing Method, Form, Production Capacity (Annual Tonnage), Recycling Rate/Purity Level, Technology, Quality Grade, End-Use Industry, Distribution Channel, and Geography (North America, Europe, Asia Pacific, Middle East, Africa, and South America) – Global Industry Data, Trends, and Forecasts, 2026–2035
|
|
|
Segmental Data Insights |
|
|
Demand Trends |
|
|
Competitive Landscape |
|
|
Strategic Development |
|
|
Future Outlook & Opportunities |
|
Recycled Aluminum Alloys Market Size, Share, and Growth
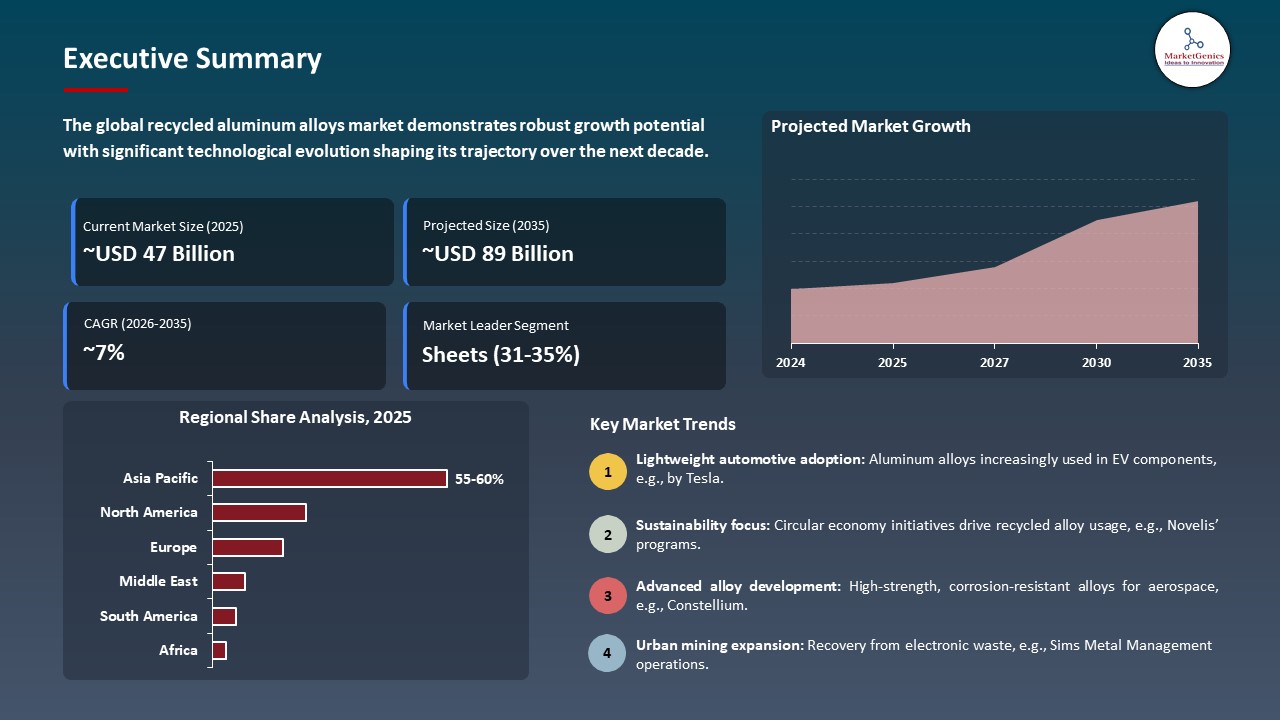
The global recycled aluminum alloys market is experiencing robust growth, with its estimated value of USD 47.3 billion in the year 2025 and USD 88.8 billion by the period 2035, registering a CAGR of 6.5%, during the forecast period. The global recycled aluminum alloys market is primarily driven by rising sustainability targets, increasing adoption of circular economy practices, and strong demand from automotive, packaging, and construction industries seeking low-carbon materials. Stringent environmental regulations, cost advantages over primary aluminum, and improved recycling technologies further accelerate market growth.
Michael Hahne, Vice President and General Manager, Automotive, Novelis Europe said, “Producing aluminium from 100% end-of-life vehicle scrap is not only a testament to our dedication to a circular future for aluminium and enhancing the supply of the critical material. It also is a groundbreaking achievement showcasing the potential for significant environmental benefits and the ability to meet the high-performance demands of modern automotive production.”
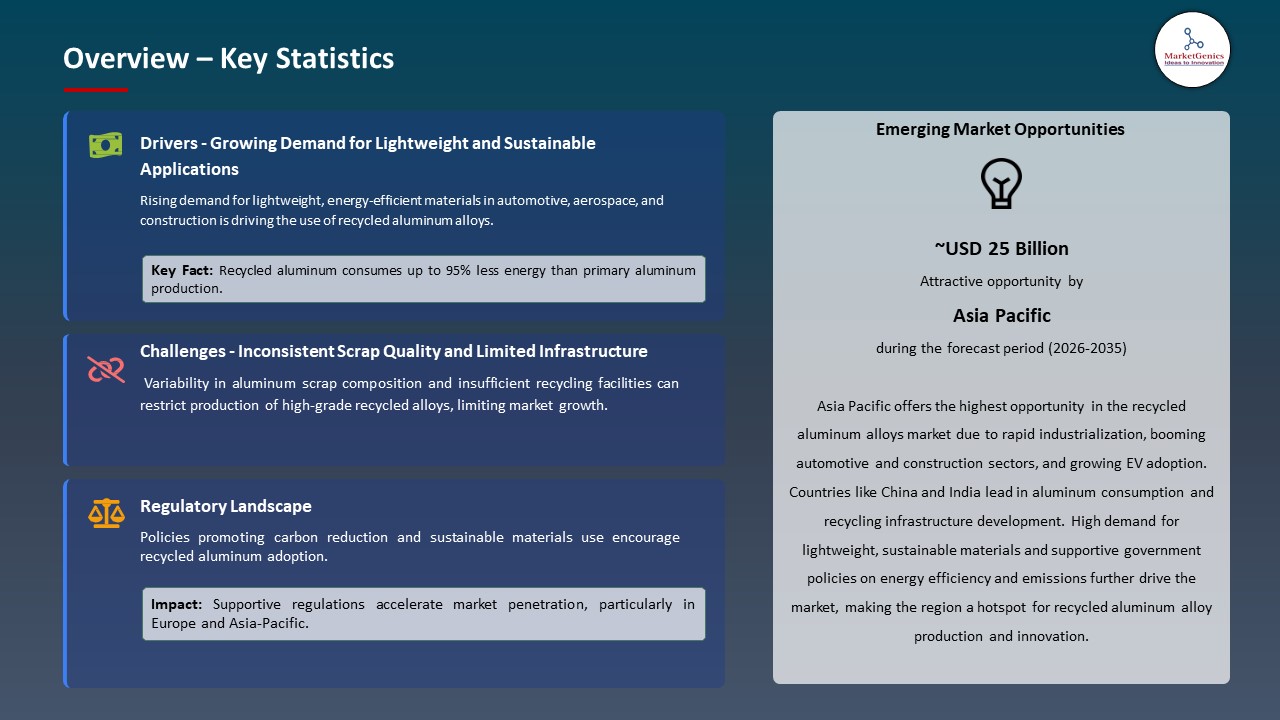
The global recycled aluminum alloys market growth due to the increasing sustainability and energy-efficiency demands because recycled aluminum production uses almost no energy compared to the primary aluminum production, and manufacturers can save a lot of operational costs and carbon emissions. As an example, in 2025, Norsk Hydro ASA provides low-carbon recycled aluminum (high scrap content) to Mercedes Benz to assist cut CO 2 emissions of its new models of EVs by approximately 40 percent. The trend is increasing the transition to circular patterns of production and enhancing demand in the long term in the recycled aluminum alloys in major industries.
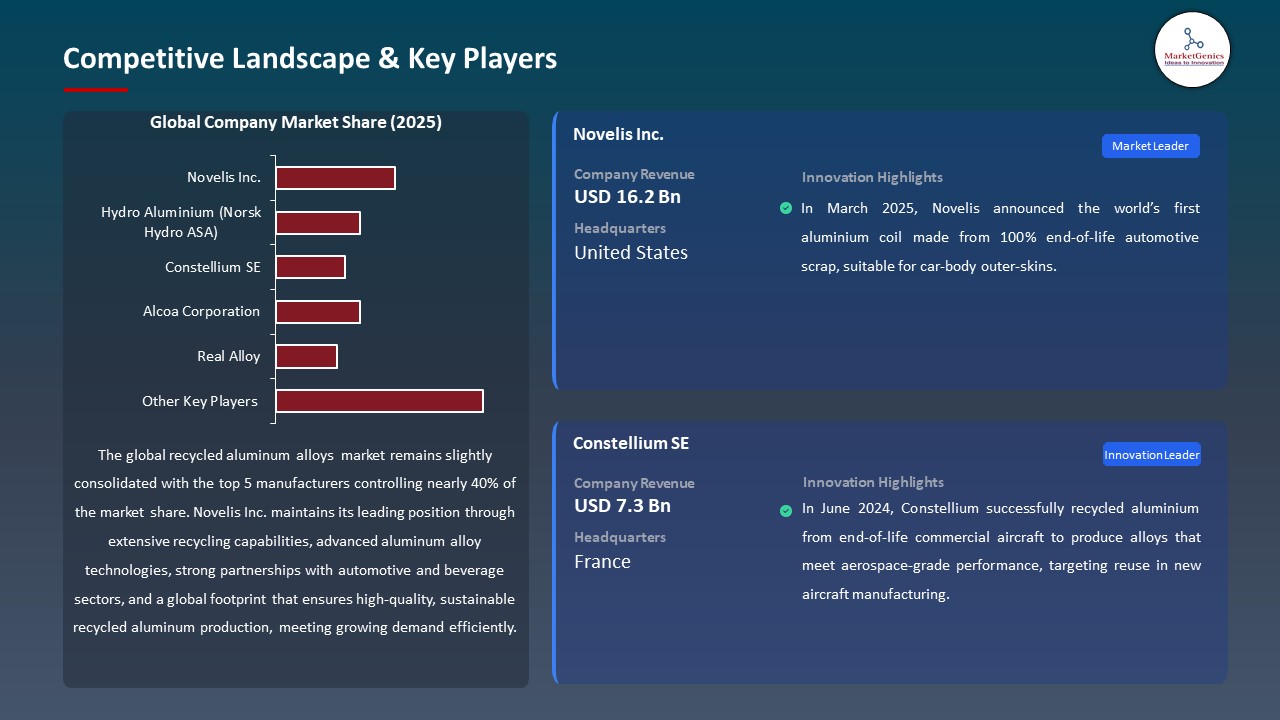
Moreover, the recycled aluminum alloys market growth is reinforced by the increasing demand among the automotive and EV producers on lightweight and high-performance materials because the OEMs use recycled alloys more and more extensively in body frameworks, battery enclosures and in other significant parts as the manufacturers strive to fulfill the high efficiency, safety, and emission requirements. For instance, in March 2025 Novelis launched the first ever aluminum coil construction created using 100% recycled end of life automotive scrap, even on car-body outer skins. This is increasing the pace of OEM uptake of high-recycled content alloys and solidifying the transition to low-carbon automotive manufacturing.
Adjacent opportunities for the recycled aluminum alloys market include lightweight automotive components, electric vehicle battery enclosures, sustainable construction materials, high-performance packaging solutions, and industrial machinery parts. These segments leverage recycled aluminum’s strength, durability, and low-carbon footprint, offering manufacturers avenues for growth and innovation. The growth into these countries increases its demand and contributes to the growth of the market in the long-term.
Recycled Aluminum Alloys Market Dynamics and Trends
Driver: Technological Innovation and Advanced Recycling Processes as a Growth Catalyst
-
The global recycled aluminum alloys market growth is driven by technological innovation, since the advanced sorting, melting, and refining processes, the better the quality, yield, and consistency of scrap, and the better the high-performance alloys that are produced can be used in automotive, aerospace, and industrial markets.
- For instance, in October 2024, Novelis signed a three-year contract with TSR Recycling to obtain 75,000 tonnes of pre-sorted end-of-life aluminum scrap each year to stabilize the supply of low-carbon automotive sheet. This strategic partnership enhances the reliability of supply-chains and speeds up the use of recycled aluminum alloys of high-performance and sustainability.
- Additionally, the market is driven by the increased recycling technologies that will minimize the energy usage and manufacturing expenses that will enable manufacturers to produce cost-effective, sustainable, aluminum products and satisfy the strict industry standards and the OEM performance specifications.
- These technological improvements and process efficiencies allow increasing cost-efficiency, sustainability, and adoption of these technologies by industries contributing to the long-term growth in the recycled aluminum alloys market.
Restraint: Supply‑Chain Constraint from Scrap Availability and Quality Variation
-
The global recycled aluminum alloys market experiences high levels of supply chain limitations because of the variability and the scarcity of quality aluminum scrap. Unstable scrap composition may cause impurities like iron or copper which adversely impact on alloy performance especially in high-strength automotive, aerospace, and industrial applications.
- Additionally, the supply of scrap may vary regionally due to collection inefficiencies, trade limitations or end-of-life material competition and disrupt production schedules, also making it more expensive.
- In addition, manufacturers need to invest in superior sorting, pre-treatment and quality control technologies as a way of alleviating these issues. The shortcoming restricts the full capacity of recycled aluminum use regardless of the increasing demand, and supply-chain stability becomes a matter of serious concern in the context of market expansion and affects decisions on production capacity increase.
- These supply-chain problems may limit the growth of the market, and that is why, good scrap sourcing and the future-advanced processing will be used in order to maintain the same production of the high quality recycled aluminum alloys.
Opportunity: Expansion in Renewable Energy Infrastructure Components
-
The global recycled aluminum alloys market growth due to the rising renewable energy infrastructure because aluminum is light weight, non-corrosive and strong to be used in solar panels, wind turbine parts and storage of energy. For instance, in 2024 companies like Speira and Bayards started promoting aluminum as a more sustainable substitute to conventional materials (such as glass-fibre composites or steel) to use in contemporary wind-turbine nacelles.
- Additionally, the growing investment in green energy projects globally stimulates the demand of recycled aluminum as manufacturers can provide sustainable, high-performance materials which meet the requirements of environmental regulations and carbon reduction policies. The trend encourages more widespread use of recycled aluminum which will facilitate sustainable production and enable faster movement towards low-carbon, energy efficient industrial solutions.
- These contribute to the increased use of recycled aluminum in the renewable-energy industries and to create a growing market and underpin its contribution to sustainable, low-carbon industrial development.
Key Trend: Development of Sorting Technologies for Alloy Segregation
-
The global recycled aluminum alloys market benefits from the innovation of sophisticated sorting technology that allows accurate separation of aluminum alloys according to their composition and quality. High-end sorting methods such as sensor detection, eddy current separation and X-ray analysis can be used to perform accurate scrap segregation to minimize contamination and provide recycled alloys within automotive, aerospace and industrial performance expectations.
- For instance, in 2025, TOMRA Recycling introduced its deep-learning-based sorting system GAINnext of aluminum scrap that allows sorting mixed scrap into separate alloy types with high accuracy and rapidity to provide greatly enhanced purity of recycled feedstock. These inventions enhance recycled aluminum yield and quality, minimize impurities and make it suitable to use in high-performance applications enhancing market growth.
- Additionally, such technologies increase the reliability and mechanical properties of recycled aluminum by reducing the level of alloy dilution and tramp-elements concentration. A better sorting reduces the cost of reprocessing, increases the yield, and recycles aluminum competitiveness, leading to the expanded adoption and market expansion.
- These innovations in sorting technology enhance efficiency of supply chains, enhance quality of products and increase recycled aluminum usage in high-performance industries, which leads to sustainable growth in the market.
Recycled-Aluminum-Alloys-Market Analysis and Segmental Data
Sheets Dominate Global Recycled Aluminum Alloys Market
-
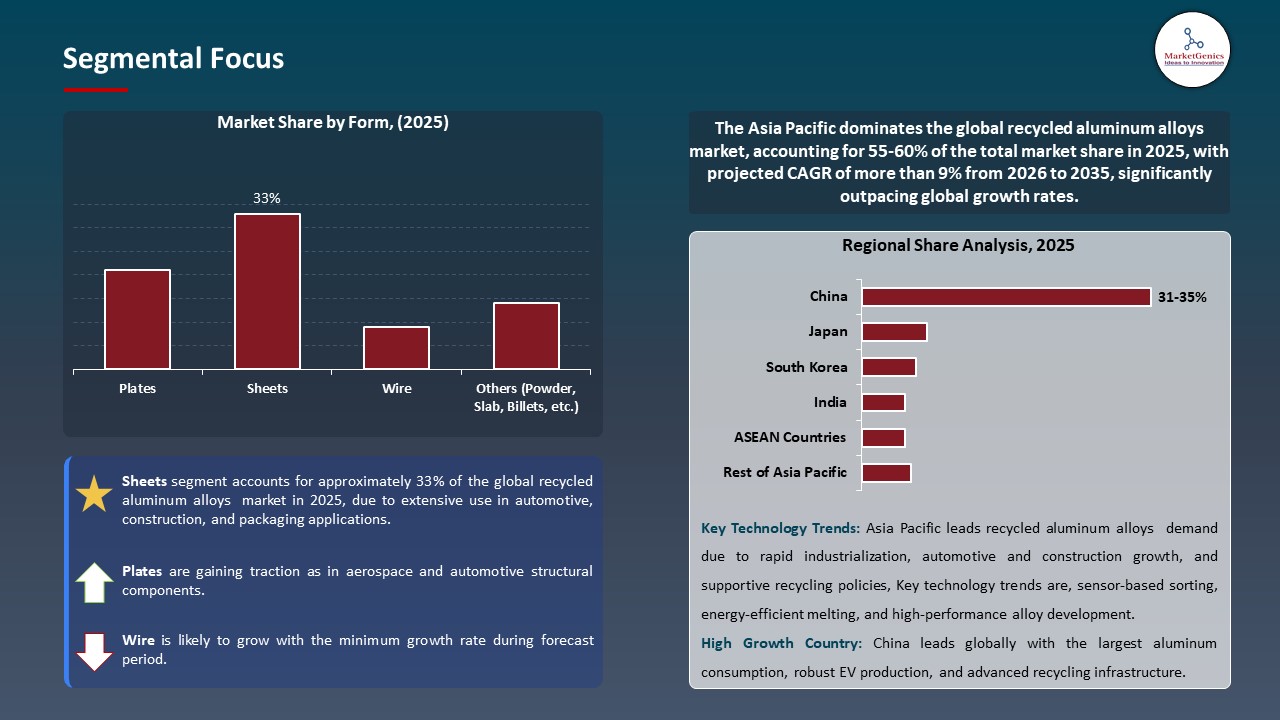
The sheets segment dominates the global recycled aluminum alloys market due to its combined flexibility, strength to weight ratio and its ability to be recycled which make it suitable to high volume use in the automotive, construction, packaging, and industrial manufacturing. With the movement of vehicles towards lightweight and more fuel-efficient and more emission-focused designs (and EVs, in particular), the demand in sheet-based body panels, battery cases, and structural parts skyrockets.
- For instance, in June 2025, Novelis collaborated with The Future is NEUTRAL to increase the manufacturing of circular automotive-grade aluminum sheet with a recycled content over 95% with over 50% scrap content being end-of-life and vehicle scrap.
- Moreover, recycled-content sheets are particularly appealing in that they fulfill sustainability and regulatory requirements and provide the performance sought by the OEMs and manufacturers. This dual-fold gain performance and environmental compliance leads to their increasing usage in preference to ingots or casting alloys.
- The development enhances the use of recycled-content aluminum sheets as alternatives to virgin materials as the confidence builds, which increases their acceptance in high-volume automotive and industrial processes globally.
Asia Pacific Leads Global Recycled Aluminum Alloys Market Demand
-
Asia Pacific leads the recycled aluminum alloys market, due to the high rates of industrialization, urbanization and massive construction of infrastructure in countries like China, India, Japan and Southeast Asia is creating high quantities of scrap and recycled-aluminum construction, automotive, electronics and manufacturing industries demand.
- For instance, in 2025, the UACJ Corporation in Japan opened a new plant producing high-quality recycled aluminum sheets to use in EV battery cases and vehicle body panels, as the scrap was provided by both local and foreign sources. These efforts bolster the supply chain of Asia-Pacific to maintain high levels of recycled aluminum in the automotive, construction, and industrial industries worldwide.
- Additionally, Asia‑Pacific’s market leadership is augmented with the active governmental policies in favor of low-carbon and sustainable production. Countries such as China, India, Japan, and South Korea are also encouraging the application of recycled as well as low-carbon aluminum to meet the climate targets, thus hastening the use of secondary aluminum in major industrial processes.
- The combination of all these makes Asia-Pacific the leading force behind recycled-aluminum demand across the world, increasing supply-chain resilience, sustainable manufacturing, and faster adoption in high-growth markets in the automotive, construction and industrial sectors.
Recycled-Aluminum-Alloys-Market Ecosystem
The global recycled aluminum alloys market is slightly consolidated, with high concentration among key players such as Novelis Inc., Hydro Aluminium (Norsk Hydro ASA), Constellium SE, Alcoa Corporation, and Real Alloy, holding significant market share. These companies are dominant due to their large production strengths, recycling technologies, built-in supply chains, as well as, strategic alliances that allow them to fulfill the increasing demand in the automotive, aerospace, construction, and industrial industries, and promote innovation and sustainability in recycled aluminum products.
For instance, in 2025, Hindalco Industries Limited (the parent of Novelis) announced as the global sustainability rankings leaders and even promised to increase downstream aluminium capacity strengthening the global impacts of the group in low carbon recycled processed use of aluminum.
Recent Development and Strategic Overview:
-
In June 2025, Novelis renewed a long-term supply contract with VELUX Group to deliver low-carbon high-recycled-content flat-rolled aluminum to roof windows and roof-accessory applications demonstrating the increased acceptance of recycled aluminum in other building and construction applications than automotive.
- In July 2024, Novelis Inc. invested around 90 million in recycling of used-beverage-cans (UBC) at the Latchford, UK plant, with a practical capacity of up to 85kt/per-year through implementation of new shredding, sorting, de-coating and melting processes.
Report Scope
|
Detail |
|
|
Market Size in 2025 |
USD 47.3 Bn |
|
Market Forecast Value in 2035 |
USD 88.8 Bn |
|
Growth Rate (CAGR) |
6.5% |
|
Forecast Period |
2026 – 2035 |
|
Historical Data Available for |
2021 – 2024 |
|
Market Size Units |
US$ Billion for Value MMT for Volume |
|
Report Format |
Electronic (PDF) + Excel |
|
North America |
Europe |
Asia Pacific |
Middle East |
Africa |
South America |
|
|
|
|
|
|
|
Companies Covered |
|||||
|
|
|
|
|
|
Recycled-Aluminum-Alloys-Market Segmentation and Highlights
|
Segment |
Sub-segment |
|
Recycled Aluminum Alloys Market, By Alloy Series/Type |
|
|
Recycled Aluminum Alloys Market, By Source/Scrap Type |
|
|
Recycled Aluminum Alloys Market, By Processing Method |
|
|
Recycled Aluminum Alloys Market, By Form |
|
|
Recycled Aluminum Alloys Market, By Production Capacity (Annual Tonnage)
|
|
|
Recycled Aluminum Alloys Market, By Recycling Rate/Purity Level
|
|
|
Recycled Aluminum Alloys Market, By Technology
|
|
|
Recycled Aluminum Alloys Market, By Quality Grade
|
|
|
Recycled Aluminum Alloys Market, By End-Use Industry
|
|
|
Recycled Aluminum Alloys Market, By Distribution Channel
|
|
Frequently Asked Questions
Table of Contents
- 1. Research Methodology and Assumptions
- 1.1. Definitions
- 1.2. Research Design and Approach
- 1.3. Data Collection Methods
- 1.4. Base Estimates and Calculations
- 1.5. Forecasting Models
- 1.5.1. Key Forecast Factors & Impact Analysis
- 1.6. Secondary Research
- 1.6.1. Open Sources
- 1.6.2. Paid Databases
- 1.6.3. Associations
- 1.7. Primary Research
- 1.7.1. Primary Sources
- 1.7.2. Primary Interviews with Stakeholders across Ecosystem
- 2. Executive Summary
- 2.1. Global Recycled Aluminum Alloys Market Outlook
- 2.1.1. Recycled Aluminum Alloys Market Size (Volume - MMT and Value - US$ Bn), and Forecasts, 2021-2035
- 2.1.2. Compounded Annual Growth Rate Analysis
- 2.1.3. Growth Opportunity Analysis
- 2.1.4. Segmental Share Analysis
- 2.1.5. Geographical Share Analysis
- 2.2. Market Analysis and Facts
- 2.3. Supply-Demand Analysis
- 2.4. Competitive Benchmarking
- 2.5. Go-to- Market Strategy
- 2.5.1. Customer/ End-use Industry Assessment
- 2.5.2. Growth Opportunity Data, 2026-2035
- 2.5.2.1. Regional Data
- 2.5.2.2. Country Data
- 2.5.2.3. Segmental Data
- 2.5.3. Identification of Potential Market Spaces
- 2.5.4. GAP Analysis
- 2.5.5. Potential Attractive Price Points
- 2.5.6. Prevailing Market Risks & Challenges
- 2.5.7. Preferred Sales & Marketing Strategies
- 2.5.8. Key Recommendations and Analysis
- 2.5.9. A Way Forward
- 2.1. Global Recycled Aluminum Alloys Market Outlook
- 3. Industry Data and Premium Insights
- 3.1. Global Chemicals & Materials Industry Overview, 2025
- 3.1.1. Chemicals & Materials Industry Ecosystem Analysis
- 3.1.2. Key Trends for Chemicals & Materials Industry
- 3.1.3. Regional Distribution for Chemicals & Materials Industry
- 3.2. Supplier Customer Data
- 3.3. Technology Roadmap and Developments
- 3.4. Trade Analysis
- 3.4.1. Import & Export Analysis, 2025
- 3.4.2. Top Importing Countries
- 3.4.3. Top Exporting Countries
- 3.5. Trump Tariff Impact Analysis
- 3.5.1. Manufacturer
- 3.5.1.1. Based on the component & Raw material
- 3.5.2. Supply Chain
- 3.5.3. End Consumer
- 3.5.1. Manufacturer
- 3.6. Raw Material Analysis
- 3.1. Global Chemicals & Materials Industry Overview, 2025
- 4. Market Overview
- 4.1. Market Dynamics
- 4.1.1. Drivers
- 4.1.1.1. Energy‑efficiency and cost savings: recycled aluminum alloys require far less energy to produce than primary aluminum
- 4.1.1.2. Growing demand in lightweight, sustainable applications (automotive, EVs, construction)
- 4.1.1.3. Sustainability and circular‑economy initiatives driving adoption of recycled content
- 4.1.2. Restraints
- 4.1.2.1. Inconsistent scrap quality and contamination limiting production of high-grade alloys
- 4.1.2.2. Inefficient scrap collection and limited recycling infrastructure
- 4.1.1. Drivers
- 4.2. Key Trend Analysis
- 4.3. Regulatory Framework
- 4.3.1. Key Regulations, Norms, and Subsidies, by Key Countries
- 4.3.2. Tariffs and Standards
- 4.3.3. Impact Analysis of Regulations on the Market
- 4.4. Value Chain Analysis
- 4.4.1. Scrap Collection & Sourcing
- 4.4.2. Shredding & Size Reduction
- 4.4.3. Distribution & End-Use Application
- 4.4.4. Recycling Feedback Loop
- 4.5. Cost Structure Analysis
- 4.5.1. Parameter’s Share for Cost Associated
- 4.5.2. COGP vs COGS
- 4.5.3. Profit Margin Analysis
- 4.6. Pricing Analysis
- 4.6.1. Regional Pricing Analysis
- 4.6.2. Segmental Pricing Trends
- 4.6.3. Factors Influencing Pricing
- 4.7. Porter’s Five Forces Analysis
- 4.8. PESTEL Analysis
- 4.9. Global Recycled Aluminum Alloys Market Demand
- 4.9.1. Historical Market Size – Volume (MMT) and Value (US$ Bn), 2020-2024
- 4.9.2. Current and Future Market Size – Volume (MMT) and Value (US$ Bn), 2026–2035
- 4.9.2.1. Y-o-Y Growth Trends
- 4.9.2.2. Absolute $ Opportunity Assessment
- 4.1. Market Dynamics
- 5. Competition Landscape
- 5.1. Competition structure
- 5.1.1. Fragmented v/s consolidated
- 5.2. Company Share Analysis, 2025
- 5.2.1. Global Company Market Share
- 5.2.2. By Region
- 5.2.2.1. North America
- 5.2.2.2. Europe
- 5.2.2.3. Asia Pacific
- 5.2.2.4. Middle East
- 5.2.2.5. Africa
- 5.2.2.6. South America
- 5.3. Product Comparison Matrix
- 5.3.1. Specifications
- 5.3.2. Market Positioning
- 5.3.3. Pricing
- 5.1. Competition structure
- 6. Global Recycled Aluminum Alloys Market Analysis, by Alloy Series/Type
- 6.1. Key Segment Analysis
- 6.2. Recycled Aluminum Alloys Market Size (Volume - MMT and Value - US$ Bn), Analysis, and Forecasts, by Alloy Series/Type, 2021-2035
- 6.2.1. 1xxx Series (Pure Aluminum)
- 6.2.2. 2xxx Series (Aluminum-Copper)
- 6.2.3. 3xxx Series (Aluminum-Manganese)
- 6.2.4. 4xxx Series (Aluminum-Silicon)
- 6.2.5. 5xxx Series (Aluminum-Magnesium)
- 6.2.6. 6xxx Series (Aluminum-Magnesium-Silicon)
- 6.2.7. 7xxx Series (Aluminum-Zinc)
- 6.2.8. 8xxx Series (Other Elements)
- 7. Global Recycled Aluminum Alloys Market Analysis, by Source/Scrap Type
- 7.1. Key Segment Analysis
- 7.2. Recycled Aluminum Alloys Market Size (Volume - MMT and Value - US$ Bn), Analysis, and Forecasts, by Source/Scrap Type, 2021-2035
- 7.2.1. Post-Consumer Scrap
- 7.2.1.1. End-of-life vehicles
- 7.2.1.2. Building and construction demolition
- 7.2.1.3. Used beverage cans (UBC)
- 7.2.1.4. Electronic waste
- 7.2.1.5. Consumer goods
- 7.2.1.6. Others
- 7.2.2. Post-Industrial Scrap (New Scrap)
- 7.2.2.1. Manufacturing off-cuts
- 7.2.2.2. Process scrap
- 7.2.2.3. Defective products
- 7.2.2.4. Turnings and borings
- 7.2.2.5. Others
- 7.2.1. Post-Consumer Scrap
- 8. Global Recycled Aluminum Alloys Market Analysis, by Processing Method
- 8.1. Key Segment Analysis
- 8.2. Recycled Aluminum Alloys Market Size (Volume - MMT and Value - US$ Bn), Analysis, and Forecasts, by Processing Method, 2021-2035
- 8.2.1. Primary Re-melting
- 8.2.2. Secondary Smelting
- 8.2.3. Direct Re-melting
- 8.2.4. Decoating Process
- 8.2.5. Salt Slag Recycling
- 8.2.6. Dross Processing
- 9. Global Recycled Aluminum Alloys Market Analysis, by Form
- 9.1. Key Segment Analysis
- 9.2. Recycled Aluminum Alloys Market Size (Volume - MMT and Value - US$ Bn), Analysis, and Forecasts, by Form, 2021-2035
- 9.2.1. Ingots
- 9.2.2. Billets
- 9.2.3. Plates
- 9.2.4. Sheets
- 9.2.5. Foils
- 9.2.6. Rods and Bars
- 9.2.7. Wire
- 9.2.8. Others (Powder, Slab, Billets, etc.)
- 10. Global Recycled Aluminum Alloys Market Analysis, by Production Capacity (Annual Tonnage)
- 10.1. Key Segment Analysis
- 10.2. Recycled Aluminum Alloys Market Size (Volume - MMT and Value - US$ Bn), Analysis, and Forecasts, by Production Capacity (Annual Tonnage), 2021-2035
- 10.2.1. Less than 10,000 tons
- 10.2.2. 10,000 - 50,000 tons
- 10.2.3. 50,000 - 100,000 tons
- 10.2.4. Above 100,000 tons
- 11. Global Recycled Aluminum Alloys Market Analysis, by Recycling Rate/Purity Level
- 11.1. Key Segment Analysis
- 11.2. Recycled Aluminum Alloys Market Size (Volume - MMT and Value - US$ Bn), Analysis, and Forecasts, by Recycling Rate/Purity Level, 2021-2035
- 11.2.1. High Purity (>99%)
- 11.2.2. Standard Purity (95-99%)
- 11.2.3. Commercial Grade (90-95%)
- 11.2.4. Low Grade (<90%)
- 12. Global Recycled Aluminum Alloys Market Analysis, by Technology
- 12.1. Key Segment Analysis
- 12.2. Recycled Aluminum Alloys Market Size (Volume - MMT and Value - US$ Bn), Analysis, and Forecasts, by Technology, 2021-2035
- 12.2.1. Conventional Furnace Technology
- 12.2.2. Rotary Furnace
- 12.2.3. Reverberatory Furnace
- 12.2.4. Induction Furnace
- 12.2.5. Advanced Sorting Technology
- 12.2.5.1. Laser-induced breakdown spectroscopy (LIBS)
- 12.2.5.2. X-ray fluorescence (XRF)
- 12.2.5.3. Eddy current separation
- 12.2.5.4. Others
- 13. Global Recycled Aluminum Alloys Market Analysis, by Quality Grade
- 13.1. Key Segment Analysis
- 13.2. Recycled Aluminum Alloys Market Size (Volume - MMT and Value - US$ Bn), Analysis, and Forecasts, by Quality Grade, 2021-2035
- 13.2.1. Prime Quality
- 13.2.2. Secondary Quality
- 13.2.3. Tertiary Quality
- 13.2.4. Mixed Grade
- 14. Global Recycled Aluminum Alloys Market Analysis, by End-Use Industry
- 14.1. Key Segment Analysis
- 14.2. Recycled Aluminum Alloys Market Size (Volume - MMT and Value - US$ Bn), Analysis, and Forecasts, by End-Use Industry, 2021-2035
- 14.2.1. Automotive
- 14.2.2. Building & Construction
- 14.2.3. Electrical & Electronics
- 14.2.4. Aerospace & Defense
- 14.2.5. Consumer Goods
- 14.2.6. Packaging
- 14.2.7. Industrial Machinery & Equipment
- 14.2.8. Marine & Shipbuilding
- 14.2.9. Railway & Transportation
- 14.2.10. Power Generation & Energy
- 14.2.11. Others
- 15. Global Recycled Aluminum Alloys Market Analysis and Forecasts, by Distribution Channel
- 15.1. Key Findings
- 15.2. Recycled Aluminum Alloys Market Size (Volume - MMT and Value - US$ Bn), Analysis, and Forecasts, by Distribution Channel, 2021-2035
- 15.2.1. Direct Sales
- 15.2.2. Distributors
- 15.2.3. Online Platforms
- 15.2.4. Trading Companies
- 16. Global Recycled Aluminum Alloys Market Analysis and Forecasts, by Region
- 16.1. Key Findings
- 16.2. Recycled Aluminum Alloys Market Size (Volume - MMT and Value - US$ Bn), Analysis, and Forecasts, by Region, 2021-2035
- 16.2.1. North America
- 16.2.2. Europe
- 16.2.3. Asia Pacific
- 16.2.4. Middle East
- 16.2.5. Africa
- 16.2.6. South America
- 17. North America Recycled Aluminum Alloys Market Analysis
- 17.1. Key Segment Analysis
- 17.2. Regional Snapshot
- 17.3. North America Recycled Aluminum Alloys Market Size (Volume - MMT and Value - US$ Bn), Analysis, and Forecasts, 2021-2035
- 17.3.1. Alloy Series/Type
- 17.3.2. Source/Scrap Type
- 17.3.3. Processing Method
- 17.3.4. Form
- 17.3.5. Production Capacity (Annual Tonnage)
- 17.3.6. Recycling Rate/Purity Level
- 17.3.7. Technology
- 17.3.8. Quality Grade
- 17.3.9. End-Use Industry
- 17.3.10. Distribution Channel
- 17.3.11. Country
- 17.3.11.1. USA
- 17.3.11.2. Canada
- 17.3.11.3. Mexico
- 17.4. USA Recycled Aluminum Alloys Market
- 17.4.1. Country Segmental Analysis
- 17.4.2. Alloy Series/Type
- 17.4.3. Source/Scrap Type
- 17.4.4. Processing Method
- 17.4.5. Form
- 17.4.6. Production Capacity (Annual Tonnage)
- 17.4.7. Recycling Rate/Purity Level
- 17.4.8. Technology
- 17.4.9. Quality Grade
- 17.4.10. End-Use Industry
- 17.4.11. Distribution Channel
- 17.5. Canada Recycled Aluminum Alloys Market
- 17.5.1. Country Segmental Analysis
- 17.5.2. Alloy Series/Type
- 17.5.3. Source/Scrap Type
- 17.5.4. Processing Method
- 17.5.5. Form
- 17.5.6. Production Capacity (Annual Tonnage)
- 17.5.7. Recycling Rate/Purity Level
- 17.5.8. Technology
- 17.5.9. Quality Grade
- 17.5.10. End-Use Industry
- 17.5.11. Distribution Channel
- 17.6. Mexico Recycled Aluminum Alloys Market
- 17.6.1. Country Segmental Analysis
- 17.6.2. Alloy Series/Type
- 17.6.3. Source/Scrap Type
- 17.6.4. Processing Method
- 17.6.5. Form
- 17.6.6. Production Capacity (Annual Tonnage)
- 17.6.7. Recycling Rate/Purity Level
- 17.6.8. Technology
- 17.6.9. Quality Grade
- 17.6.10. End-Use Industry
- 17.6.11. Distribution Channel
- 18. Europe Recycled Aluminum Alloys Market Analysis
- 18.1. Key Segment Analysis
- 18.2. Regional Snapshot
- 18.3. Europe Recycled Aluminum Alloys Market Size (Volume - MMT and Value - US$ Bn), Analysis, and Forecasts, 2021-2035
- 18.3.1. Alloy Series/Type
- 18.3.2. Source/Scrap Type
- 18.3.3. Processing Method
- 18.3.4. Form
- 18.3.5. Production Capacity (Annual Tonnage)
- 18.3.6. Recycling Rate/Purity Level
- 18.3.7. Technology
- 18.3.8. Quality Grade
- 18.3.9. End-Use Industry
- 18.3.10. Distribution Channel
- 18.3.11. Country
- 18.3.11.1. Germany
- 18.3.11.2. United Kingdom
- 18.3.11.3. France
- 18.3.11.4. Italy
- 18.3.11.5. Spain
- 18.3.11.6. Netherlands
- 18.3.11.7. Nordic Countries
- 18.3.11.8. Poland
- 18.3.11.9. Russia & CIS
- 18.3.11.10. Rest of Europe
- 18.4. Germany Recycled Aluminum Alloys Market
- 18.4.1. Country Segmental Analysis
- 18.4.2. Alloy Series/Type
- 18.4.3. Source/Scrap Type
- 18.4.4. Processing Method
- 18.4.5. Form
- 18.4.6. Production Capacity (Annual Tonnage)
- 18.4.7. Recycling Rate/Purity Level
- 18.4.8. Technology
- 18.4.9. Quality Grade
- 18.4.10. End-Use Industry
- 18.4.11. Distribution Channel
- 18.5. United Kingdom Recycled Aluminum Alloys Market
- 18.5.1. Country Segmental Analysis
- 18.5.2. Alloy Series/Type
- 18.5.3. Source/Scrap Type
- 18.5.4. Processing Method
- 18.5.5. Form
- 18.5.6. Production Capacity (Annual Tonnage)
- 18.5.7. Recycling Rate/Purity Level
- 18.5.8. Technology
- 18.5.9. Quality Grade
- 18.5.10. End-Use Industry
- 18.5.11. Distribution Channel
- 18.6. France Recycled Aluminum Alloys Market
- 18.6.1. Country Segmental Analysis
- 18.6.2. Alloy Series/Type
- 18.6.3. Source/Scrap Type
- 18.6.4. Processing Method
- 18.6.5. Form
- 18.6.6. Production Capacity (Annual Tonnage)
- 18.6.7. Recycling Rate/Purity Level
- 18.6.8. Technology
- 18.6.9. Quality Grade
- 18.6.10. End-Use Industry
- 18.6.11. Distribution Channel
- 18.7. Italy Recycled Aluminum Alloys Market
- 18.7.1. Country Segmental Analysis
- 18.7.2. Alloy Series/Type
- 18.7.3. Source/Scrap Type
- 18.7.4. Processing Method
- 18.7.5. Form
- 18.7.6. Production Capacity (Annual Tonnage)
- 18.7.7. Recycling Rate/Purity Level
- 18.7.8. Technology
- 18.7.9. Quality Grade
- 18.7.10. End-Use Industry
- 18.7.11. Distribution Channel
- 18.8. Spain Recycled Aluminum Alloys Market
- 18.8.1. Country Segmental Analysis
- 18.8.2. Alloy Series/Type
- 18.8.3. Source/Scrap Type
- 18.8.4. Processing Method
- 18.8.5. Form
- 18.8.6. Production Capacity (Annual Tonnage)
- 18.8.7. Recycling Rate/Purity Level
- 18.8.8. Technology
- 18.8.9. Quality Grade
- 18.8.10. End-Use Industry
- 18.8.11. Distribution Channel
- 18.9. Netherlands Recycled Aluminum Alloys Market
- 18.9.1. Country Segmental Analysis
- 18.9.2. Alloy Series/Type
- 18.9.3. Source/Scrap Type
- 18.9.4. Processing Method
- 18.9.5. Form
- 18.9.6. Production Capacity (Annual Tonnage)
- 18.9.7. Recycling Rate/Purity Level
- 18.9.8. Technology
- 18.9.9. Quality Grade
- 18.9.10. End-Use Industry
- 18.9.11. Distribution Channel
- 18.10. Nordic Countries Recycled Aluminum Alloys Market
- 18.10.1. Country Segmental Analysis
- 18.10.2. Alloy Series/Type
- 18.10.3. Source/Scrap Type
- 18.10.4. Processing Method
- 18.10.5. Form
- 18.10.6. Production Capacity (Annual Tonnage)
- 18.10.7. Recycling Rate/Purity Level
- 18.10.8. Technology
- 18.10.9. Quality Grade
- 18.10.10. End-Use Industry
- 18.10.11. Distribution Channel
- 18.11. Poland Recycled Aluminum Alloys Market
- 18.11.1. Country Segmental Analysis
- 18.11.2. Alloy Series/Type
- 18.11.3. Source/Scrap Type
- 18.11.4. Processing Method
- 18.11.5. Form
- 18.11.6. Production Capacity (Annual Tonnage)
- 18.11.7. Recycling Rate/Purity Level
- 18.11.8. Technology
- 18.11.9. Quality Grade
- 18.11.10. End-Use Industry
- 18.11.11. Distribution Channel
- 18.12. Russia & CIS Recycled Aluminum Alloys Market
- 18.12.1. Country Segmental Analysis
- 18.12.2. Alloy Series/Type
- 18.12.3. Source/Scrap Type
- 18.12.4. Processing Method
- 18.12.5. Form
- 18.12.6. Production Capacity (Annual Tonnage)
- 18.12.7. Recycling Rate/Purity Level
- 18.12.8. Technology
- 18.12.9. Quality Grade
- 18.12.10. End-Use Industry
- 18.12.11. Distribution Channel
- 18.13. Rest of Europe Recycled Aluminum Alloys Market
- 18.13.1. Country Segmental Analysis
- 18.13.2. Alloy Series/Type
- 18.13.3. Source/Scrap Type
- 18.13.4. Processing Method
- 18.13.5. Form
- 18.13.6. Production Capacity (Annual Tonnage)
- 18.13.7. Recycling Rate/Purity Level
- 18.13.8. Technology
- 18.13.9. Quality Grade
- 18.13.10. End-Use Industry
- 18.13.11. Distribution Channel
- 19. Asia Pacific Recycled Aluminum Alloys Market Analysis
- 19.1. Key Segment Analysis
- 19.2. Regional Snapshot
- 19.3. Asia Pacific Recycled Aluminum Alloys Market Size (Volume - MMT and Value - US$ Bn), Analysis, and Forecasts, 2021-2035
- 19.3.1. Alloy Series/Type
- 19.3.2. Source/Scrap Type
- 19.3.3. Processing Method
- 19.3.4. Form
- 19.3.5. Production Capacity (Annual Tonnage)
- 19.3.6. Recycling Rate/Purity Level
- 19.3.7. Technology
- 19.3.8. Quality Grade
- 19.3.9. End-Use Industry
- 19.3.10. Distribution Channel
- 19.3.11. Country
- 19.3.11.1. China
- 19.3.11.2. India
- 19.3.11.3. Japan
- 19.3.11.4. South Korea
- 19.3.11.5. Australia and New Zealand
- 19.3.11.6. Indonesia
- 19.3.11.7. Malaysia
- 19.3.11.8. Thailand
- 19.3.11.9. Vietnam
- 19.3.11.10. Rest of Asia Pacific
- 19.4. China Recycled Aluminum Alloys Market
- 19.4.1. Country Segmental Analysis
- 19.4.2. Alloy Series/Type
- 19.4.3. Source/Scrap Type
- 19.4.4. Processing Method
- 19.4.5. Form
- 19.4.6. Production Capacity (Annual Tonnage)
- 19.4.7. Recycling Rate/Purity Level
- 19.4.8. Technology
- 19.4.9. Quality Grade
- 19.4.10. End-Use Industry
- 19.4.11. Distribution Channel
- 19.5. India Recycled Aluminum Alloys Market
- 19.5.1. Country Segmental Analysis
- 19.5.2. Alloy Series/Type
- 19.5.3. Source/Scrap Type
- 19.5.4. Processing Method
- 19.5.5. Form
- 19.5.6. Production Capacity (Annual Tonnage)
- 19.5.7. Recycling Rate/Purity Level
- 19.5.8. Technology
- 19.5.9. Quality Grade
- 19.5.10. End-Use Industry
- 19.5.11. Distribution Channel
- 19.6. Japan Recycled Aluminum Alloys Market
- 19.6.1. Country Segmental Analysis
- 19.6.2. Alloy Series/Type
- 19.6.3. Source/Scrap Type
- 19.6.4. Processing Method
- 19.6.5. Form
- 19.6.6. Production Capacity (Annual Tonnage)
- 19.6.7. Recycling Rate/Purity Level
- 19.6.8. Technology
- 19.6.9. Quality Grade
- 19.6.10. End-Use Industry
- 19.6.11. Distribution Channel
- 19.7. South Korea Recycled Aluminum Alloys Market
- 19.7.1. Country Segmental Analysis
- 19.7.2. Alloy Series/Type
- 19.7.3. Source/Scrap Type
- 19.7.4. Processing Method
- 19.7.5. Form
- 19.7.6. Production Capacity (Annual Tonnage)
- 19.7.7. Recycling Rate/Purity Level
- 19.7.8. Technology
- 19.7.9. Quality Grade
- 19.7.10. End-Use Industry
- 19.7.11. Distribution Channel
- 19.8. Australia and New Zealand Recycled Aluminum Alloys Market
- 19.8.1. Country Segmental Analysis
- 19.8.2. Alloy Series/Type
- 19.8.3. Source/Scrap Type
- 19.8.4. Processing Method
- 19.8.5. Form
- 19.8.6. Production Capacity (Annual Tonnage)
- 19.8.7. Recycling Rate/Purity Level
- 19.8.8. Technology
- 19.8.9. Quality Grade
- 19.8.10. End-Use Industry
- 19.8.11. Distribution Channel
- 19.9. Indonesia Recycled Aluminum Alloys Market
- 19.9.1. Country Segmental Analysis
- 19.9.2. Alloy Series/Type
- 19.9.3. Source/Scrap Type
- 19.9.4. Processing Method
- 19.9.5. Form
- 19.9.6. Production Capacity (Annual Tonnage)
- 19.9.7. Recycling Rate/Purity Level
- 19.9.8. Technology
- 19.9.9. Quality Grade
- 19.9.10. End-Use Industry
- 19.9.11. Distribution Channel
- 19.10. Malaysia Recycled Aluminum Alloys Market
- 19.10.1. Country Segmental Analysis
- 19.10.2. Alloy Series/Type
- 19.10.3. Source/Scrap Type
- 19.10.4. Processing Method
- 19.10.5. Form
- 19.10.6. Production Capacity (Annual Tonnage)
- 19.10.7. Recycling Rate/Purity Level
- 19.10.8. Technology
- 19.10.9. Quality Grade
- 19.10.10. End-Use Industry
- 19.10.11. Distribution Channel
- 19.11. Thailand Recycled Aluminum Alloys Market
- 19.11.1. Country Segmental Analysis
- 19.11.2. Alloy Series/Type
- 19.11.3. Source/Scrap Type
- 19.11.4. Processing Method
- 19.11.5. Form
- 19.11.6. Production Capacity (Annual Tonnage)
- 19.11.7. Recycling Rate/Purity Level
- 19.11.8. Technology
- 19.11.9. Quality Grade
- 19.11.10. End-Use Industry
- 19.11.11. Distribution Channel
- 19.12. Vietnam Recycled Aluminum Alloys Market
- 19.12.1. Country Segmental Analysis
- 19.12.2. Alloy Series/Type
- 19.12.3. Source/Scrap Type
- 19.12.4. Processing Method
- 19.12.5. Form
- 19.12.6. Production Capacity (Annual Tonnage)
- 19.12.7. Recycling Rate/Purity Level
- 19.12.8. Technology
- 19.12.9. Quality Grade
- 19.12.10. End-Use Industry
- 19.12.11. Distribution Channel
- 19.13. Rest of Asia Pacific Recycled Aluminum Alloys Market
- 19.13.1. Country Segmental Analysis
- 19.13.2. Alloy Series/Type
- 19.13.3. Source/Scrap Type
- 19.13.4. Processing Method
- 19.13.5. Form
- 19.13.6. Production Capacity (Annual Tonnage)
- 19.13.7. Recycling Rate/Purity Level
- 19.13.8. Technology
- 19.13.9. Quality Grade
- 19.13.10. End-Use Industry
- 19.13.11. Distribution Channel
- 20. Middle East Recycled Aluminum Alloys Market Analysis
- 20.1. Key Segment Analysis
- 20.2. Regional Snapshot
- 20.3. Middle East Recycled Aluminum Alloys Market Size (Volume - MMT and Value - US$ Bn), Analysis, and Forecasts, 2021-2035
- 20.3.1. Alloy Series/Type
- 20.3.2. Source/Scrap Type
- 20.3.3. Processing Method
- 20.3.4. Form
- 20.3.5. Production Capacity (Annual Tonnage)
- 20.3.6. Recycling Rate/Purity Level
- 20.3.7. Technology
- 20.3.8. Quality Grade
- 20.3.9. End-Use Industry
- 20.3.10. Distribution Channel
- 20.3.11. Country
- 20.3.11.1. Turkey
- 20.3.11.2. UAE
- 20.3.11.3. Saudi Arabia
- 20.3.11.4. Israel
- 20.3.11.5. Rest of Middle East
- 20.4. Turkey Recycled Aluminum Alloys Market
- 20.4.1. Country Segmental Analysis
- 20.4.2. Alloy Series/Type
- 20.4.3. Source/Scrap Type
- 20.4.4. Processing Method
- 20.4.5. Form
- 20.4.6. Production Capacity (Annual Tonnage)
- 20.4.7. Recycling Rate/Purity Level
- 20.4.8. Technology
- 20.4.9. Quality Grade
- 20.4.10. End-Use Industry
- 20.4.11. Distribution Channel
- 20.5. UAE Recycled Aluminum Alloys Market
- 20.5.1. Country Segmental Analysis
- 20.5.2. Alloy Series/Type
- 20.5.3. Source/Scrap Type
- 20.5.4. Processing Method
- 20.5.5. Form
- 20.5.6. Production Capacity (Annual Tonnage)
- 20.5.7. Recycling Rate/Purity Level
- 20.5.8. Technology
- 20.5.9. Quality Grade
- 20.5.10. End-Use Industry
- 20.5.11. Distribution Channel
- 20.6. Saudi Arabia Recycled Aluminum Alloys Market
- 20.6.1. Country Segmental Analysis
- 20.6.2. Alloy Series/Type
- 20.6.3. Source/Scrap Type
- 20.6.4. Processing Method
- 20.6.5. Form
- 20.6.6. Production Capacity (Annual Tonnage)
- 20.6.7. Recycling Rate/Purity Level
- 20.6.8. Technology
- 20.6.9. Quality Grade
- 20.6.10. End-Use Industry
- 20.6.11. Distribution Channel
- 20.7. Israel Recycled Aluminum Alloys Market
- 20.7.1. Country Segmental Analysis
- 20.7.2. Alloy Series/Type
- 20.7.3. Source/Scrap Type
- 20.7.4. Processing Method
- 20.7.5. Form
- 20.7.6. Production Capacity (Annual Tonnage)
- 20.7.7. Recycling Rate/Purity Level
- 20.7.8. Technology
- 20.7.9. Quality Grade
- 20.7.10. End-Use Industry
- 20.7.11. Distribution Channel
- 20.8. Rest of Middle East Recycled Aluminum Alloys Market
- 20.8.1. Country Segmental Analysis
- 20.8.2. Alloy Series/Type
- 20.8.3. Source/Scrap Type
- 20.8.4. Processing Method
- 20.8.5. Form
- 20.8.6. Production Capacity (Annual Tonnage)
- 20.8.7. Recycling Rate/Purity Level
- 20.8.8. Technology
- 20.8.9. Quality Grade
- 20.8.10. End-Use Industry
- 20.8.11. Distribution Channel
- 21. Africa Recycled Aluminum Alloys Market Analysis
- 21.1. Key Segment Analysis
- 21.2. Regional Snapshot
- 21.3. Africa Recycled Aluminum Alloys Market Size (Volume - MMT and Value - US$ Bn), Analysis, and Forecasts, 2021-2035
- 21.3.1. Alloy Series/Type
- 21.3.2. Source/Scrap Type
- 21.3.3. Processing Method
- 21.3.4. Form
- 21.3.5. Production Capacity (Annual Tonnage)
- 21.3.6. Recycling Rate/Purity Level
- 21.3.7. Technology
- 21.3.8. Quality Grade
- 21.3.9. End-Use Industry
- 21.3.10. Distribution Channel
- 21.3.11. Country
- 21.3.11.1. South Africa
- 21.3.11.2. Egypt
- 21.3.11.3. Nigeria
- 21.3.11.4. Algeria
- 21.3.11.5. Rest of Africa
- 21.4. South Africa Recycled Aluminum Alloys Market
- 21.4.1. Country Segmental Analysis
- 21.4.2. Alloy Series/Type
- 21.4.3. Source/Scrap Type
- 21.4.4. Processing Method
- 21.4.5. Form
- 21.4.6. Production Capacity (Annual Tonnage)
- 21.4.7. Recycling Rate/Purity Level
- 21.4.8. Technology
- 21.4.9. Quality Grade
- 21.4.10. End-Use Industry
- 21.4.11. Distribution Channel
- 21.5. Egypt Recycled Aluminum Alloys Market
- 21.5.1. Country Segmental Analysis
- 21.5.2. Alloy Series/Type
- 21.5.3. Source/Scrap Type
- 21.5.4. Processing Method
- 21.5.5. Form
- 21.5.6. Production Capacity (Annual Tonnage)
- 21.5.7. Recycling Rate/Purity Level
- 21.5.8. Technology
- 21.5.9. Quality Grade
- 21.5.10. End-Use Industry
- 21.5.11. Distribution Channel
- 21.6. Nigeria Recycled Aluminum Alloys Market
- 21.6.1. Country Segmental Analysis
- 21.6.2. Alloy Series/Type
- 21.6.3. Source/Scrap Type
- 21.6.4. Processing Method
- 21.6.5. Form
- 21.6.6. Production Capacity (Annual Tonnage)
- 21.6.7. Recycling Rate/Purity Level
- 21.6.8. Technology
- 21.6.9. Quality Grade
- 21.6.10. End-Use Industry
- 21.6.11. Distribution Channel
- 21.7. Algeria Recycled Aluminum Alloys Market
- 21.7.1. Country Segmental Analysis
- 21.7.2. Alloy Series/Type
- 21.7.3. Source/Scrap Type
- 21.7.4. Processing Method
- 21.7.5. Form
- 21.7.6. Production Capacity (Annual Tonnage)
- 21.7.7. Recycling Rate/Purity Level
- 21.7.8. Technology
- 21.7.9. Quality Grade
- 21.7.10. End-Use Industry
- 21.7.11. Distribution Channel
- 21.8. Rest of Africa Recycled Aluminum Alloys Market
- 21.8.1. Country Segmental Analysis
- 21.8.2. Alloy Series/Type
- 21.8.3. Source/Scrap Type
- 21.8.4. Processing Method
- 21.8.5. Form
- 21.8.6. Production Capacity (Annual Tonnage)
- 21.8.7. Recycling Rate/Purity Level
- 21.8.8. Technology
- 21.8.9. Quality Grade
- 21.8.10. End-Use Industry
- 21.8.11. Distribution Channel
- 22. South America Recycled Aluminum Alloys Market Analysis
- 22.1. Key Segment Analysis
- 22.2. Regional Snapshot
- 22.3. South America Recycled Aluminum Alloys Market Size (Volume - MMT and Value - US$ Bn), Analysis, and Forecasts, 2021-2035
- 22.3.1. Alloy Series/Type
- 22.3.2. Source/Scrap Type
- 22.3.3. Processing Method
- 22.3.4. Form
- 22.3.5. Production Capacity (Annual Tonnage)
- 22.3.6. Recycling Rate/Purity Level
- 22.3.7. Technology
- 22.3.8. Quality Grade
- 22.3.9. End-Use Industry
- 22.3.10. Distribution Channel
- 22.3.11. Country
- 22.3.11.1. Brazil
- 22.3.11.2. Argentina
- 22.3.11.3. Rest of South America
- 22.4. Brazil Recycled Aluminum Alloys Market
- 22.4.1. Country Segmental Analysis
- 22.4.2. Alloy Series/Type
- 22.4.3. Source/Scrap Type
- 22.4.4. Processing Method
- 22.4.5. Form
- 22.4.6. Production Capacity (Annual Tonnage)
- 22.4.7. Recycling Rate/Purity Level
- 22.4.8. Technology
- 22.4.9. Quality Grade
- 22.4.10. End-Use Industry
- 22.4.11. Distribution Channel
- 22.5. Argentina Recycled Aluminum Alloys Market
- 22.5.1. Country Segmental Analysis
- 22.5.2. Alloy Series/Type
- 22.5.3. Source/Scrap Type
- 22.5.4. Processing Method
- 22.5.5. Form
- 22.5.6. Production Capacity (Annual Tonnage)
- 22.5.7. Recycling Rate/Purity Level
- 22.5.8. Technology
- 22.5.9. Quality Grade
- 22.5.10. End-Use Industry
- 22.5.11. Distribution Channel
- 22.6. Rest of South America Recycled Aluminum Alloys Market
- 22.6.1. Country Segmental Analysis
- 22.6.2. Alloy Series/Type
- 22.6.3. Source/Scrap Type
- 22.6.4. Processing Method
- 22.6.5. Form
- 22.6.6. Production Capacity (Annual Tonnage)
- 22.6.7. Recycling Rate/Purity Level
- 22.6.8. Technology
- 22.6.9. Quality Grade
- 22.6.10. End-Use Industry
- 22.6.11. Distribution Channel
- 23. Key Players/ Company Profile
- 23.1. Alcoa Corporation
- 23.1.1. Company Details/ Overview
- 23.1.2. Company Financials
- 23.1.3. Key Customers and Competitors
- 23.1.4. Business/ Industry Portfolio
- 23.1.5. Product Portfolio/ Specification Details
- 23.1.6. Pricing Data
- 23.1.7. Strategic Overview
- 23.1.8. Recent Developments
- 23.2. Hindalco Industries Limited
- 23.3. Aluminium Norf GmbH
- 23.4. Aluminum Recycling Company (ARCO)
- 23.5. AMAG Austria Metall AG
- 23.6. Befesa
- 23.7. Commercial Metals Company (CMC)
- 23.8. Constellium SE
- 23.9. European Metal Recycling (EMR)
- 23.10. Galloo Group
- 23.11. Hammerer Aluminium Industries (HAI)
- 23.12. Hydro Aluminium (Norsk Hydro ASA)
- 23.13. Kaiser Aluminum Corporation
- 23.14. Kuusakoski Group
- 23.15. Matalco Inc.
- 23.16. Novelis Inc.
- 23.17. Pyrotek Inc.
- 23.18. Real Alloy
- 23.19. Schnitzer Steel Industries
- 23.20. Sigma Group
- 23.21. Trimet Aluminium SE
- 23.22. Other Key Players
- 23.1. Alcoa Corporation
Note* - This is just tentative list of players. While providing the report, we will cover more number of players based on their revenue and share for each geography
Research Design
Our research design integrates both demand-side and supply-side analysis through a balanced combination of primary and secondary research methodologies. By utilizing both bottom-up and top-down approaches alongside rigorous data triangulation methods, we deliver robust market intelligence that supports strategic decision-making.
MarketGenics' comprehensive research design framework ensures the delivery of accurate, reliable, and actionable market intelligence. Through the integration of multiple research approaches, rigorous validation processes, and expert analysis, we provide our clients with the insights needed to make informed strategic decisions and capitalize on market opportunities.

MarketGenics leverages a dedicated industry panel of experts and a comprehensive suite of paid databases to effectively collect, consolidate, and analyze market intelligence.
Our approach has consistently proven to be reliable and effective in generating accurate market insights, identifying key industry trends, and uncovering emerging business opportunities.
Through both primary and secondary research, we capture and analyze critical company-level data such as manufacturing footprints, including technical centers, R&D facilities, sales offices, and headquarters.
Our expert panel further enhances our ability to estimate market size for specific brands based on validated field-level intelligence.
Our data mining techniques incorporate both parametric and non-parametric methods, allowing for structured data collection, sorting, processing, and cleaning.
Demand projections are derived from large-scale data sets analyzed through proprietary algorithms, culminating in robust and reliable market sizing.
Research Approach
The bottom-up approach builds market estimates by starting with the smallest addressable market units and systematically aggregating them to create comprehensive market size projections.
This method begins with specific, granular data points and builds upward to create the complete market landscape.
Customer Analysis → Segmental Analysis → Geographical Analysis
The top-down approach starts with the broadest possible market data and systematically narrows it down through a series of filters and assumptions to arrive at specific market segments or opportunities.
This method begins with the big picture and works downward to increasingly specific market slices.
TAM → SAM → SOM


Research Methods
Desk / Secondary Research
While analysing the market, we extensively study secondary sources, directories, and databases to identify and collect information useful for this technical, market-oriented, and commercial report. Secondary sources that we utilize are not only the public sources, but it is a combination of Open Source, Associations, Paid Databases, MG Repository & Knowledgebase, and others.
- Company websites, annual reports, financial reports, broker reports, and investor presentations
- National government documents, statistical databases and reports
- News articles, press releases and web-casts specific to the companies operating in the market, Magazines, reports, and others
- We gather information from commercial data sources for deriving company specific data such as segmental revenue, share for geography, product revenue, and others
- Internal and external proprietary databases (industry-specific), relevant patent, and regulatory databases
- Governing Bodies, Government Organizations
- Relevant Authorities, Country-specific Associations for Industries
We also employ the model mapping approach to estimate the product level market data through the players' product portfolio
Primary Research
Primary research/ interviews is vital in analyzing the market. Most of the cases involves paid primary interviews. Primary sources include primary interviews through e-mail interactions, telephonic interviews, surveys as well as face-to-face interviews with the different stakeholders across the value chain including several industry experts.
| Type of Respondents | Number of Primaries |
|---|---|
| Tier 2/3 Suppliers | ~20 |
| Tier 1 Suppliers | ~25 |
| End-users | ~25 |
| Industry Expert/ Panel/ Consultant | ~30 |
| Total | ~100 |
MG Knowledgebase
• Repository of industry blog, newsletter and case studies
• Online platform covering detailed market reports, and company profiles
Forecasting Factors and Models
Forecasting Factors
- Historical Trends – Past market patterns, cycles, and major events that shaped how markets behave over time. Understanding past trends helps predict future behavior.
- Industry Factors – Specific characteristics of the industry like structure, regulations, and innovation cycles that affect market dynamics.
- Macroeconomic Factors – Economic conditions like GDP growth, inflation, and employment rates that affect how much money people have to spend.
- Demographic Factors – Population characteristics like age, income, and location that determine who can buy your product.
- Technology Factors – How quickly people adopt new technology and how much technology infrastructure exists.
- Regulatory Factors – Government rules, laws, and policies that can help or restrict market growth.
- Competitive Factors – Analyzing competition structure such as degree of competition and bargaining power of buyers and suppliers.
Forecasting Models / Techniques
Multiple Regression Analysis
- Identify and quantify factors that drive market changes
- Statistical modeling to establish relationships between market drivers and outcomes
Time Series Analysis – Seasonal Patterns
- Understand regular cyclical patterns in market demand
- Advanced statistical techniques to separate trend, seasonal, and irregular components
Time Series Analysis – Trend Analysis
- Identify underlying market growth patterns and momentum
- Statistical analysis of historical data to project future trends
Expert Opinion – Expert Interviews
- Gather deep industry insights and contextual understanding
- In-depth interviews with key industry stakeholders
Multi-Scenario Development
- Prepare for uncertainty by modeling different possible futures
- Creating optimistic, pessimistic, and most likely scenarios
Time Series Analysis – Moving Averages
- Sophisticated forecasting for complex time series data
- Auto-regressive integrated moving average models with seasonal components
Econometric Models
- Apply economic theory to market forecasting
- Sophisticated economic models that account for market interactions
Expert Opinion – Delphi Method
- Harness collective wisdom of industry experts
- Structured, multi-round expert consultation process
Monte Carlo Simulation
- Quantify uncertainty and probability distributions
- Thousands of simulations with varying input parameters
Research Analysis
Our research framework is built upon the fundamental principle of validating market intelligence from both demand and supply perspectives. This dual-sided approach ensures comprehensive market understanding and reduces the risk of single-source bias.
Demand-Side Analysis: We understand end-user/application behavior, preferences, and market needs along with the penetration of the product for specific application.
Supply-Side Analysis: We estimate overall market revenue, analyze the segmental share along with industry capacity, competitive landscape, and market structure.
Validation & Evaluation
Data triangulation is a validation technique that uses multiple methods, sources, or perspectives to examine the same research question, thereby increasing the credibility and reliability of research findings. In market research, triangulation serves as a quality assurance mechanism that helps identify and minimize bias, validate assumptions, and ensure accuracy in market estimates.
- Data Source Triangulation – Using multiple data sources to examine the same phenomenon
- Methodological Triangulation – Using multiple research methods to study the same research question
- Investigator Triangulation – Using multiple researchers or analysts to examine the same data
- Theoretical Triangulation – Using multiple theoretical perspectives to interpret the same data

Custom Market Research Services
We will customise the research for you, in case the report listed above does not meet your requirements.
Get 10% Free Customisation