Synthetic Aperture Radar Market Size, Share & Trends Analysis Report by Platform Type (Airborne SAR, Spaceborne SAR, Ground-based SAR, Naval/Ship-based SAR, Others), Frequency Band, Mode of Operation, Imaging Type, Antenna Type, Component, Polarization, Product Type, End-Use X Applications, and Geography (North America, Europe, Asia Pacific, Middle East, Africa, and South America) – Global Industry Data, Trends, and Forecasts, 2026–2035
|
|
|
Segmental Data Insights |
|
|
Demand Trends |
|
|
Competitive Landscape |
|
|
Strategic Development |
|
|
Future Outlook & Opportunities |
|
Synthetic Aperture Radar Market Size, Share, and Growth
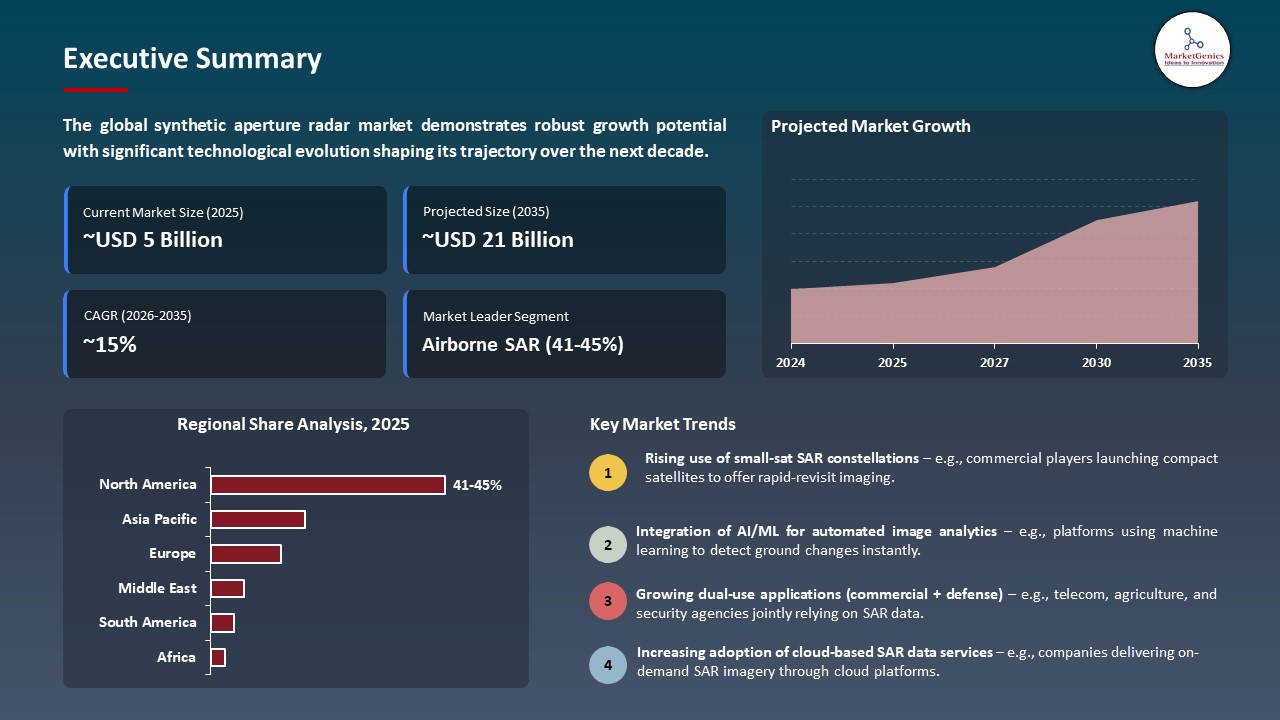
The global synthetic aperture radar market is experiencing robust growth, with its estimated value of USD 5.3 billion in the year 2025 and USD 20.9 billion by the period 2035, registering a CAGR of 14.7%, during the forecast period. The global synthetic aperture radar market demand is driven by the need for high-resolution, all-weather imaging for defense surveillance, intelligence, and disaster management, alongside rising commercial uses in agriculture, infrastructure monitoring, and maritime domain awareness. Growing satellite constellations, technological advances, and increased government investment further accelerate market adoption.
Giampiero Di Paolo, Senior Vice President Observation, Exploration, and Navigation at Thales Alenia Space said, “This contract confirms Thales Alenia Space’s longstanding and recognized experience in manufacturing Earth observation satellites based on radar technology, the development of the two radar instruments will allow Thales Alenia Space to make a significant technological and architectural step forward improving the competitiveness of SAR products both in the institutional and commercial Earth observation markets”.
The global synthetic aperture radar market is driven by the demand of high-resolution, all weather, day and night imaging that is needed during surveillance, disaster response, environmental and security application. As an example, in March 2025, ICEYE deployed its “Gen4” SAR satellites, which is the high-resolution all-weather day-night observation of Earth and the response to disasters. This movement is propelling the use of SAR technologies in commercial, governmental and environmental uses leading to long-term growth of the market.
Additionally, the synthetic aperture radar market is driven by the development of miniaturization and low-cost SAR payloads, making it possible to apply it widely in agriculture, infrastructure surveillance, and maritime surveillance. As an example, in August 2025, Capella Space increased the small-satellite SAR constellation, providing customers with near-real-time imagery to both businesses and governmental clients. The trend is making it more accessible and efficient in its operations, and thus driving the growth of the market even more.
Key adjacent opportunities to the global synthetic aperture radar market include small satellite constellations, AI-based geospatial analytics, Internet of Things (IoT) integration, autonomous maritime and land navigation, and climate and disaster monitoring services. These industries use SAR data in order to improve precision, efficiency and predictability. The transition to these adjacent markets enhances the adoption of SAR, pushing the growth of revenues and technology advancement in the technologies.
Synthetic Aperture Radar Market Dynamics and Trends
Driver: Increased Demand for Sovereign and Commercial Earth‑Observation Constellations
-
The synthetic aperture radar market is growing rapidly due to increasing demand of high-resolution all-weather Earth observation and surveillance of national security, environment, and disaster management as well as commercial uses and governments are investing in SAR constellations as a means of having independent surveillance and quick response capabilities.
- Additionally, commercial industries, such as agriculture, insurance, maritime, and infrastructure, are utilizing dependable and regular satellite images to boost their business operations and aid in making informed decisions. The major advantages of the advanced SAR capabilities include near-real-time monitoring, predictive analytics, and better risk management.
- For instance, in November 2025, ICEYE increased its satellite army with five new SAR satellites, which will expand the capabilities of both commercial customers and national surveillance missions. This growth is increasing the capacity of the markets, improving the access to high-resolution, all weather Earth observation data globally.
- Rapid SAR expansion is transforming the earth observation and availing governments and industries with timely and high-resolution all-weather data to improve security, efficiency, and decision making.
Restraint: Regulatory and Export‑Control Constraints on SAR Technology Transfer
-
The synthetic aperture radar market faces significant regulatory and export-control restrictions which restrict transfer of hi-tech radar systems and related information globally. The SAR technology of high resolution is categorized as sensitive because it has dual purpose in the national security, defense and intelligence thereby introducing a high regulation of its global dissemination.
- Additionally, export-controlling rules are placed on international transfer of SAR technology, such as the International Traffic in Arms Regulations (ITAR) of the United States and the Wassenaar Arrangement. These models involve licensing, end-user authentication, and close compliance checks, limiting the sale across the borders and joint development projects, as well as the access to state-of-art SAR services.
- The synthetic aperture radar market requires rigorous adherence to regulatory and export-control constraints to preserve sensitive technologies and promote safe global cooperation and strategic development.
Opportunity: Integration of SAR Data with AI‑Powered Analytics Platforms for Value‑Added Services
-
The synthetic aperture radar market is utilizing AI-driven analytics to provide value-added services. All-weather, high-resolution SAR data with machine learning can be used to predict analytics, detect anomalies, and provide automated decisions in the agriculture, disaster management, maritime surveillance, and infrastructure monitoring sectors.
- By transforming raw SAR imagery into operational intelligence, these platforms improve operational efficiency, risk management and situational awareness. The integration will create commercial and strategic value and increase the global market potential of SAR-based solutions.
- For instance, in September 2025, ICEYE and SATIM introduced the “Detect & Classify” solution, integrating ICEYE’s high-resolution SAR imagery with SATIM’s AI analytics to automatically identify and categorize vessels, aircraft, and vehicles across land, sea, and air with over 90% accuracy. Detect & Classify solution allows quick, automatic and extremely precise identification of targets, which improves the situational awareness and decision-making.
- AI-based SAR analytics is transforming the industries by making them swift, computerized, and extremely precise in driving operational effectiveness and strategic decision-making.
Key Trend: Consolidation Between Defence Firms and Commercial SAR Providers to Build Hybrid Constellations
-
The global synthetic aperture radar market is merging into hybrid constellations to fulfill defense and civilian needs. For example, ICEYE and IHI Corporation have signed to collaborate on a SAR constellation of up to 24 satellites to provide earth-observation data to military, civilian, and commercial consumers.
- These collaborations bring together the commercial parties' technology capabilities, financial capabilities, and deployment agility, as well as the defense agencies' security and strategic requirements. Synergy between national security, surveillance, environmental monitoring, and civilian infrastructure planning allows for faster deployment, higher revisit rates, and a diverse variety of applications.
- Consolidating SAR capabilities speeds deployment, expands coverage, and strengthens global resilience through dual-use satellite constellations that fulfill defense and commercial demands.
Synthetic-Aperture-Radar-Market Analysis and Segmental Data
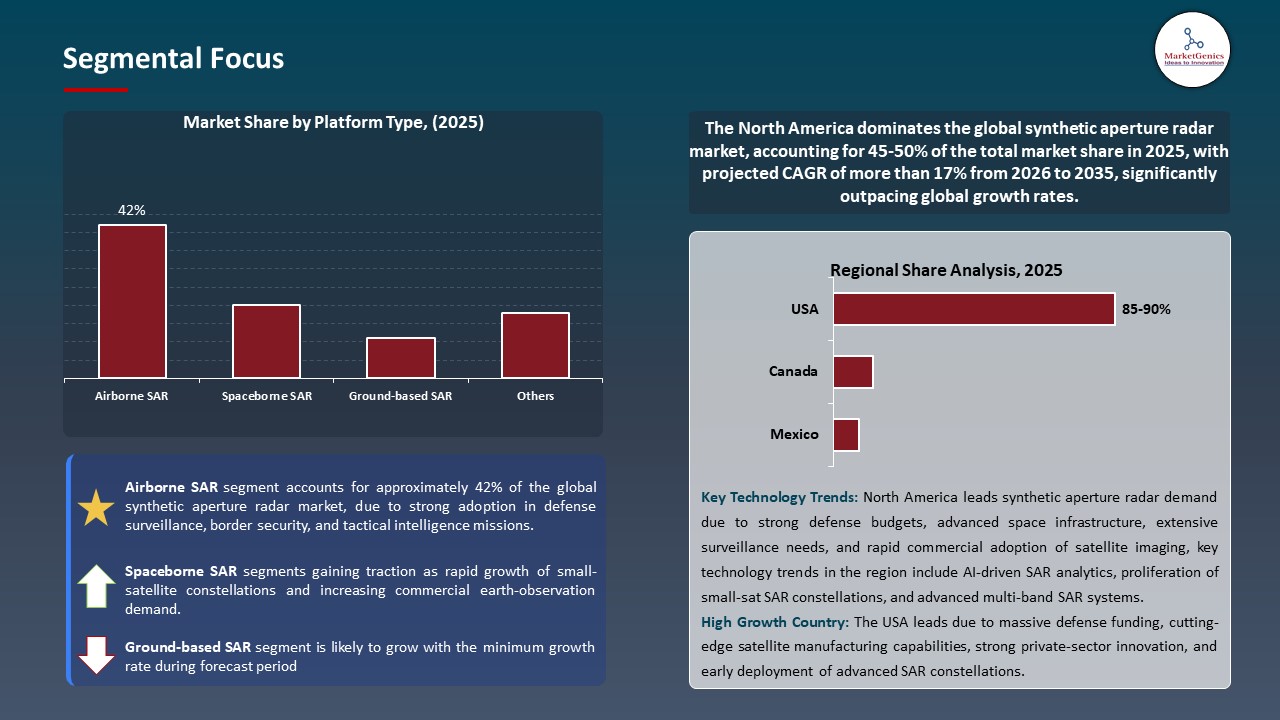
Airborne SAR Dominate Global Synthetic Aperture Radar Market
-
The airborne SAR sector dominates the global synthetic aperture radar market because to its versatility, quick deployment, and all-weather, high resolution imaging capabilities. Airborne SAR, which is installed on a plane or UAV, provides near-real-time observation and monitoring. It is notably useful in military, border protection, disaster management, maritime surveillance, and infrastructure surveying.
- Airborne platforms offer lower latency, customizable mission requirements, and cost-effective deployment for specific missions compared to spaceborne platforms. Market usage is also growing due to increased investments in defense modernization, homeland security, and environmental surveillance.
- Airborne SAR may play a crucial role in providing timely intelligence for commercial and government sectors internationally.
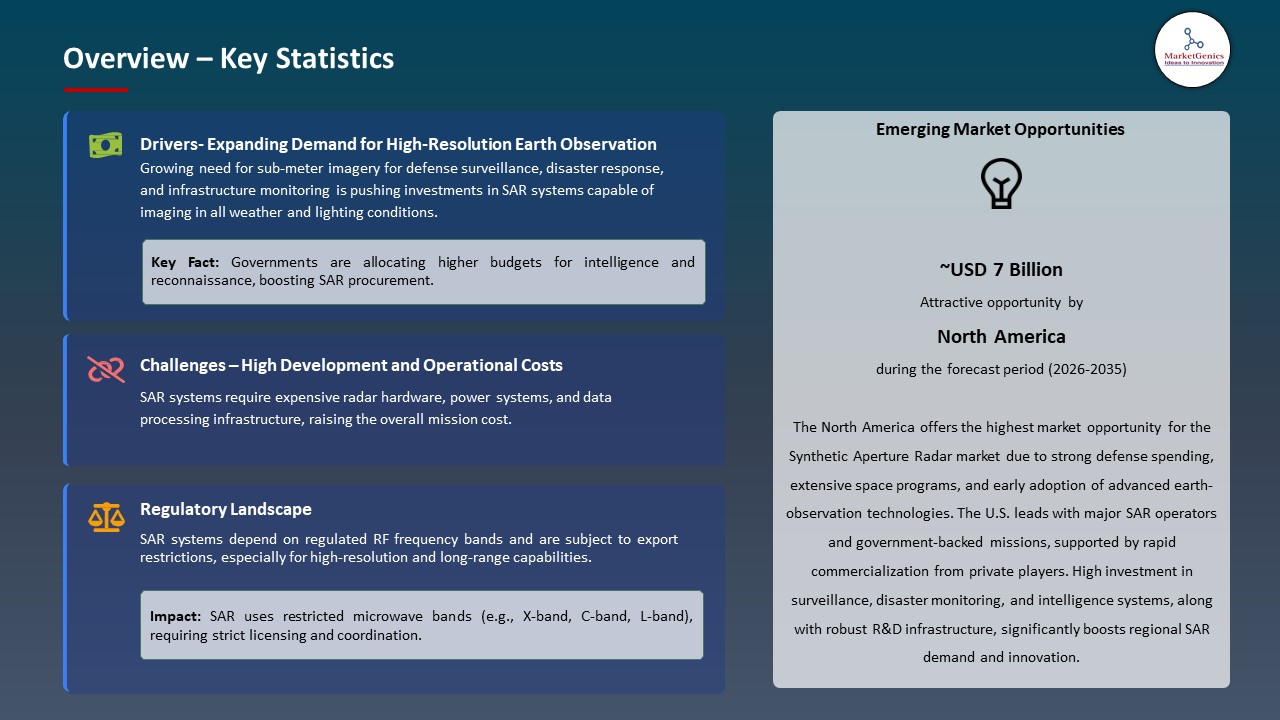
North America Leads Global Synthetic Aperture Radar Market Demand
-
North America dominates the synthetic aperture radar market with significant government and private investments in earth observation, defense, and intelligence applications. The US Department of Defense, NASA, and the NOAA are the primary agencies expanding SAR satellite programs to offer high-resolution all-weather imaging for surveillance and environmental monitoring.
- For instance, NASA has contracted with ICEYE US, Inc., a California-based company to purchase commercial SAR Earth-observation data, which evidences the agency strategic involvement with the SAR providers in the private sector to augment its satellite program.
- Additionally, increase in commercial demand, led by analytics, disaster management and infrastructure monitoring is accelerating SAR usage in agriculture, transportation and energy, introducing new opportunities to the existing companies and startups.
- The innovation ecosystem, including robust R&D environment, regulatory support, and strategic partnering, is present, which puts North America at the forefront of SAR innovations, with the assistance of advanced radar technologies and small satellite constellations.
- North America's advantage in SAR enhances defense and commercial sectors, fosters innovation, expands high-resolution Earth-observation, and opens up new market opportunities.
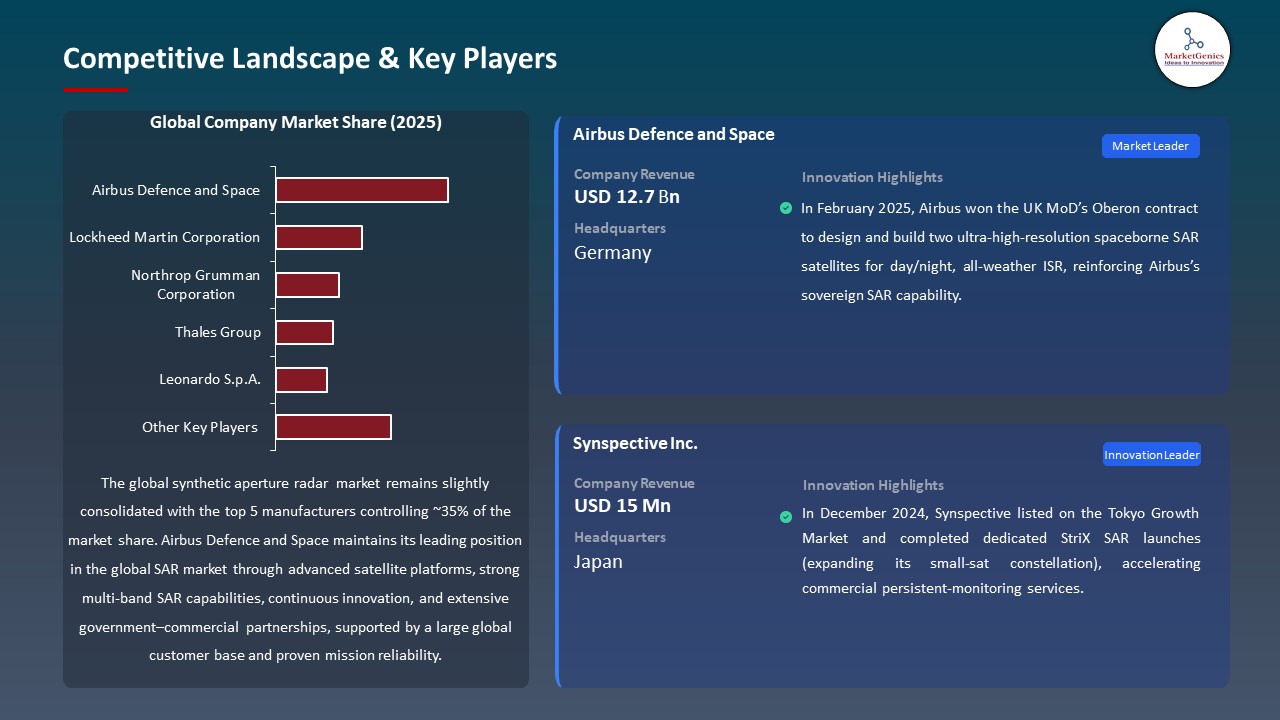
Synthetic-Aperture-Radar-Market Ecosystem
The global synthetic aperture radar market is slightly consolidated, with high concentration among key players such as Airbus Defence and Space, Lockheed Martin Corporation, Northrop Grumman Corporation, Thales Group, and Leonardo S.p.A., who dominate through high technological capacities, strategic government contracts, large R and D investment and extensive portfolio of satellite and sensors.
For instance, in 2025, the TerraSAR X satellite of Airbus Defence and Space offers high-quality all-weather round-the-clock radar imagery of the Earth to its scientific and commercial customers, demonstrating exceptional reliability and operational performance. All-weather High-resolution SAR images enhance scientific, commercial, and defense solutions around the globe.
Recent Development and Strategic Overview:
-
In November 2024, Maxar completed the divestiture of its Radar & Sensor Technology (RST) division to ARKA, restructuring its SAR-related portfolio and underscoring a broader industry shift toward consolidating radar intellectual property and engineering capabilities as companies increasingly specialize between sensor development and satellite imagery platforms.
- In October 2024, Thales Alenia Space secured a contract to design and validate C-band SAR instruments for the Harmony Earth-Explorer mission, enhancing the program’s capability to support ocean, ice, and volcanic monitoring through the integration of advanced radar payload technologies.
Report Scope
|
Detail |
|
|
Market Size in 2025 |
USD 5.3 Bn |
|
Market Forecast Value in 2035 |
USD 20.9 Bn |
|
Growth Rate (CAGR) |
14.7% |
|
Forecast Period |
2026 – 2035 |
|
Historical Data Available for |
2021 – 2024 |
|
Market Size Units |
US$ Billion for Value Million Units for Volume |
|
Report Format |
Electronic (PDF) + Excel |
|
North America |
Europe |
Asia Pacific |
Middle East |
Africa |
South America |
|
|
|
|
|
|
|
Companies Covered |
|||||
|
|
|
|
|
|
Synthetic-Aperture-Radar-Market Segmentation and Highlights
|
Segment |
Sub-segment |
|
Synthetic Aperture Radar Market, By Platform Type |
|
|
Synthetic Aperture Radar Market, By Frequency Band |
|
|
Synthetic Aperture Radar Market, By Mode of Operation |
|
|
Synthetic Aperture Radar Market, By Imaging Type |
|
|
Synthetic Aperture Radar Market, By Antenna Type
|
|
|
Synthetic Aperture Radar Market, By Component
|
|
|
Synthetic Aperture Radar Market, By Polarization
|
|
|
Synthetic Aperture Radar Market, By Product Type
|
|
|
Synthetic Aperture Radar Market, By End-Use X Applications |
|
Frequently Asked Questions
Table of Contents
- 1. Research Methodology and Assumptions
- 1.1. Definitions
- 1.2. Research Design and Approach
- 1.3. Data Collection Methods
- 1.4. Base Estimates and Calculations
- 1.5. Forecasting Models
- 1.5.1. Key Forecast Factors & Impact Analysis
- 1.6. Secondary Research
- 1.6.1. Open Sources
- 1.6.2. Paid Databases
- 1.6.3. Associations
- 1.7. Primary Research
- 1.7.1. Primary Sources
- 1.7.2. Primary Interviews with Stakeholders across Ecosystem
- 2. Executive Summary
- 2.1. Global Synthetic Aperture Radar Market Outlook
- 2.1.1. Synthetic Aperture Radar Market Size (Volume - Million Units and Value - US$ Bn), and Forecasts, 2021-2035
- 2.1.2. Compounded Annual Growth Rate Analysis
- 2.1.3. Growth Opportunity Analysis
- 2.1.4. Segmental Share Analysis
- 2.1.5. Geographical Share Analysis
- 2.2. Market Analysis and Facts
- 2.3. Supply-Demand Analysis
- 2.4. Competitive Benchmarking
- 2.5. Go-to- Market Strategy
- 2.5.1. Customer/ End-use Industry Assessment
- 2.5.2. Growth Opportunity Data, 2026-2035
- 2.5.2.1. Regional Data
- 2.5.2.2. Country Data
- 2.5.2.3. Segmental Data
- 2.5.3. Identification of Potential Market Spaces
- 2.5.4. GAP Analysis
- 2.5.5. Potential Attractive Price Points
- 2.5.6. Prevailing Market Risks & Challenges
- 2.5.7. Preferred Sales & Marketing Strategies
- 2.5.8. Key Recommendations and Analysis
- 2.5.9. A Way Forward
- 2.1. Global Synthetic Aperture Radar Market Outlook
- 3. Industry Data and Premium Insights
- 3.1. Global Aerospace & Defense Industry Overview, 2025
- 3.1.1. Aerospace & Defense Industry Ecosystem Analysis
- 3.1.2. Key Trends for Aerospace & Defense Industry
- 3.1.3. Regional Distribution for Aerospace & Defense Industry
- 3.2. Supplier Customer Data
- 3.3. Technology Roadmap and Developments
- 3.4. Trade Analysis
- 3.4.1. Import & Export Analysis, 2025
- 3.4.2. Top Importing Countries
- 3.4.3. Top Exporting Countries
- 3.5. Trump Tariff Impact Analysis
- 3.5.1. Manufacturer
- 3.5.1.1. Based on the component & Raw material
- 3.5.2. Supply Chain
- 3.5.3. End Consumer
- 3.5.1. Manufacturer
- 3.6. Raw Material Analysis
- 3.1. Global Aerospace & Defense Industry Overview, 2025
- 4. Market Overview
- 4.1. Market Dynamics
- 4.1.1. Drivers
- 4.1.1.1. Increasing demand for high-resolution earth observation and surveillance
- 4.1.1.2. Growing adoption in defense and military applications
- 4.1.1.3. Advancements in miniaturized and cost-effective SAR satellites
- 4.1.2. Restraints
- 4.1.2.1. High development and deployment costs
- 4.1.2.2. Regulatory and frequency spectrum limitations
- 4.1.1. Drivers
- 4.2. Key Trend Analysis
- 4.3. Regulatory Framework
- 4.3.1. Key Regulations, Norms, and Subsidies, by Key Countries
- 4.3.2. Tariffs and Standards
- 4.3.3. Impact Analysis of Regulations on the Market
- 4.4. Value Chain Analysis
- 4.4.1. Component Suppliers
- 4.4.2. Synthetic Aperture Radar Manufacturers
- 4.4.3. Distribution & Logistics
- 4.4.4. End-Users/Application
- 4.5. Porter’s Five Forces Analysis
- 4.6. PESTEL Analysis
- 4.7. Global Synthetic Aperture Radar Market Demand
- 4.7.1. Historical Market Size – Volume (Million Units) and Value (US$ Bn), 2020-2024
- 4.7.2. Current and Future Market Size – Volume (Million Units) and Value (US$ Bn), 2026–2035
- 4.7.2.1. Y-o-Y Growth Trends
- 4.7.2.2. Absolute $ Opportunity Assessment
- 4.1. Market Dynamics
- 5. Competition Landscape
- 5.1. Competition structure
- 5.1.1. Fragmented v/s consolidated
- 5.2. Company Share Analysis, 2025
- 5.2.1. Global Company Market Share
- 5.2.2. By Region
- 5.2.2.1. North America
- 5.2.2.2. Europe
- 5.2.2.3. Asia Pacific
- 5.2.2.4. Middle East
- 5.2.2.5. Africa
- 5.2.2.6. South America
- 5.3. Product Comparison Matrix
- 5.3.1. Specifications
- 5.3.2. Market Positioning
- 5.3.3. Pricing
- 5.1. Competition structure
- 6. Global Synthetic Aperture Radar Market Analysis, by Platform Type
- 6.1. Key Segment Analysis
- 6.2. Synthetic Aperture Radar Market Size (Volume - Million Units and Value - US$ Bn), Analysis, and Forecasts, by Platform Type, 2021-2035
- 6.2.1. Airborne SAR
- 6.2.1.1. Manned Aircraft
- 6.2.1.2. Unmanned Aerial Vehicles (UAVs)
- 6.2.2. Spaceborne SAR
- 6.2.2.1. Low Earth Orbit (LEO)
- 6.2.2.2. Medium Earth Orbit (MEO)
- 6.2.3. Ground-based SAR
- 6.2.4. Naval/Ship-based SAR
- 6.2.5. Others
- 6.2.1. Airborne SAR
- 7. Global Synthetic Aperture Radar Market Analysis, by Frequency Band
- 7.1. Key Segment Analysis
- 7.2. Synthetic Aperture Radar Market Size (Volume - Million Units and Value - US$ Bn), Analysis, and Forecasts, Frequency Band, 2021-2035
- 7.2.1. L-band
- 7.2.2. S-band
- 7.2.3. C-band
- 7.2.4. X-band
- 7.2.5. Multi-band
- 8. Global Synthetic Aperture Radar Market Analysis, by Mode of Operation
- 8.1. Key Segment Analysis
- 8.2. Synthetic Aperture Radar Market Size (Volume - Million Units and Value - US$ Bn), Analysis, and Forecasts, by Mode of Operation, 2021-2035
- 8.2.1. Stripmap Mode
- 8.2.2. Spotlight Mode
- 8.2.3. ScanSAR Mode
- 8.2.4. Interferometric SAR (InSAR)
- 8.2.5. Polarimetric SAR (PolSAR)
- 8.2.6. Differential SAR (DInSAR)
- 8.2.7. Bistatic/Multistatic SAR
- 9. Global Synthetic Aperture Radar Market Analysis, by Imaging Type
- 9.1. Key Segment Analysis
- 9.2. Synthetic Aperture Radar Market Size (Volume - Million Units and Value - US$ Bn), Analysis, and Forecasts, by Imaging Type, 2021-2035
- 9.2.1. 2D Imaging
- 9.2.2. 3D Imaging
- 9.2.3. 4D Imaging (Time-series)
- 10. Global Synthetic Aperture Radar Market Analysis, by Antenna Type
- 10.1. Key Segment Analysis
- 10.2. Synthetic Aperture Radar Market Size (Volume - Million Units and Value - US$ Bn), Analysis, and Forecasts, by Antenna Type, 2021-2035
- 10.2.1. Phased Array Antenna
- 10.2.2. Reflector Antenna
- 10.2.3. Planar Array Antenna
- 10.2.4. Active Electronically Scanned Array (AESA)
- 11. Global Synthetic Aperture Radar Market Analysis, by Component
- 11.1. Key Segment Analysis
- 11.2. Synthetic Aperture Radar Market Size (Volume - Million Units and Value - US$ Bn), Analysis, and Forecasts, by Component, 2021-2035
- 11.2.1. Antenna
- 11.2.2. Transmitter
- 11.2.3. Receiver
- 11.2.4. Signal Processor
- 11.2.5. Data Storage & Processing Unit
- 11.2.6. Power Supply System
- 11.2.7. Software & Algorithms
- 12. Global Synthetic Aperture Radar Market Analysis, by Polarization
- 12.1. Key Segment Analysis
- 12.2. Synthetic Aperture Radar Market Size (Volume - Million Units and Value - US$ Bn), Analysis, and Forecasts, by Polarization, 2021-2035
- 12.2.1. Single Polarization
- 12.2.2. Dual Polarization
- 12.2.3. Quad Polarization (Fully Polarimetric)
- 13. Global Synthetic Aperture Radar Market Analysis, by Product Type
- 13.1. Key Segment Analysis
- 13.2. Synthetic Aperture Radar Market Size (Volume - Million Units and Value - US$ Bn), Analysis, and Forecasts, by Product Type, 2021-2035
- 13.2.1. Synthetic Aperture Radar Systems
- 13.2.2. SAR Subsystems & Components
- 13.2.3. SAR Software & Services
- 13.2.4. SAR Data Products
- 14. Global Synthetic Aperture Radar Market Analysis, by End-Use X Applications
- 14.1. Key Segment Analysis
- 14.2. Synthetic Aperture Radar Market Size (Volume - Million Units and Value - US$ Bn), Analysis, and Forecasts, by End-Use X Applications, 2021-2035
- 14.2.1. Defense & Military
- 14.2.1.1. Surveillance & Reconnaissance
- 14.2.1.2. Target Detection & Tracking
- 14.2.1.3. Battlefield Monitoring
- 14.2.1.4. Intelligence Gathering
- 14.2.1.5. Maritime Patrol
- 14.2.1.6. Border Security
- 14.2.1.7. Others
- 14.2.2. Agriculture
- 14.2.2.1. Crop Monitoring
- 14.2.2.2. Soil Moisture Assessment
- 14.2.2.3. Yield Prediction
- 14.2.2.4. Precision Farming
- 14.2.2.5. Irrigation Management
- 14.2.2.6. Others
- 14.2.3. Environmental Monitoring
- 14.2.3.1. Deforestation Tracking
- 14.2.3.2. Land Cover Mapping
- 14.2.3.3. Ecosystem Monitoring
- 14.2.3.4. Wildlife Habitat Analysis
- 14.2.3.5. Carbon Stock Assessment
- 14.2.3.6. Others
- 14.2.4. Disaster Management
- 14.2.4.1. Flood Mapping
- 14.2.4.2. Earthquake Damage Assessment
- 14.2.4.3. Landslide Monitoring
- 14.2.4.4. Hurricane/Cyclone Tracking
- 14.2.4.5. Emergency Response Planning
- 14.2.4.6. Others
- 14.2.5. Oil & Gas
- 14.2.5.1. Pipeline Monitoring
- 14.2.5.2. Offshore Platform Surveillance
- 14.2.5.3. Oil Spill Detection
- 14.2.5.4. Exploration Support
- 14.2.5.5. Infrastructure Inspection
- 14.2.5.6. Others
- 14.2.6. Mining
- 14.2.6.1. Geological Mapping
- 14.2.6.2. Ground Deformation Monitoring
- 14.2.6.3. Exploration Activities
- 14.2.6.4. Tailing Dam Monitoring
- 14.2.6.5. Site Planning
- 14.2.6.6. Others
- 14.2.7. Maritime & Oceanography
- 14.2.7.1. Ship Detection & Tracking
- 14.2.7.2. Ocean Current Mapping
- 14.2.7.3. Sea Ice Monitoring
- 14.2.7.4. Wave Height Measurement
- 14.2.7.5. Coastal Zone Management
- 14.2.7.6. Others
- 14.2.8. Infrastructure & Construction
- 14.2.8.1. Structural Health Monitoring
- 14.2.8.2. Subsidence Detection
- 14.2.8.3. Urban Planning
- 14.2.8.4. Transportation Network Monitoring
- 14.2.8.5. Construction Site Surveillance
- 14.2.8.6. Others
- 14.2.9. Forestry
- 14.2.9.1. Forest Inventory
- 14.2.9.2. Biomass Estimation
- 14.2.9.3. Illegal Logging Detection
- 14.2.9.4. Fire Risk Assessment
- 14.2.9.5. Vegetation Classification
- 14.2.9.6. Others
- 14.2.10. Hydrology
- 14.2.10.1. Water Body Mapping
- 14.2.10.2. Wetland Monitoring
- 14.2.10.3. Snow Cover Analysis
- 14.2.10.4. Glacier Movement Tracking
- 14.2.10.5. Flood Risk Assessment
- 14.2.10.6. Others
- 14.2.11. Aerospace & Aviation
- 14.2.11.1. Terrain Mapping
- 14.2.11.2. Airport Surveillance
- 14.2.11.3. Flight Path Planning
- 14.2.11.4. Navigation Support
- 14.2.11.5. Others
- 14.2.12. Academic & Research
- 14.2.12.1. Climate Change Studies
- 14.2.12.2. Geophysical Research
- 14.2.12.3. Remote Sensing Applications
- 14.2.12.4. Algorithm Development
- 14.2.12.5. Others
- 14.2.1. Defense & Military
- 15. Global Synthetic Aperture Radar Market Analysis and Forecasts, by Region
- 15.1. Key Findings
- 15.2. Synthetic Aperture Radar Market Size (Volume - Million Units and Value - US$ Bn), Analysis, and Forecasts, by Region, 2021-2035
- 15.2.1. North America
- 15.2.2. Europe
- 15.2.3. Asia Pacific
- 15.2.4. Middle East
- 15.2.5. Africa
- 15.2.6. South America
- 16. North America Synthetic Aperture Radar Market Analysis
- 16.1. Key Segment Analysis
- 16.2. Regional Snapshot
- 16.3. North America Synthetic Aperture Radar Market Size (Volume - Million Units and Value - US$ Bn), Analysis, and Forecasts, 2021-2035
- 16.3.1. Platform Type
- 16.3.2. Frequency Band
- 16.3.3. Mode of Operation
- 16.3.4. Imaging Type
- 16.3.5. Antenna Type
- 16.3.6. Component
- 16.3.7. Polarization
- 16.3.8. Product Type
- 16.3.9. End-Use X Applications
- 16.3.10. Country
- 16.3.10.1. USA
- 16.3.10.2. Canada
- 16.3.10.3. Mexico
- 16.4. USA Synthetic Aperture Radar Market
- 16.4.1. Country Segmental Analysis
- 16.4.2. Platform Type
- 16.4.3. Frequency Band
- 16.4.4. Mode of Operation
- 16.4.5. Imaging Type
- 16.4.6. Antenna Type
- 16.4.7. Component
- 16.4.8. Polarization
- 16.4.9. Product Type
- 16.4.10. End-Use X Applications
- 16.5. Canada Synthetic Aperture Radar Market
- 16.5.1. Country Segmental Analysis
- 16.5.2. Platform Type
- 16.5.3. Frequency Band
- 16.5.4. Mode of Operation
- 16.5.5. Imaging Type
- 16.5.6. Antenna Type
- 16.5.7. Component
- 16.5.8. Polarization
- 16.5.9. Product Type
- 16.5.10. End-Use X Applications
- 16.6. Mexico Synthetic Aperture Radar Market
- 16.6.1. Country Segmental Analysis
- 16.6.2. Platform Type
- 16.6.3. Frequency Band
- 16.6.4. Mode of Operation
- 16.6.5. Imaging Type
- 16.6.6. Antenna Type
- 16.6.7. Component
- 16.6.8. Polarization
- 16.6.9. Product Type
- 16.6.10. End-Use X Applications
- 17. Europe Synthetic Aperture Radar Market Analysis
- 17.1. Key Segment Analysis
- 17.2. Regional Snapshot
- 17.3. Europe Synthetic Aperture Radar Market Size (Volume - Million Units and Value - US$ Bn), Analysis, and Forecasts, 2021-2035
- 17.3.1. Platform Type
- 17.3.2. Frequency Band
- 17.3.3. Mode of Operation
- 17.3.4. Imaging Type
- 17.3.5. Antenna Type
- 17.3.6. Component
- 17.3.7. Polarization
- 17.3.8. Product Type
- 17.3.9. End-Use X Applications
- 17.3.10. Country
- 17.3.10.1. Germany
- 17.3.10.2. United Kingdom
- 17.3.10.3. France
- 17.3.10.4. Italy
- 17.3.10.5. Spain
- 17.3.10.6. Netherlands
- 17.3.10.7. Nordic Countries
- 17.3.10.8. Poland
- 17.3.10.9. Russia & CIS
- 17.3.10.10. Rest of Europe
- 17.4. Germany Synthetic Aperture Radar Market
- 17.4.1. Country Segmental Analysis
- 17.4.2. Platform Type
- 17.4.3. Frequency Band
- 17.4.4. Mode of Operation
- 17.4.5. Imaging Type
- 17.4.6. Antenna Type
- 17.4.7. Component
- 17.4.8. Polarization
- 17.4.9. Product Type
- 17.4.10. End-Use X Applications
- 17.5. United Kingdom Synthetic Aperture Radar Market
- 17.5.1. Country Segmental Analysis
- 17.5.2. Platform Type
- 17.5.3. Frequency Band
- 17.5.4. Mode of Operation
- 17.5.5. Imaging Type
- 17.5.6. Antenna Type
- 17.5.7. Component
- 17.5.8. Polarization
- 17.5.9. Product Type
- 17.5.10. End-Use X Applications
- 17.6. France Synthetic Aperture Radar Market
- 17.6.1. Country Segmental Analysis
- 17.6.2. Platform Type
- 17.6.3. Frequency Band
- 17.6.4. Mode of Operation
- 17.6.5. Imaging Type
- 17.6.6. Antenna Type
- 17.6.7. Component
- 17.6.8. Polarization
- 17.6.9. Product Type
- 17.6.10. End-Use X Applications
- 17.7. Italy Synthetic Aperture Radar Market
- 17.7.1. Country Segmental Analysis
- 17.7.2. Platform Type
- 17.7.3. Frequency Band
- 17.7.4. Mode of Operation
- 17.7.5. Imaging Type
- 17.7.6. Antenna Type
- 17.7.7. Component
- 17.7.8. Polarization
- 17.7.9. Product Type
- 17.7.10. End-Use X Applications
- 17.8. Spain Synthetic Aperture Radar Market
- 17.8.1. Country Segmental Analysis
- 17.8.2. Platform Type
- 17.8.3. Frequency Band
- 17.8.4. Mode of Operation
- 17.8.5. Imaging Type
- 17.8.6. Antenna Type
- 17.8.7. Component
- 17.8.8. Polarization
- 17.8.9. Product Type
- 17.8.10. End-Use X Applications
- 17.9. Netherlands Synthetic Aperture Radar Market
- 17.9.1. Country Segmental Analysis
- 17.9.2. Platform Type
- 17.9.3. Frequency Band
- 17.9.4. Mode of Operation
- 17.9.5. Imaging Type
- 17.9.6. Antenna Type
- 17.9.7. Component
- 17.9.8. Polarization
- 17.9.9. Product Type
- 17.9.10. End-Use X Applications
- 17.10. Nordic Countries Synthetic Aperture Radar Market
- 17.10.1. Country Segmental Analysis
- 17.10.2. Platform Type
- 17.10.3. Frequency Band
- 17.10.4. Mode of Operation
- 17.10.5. Imaging Type
- 17.10.6. Antenna Type
- 17.10.7. Component
- 17.10.8. Polarization
- 17.10.9. Product Type
- 17.10.10. End-Use X Applications
- 17.11. Poland Synthetic Aperture Radar Market
- 17.11.1. Country Segmental Analysis
- 17.11.2. Platform Type
- 17.11.3. Frequency Band
- 17.11.4. Mode of Operation
- 17.11.5. Imaging Type
- 17.11.6. Antenna Type
- 17.11.7. Component
- 17.11.8. Polarization
- 17.11.9. Product Type
- 17.11.10. End-Use X Applications
- 17.12. Russia & CIS Synthetic Aperture Radar Market
- 17.12.1. Country Segmental Analysis
- 17.12.2. Platform Type
- 17.12.3. Frequency Band
- 17.12.4. Mode of Operation
- 17.12.5. Imaging Type
- 17.12.6. Antenna Type
- 17.12.7. Component
- 17.12.8. Polarization
- 17.12.9. Product Type
- 17.12.10. End-Use X Applications
- 17.13. Rest of Europe Synthetic Aperture Radar Market
- 17.13.1. Country Segmental Analysis
- 17.13.2. Platform Type
- 17.13.3. Frequency Band
- 17.13.4. Mode of Operation
- 17.13.5. Imaging Type
- 17.13.6. Antenna Type
- 17.13.7. Component
- 17.13.8. Polarization
- 17.13.9. Product Type
- 17.13.10. End-Use X Applications
- 18. Asia Pacific Synthetic Aperture Radar Market Analysis
- 18.1. Key Segment Analysis
- 18.2. Regional Snapshot
- 18.3. Asia Pacific Synthetic Aperture Radar Market Size (Volume - Million Units and Value - US$ Bn), Analysis, and Forecasts, 2021-2035
- 18.3.1. Platform Type
- 18.3.2. Frequency Band
- 18.3.3. Mode of Operation
- 18.3.4. Imaging Type
- 18.3.5. Antenna Type
- 18.3.6. Component
- 18.3.7. Polarization
- 18.3.8. Product Type
- 18.3.9. End-Use X Applications
- 18.3.10. Country
- 18.3.10.1. China
- 18.3.10.2. India
- 18.3.10.3. Japan
- 18.3.10.4. South Korea
- 18.3.10.5. Australia and New Zealand
- 18.3.10.6. Indonesia
- 18.3.10.7. Malaysia
- 18.3.10.8. Thailand
- 18.3.10.9. Vietnam
- 18.3.10.10. Rest of Asia Pacific
- 18.4. China Synthetic Aperture Radar Market
- 18.4.1. Country Segmental Analysis
- 18.4.2. Platform Type
- 18.4.3. Frequency Band
- 18.4.4. Mode of Operation
- 18.4.5. Imaging Type
- 18.4.6. Antenna Type
- 18.4.7. Component
- 18.4.8. Polarization
- 18.4.9. Product Type
- 18.4.10. End-Use X Applications
- 18.5. India Synthetic Aperture Radar Market
- 18.5.1. Country Segmental Analysis
- 18.5.2. Platform Type
- 18.5.3. Frequency Band
- 18.5.4. Mode of Operation
- 18.5.5. Imaging Type
- 18.5.6. Antenna Type
- 18.5.7. Component
- 18.5.8. Polarization
- 18.5.9. Product Type
- 18.5.10. End-Use X Applications
- 18.6. Japan Synthetic Aperture Radar Market
- 18.6.1. Country Segmental Analysis
- 18.6.2. Platform Type
- 18.6.3. Frequency Band
- 18.6.4. Mode of Operation
- 18.6.5. Imaging Type
- 18.6.6. Antenna Type
- 18.6.7. Component
- 18.6.8. Polarization
- 18.6.9. Product Type
- 18.6.10. End-Use X Applications
- 18.7. South Korea Synthetic Aperture Radar Market
- 18.7.1. Country Segmental Analysis
- 18.7.2. Platform Type
- 18.7.3. Frequency Band
- 18.7.4. Mode of Operation
- 18.7.5. Imaging Type
- 18.7.6. Antenna Type
- 18.7.7. Component
- 18.7.8. Polarization
- 18.7.9. Product Type
- 18.7.10. End-Use X Applications
- 18.8. Australia and New Zealand Synthetic Aperture Radar Market
- 18.8.1. Country Segmental Analysis
- 18.8.2. Platform Type
- 18.8.3. Frequency Band
- 18.8.4. Mode of Operation
- 18.8.5. Imaging Type
- 18.8.6. Antenna Type
- 18.8.7. Component
- 18.8.8. Polarization
- 18.8.9. Product Type
- 18.8.10. End-Use X Applications
- 18.9. Indonesia Synthetic Aperture Radar Market
- 18.9.1. Country Segmental Analysis
- 18.9.2. Platform Type
- 18.9.3. Frequency Band
- 18.9.4. Mode of Operation
- 18.9.5. Imaging Type
- 18.9.6. Antenna Type
- 18.9.7. Component
- 18.9.8. Polarization
- 18.9.9. Product Type
- 18.9.10. End-Use X Applications
- 18.10. Malaysia Synthetic Aperture Radar Market
- 18.10.1. Country Segmental Analysis
- 18.10.2. Platform Type
- 18.10.3. Frequency Band
- 18.10.4. Mode of Operation
- 18.10.5. Imaging Type
- 18.10.6. Antenna Type
- 18.10.7. Component
- 18.10.8. Polarization
- 18.10.9. Product Type
- 18.10.10. End-Use X Applications
- 18.11. Thailand Synthetic Aperture Radar Market
- 18.11.1. Country Segmental Analysis
- 18.11.2. Platform Type
- 18.11.3. Frequency Band
- 18.11.4. Mode of Operation
- 18.11.5. Imaging Type
- 18.11.6. Antenna Type
- 18.11.7. Component
- 18.11.8. Polarization
- 18.11.9. Product Type
- 18.11.10. End-Use X Applications
- 18.12. Vietnam Synthetic Aperture Radar Market
- 18.12.1. Country Segmental Analysis
- 18.12.2. Platform Type
- 18.12.3. Frequency Band
- 18.12.4. Mode of Operation
- 18.12.5. Imaging Type
- 18.12.6. Antenna Type
- 18.12.7. Component
- 18.12.8. Polarization
- 18.12.9. Product Type
- 18.12.10. End-Use X Applications
- 18.13. Rest of Asia Pacific Synthetic Aperture Radar Market
- 18.13.1. Country Segmental Analysis
- 18.13.2. Platform Type
- 18.13.3. Frequency Band
- 18.13.4. Mode of Operation
- 18.13.5. Imaging Type
- 18.13.6. Antenna Type
- 18.13.7. Component
- 18.13.8. Polarization
- 18.13.9. Product Type
- 18.13.10. End-Use X Applications
- 19. Middle East Synthetic Aperture Radar Market Analysis
- 19.1. Key Segment Analysis
- 19.2. Regional Snapshot
- 19.3. Middle East Synthetic Aperture Radar Market Size (Volume - Million Units and Value - US$ Bn), Analysis, and Forecasts, 2021-2035
- 19.3.1. Platform Type
- 19.3.2. Frequency Band
- 19.3.3. Mode of Operation
- 19.3.4. Imaging Type
- 19.3.5. Antenna Type
- 19.3.6. Component
- 19.3.7. Polarization
- 19.3.8. Product Type
- 19.3.9. End-Use X Applications
- 19.3.10. Country
- 19.3.10.1. Turkey
- 19.3.10.2. UAE
- 19.3.10.3. Saudi Arabia
- 19.3.10.4. Israel
- 19.3.10.5. Rest of Middle East
- 19.4. Turkey Synthetic Aperture Radar Market
- 19.4.1. Country Segmental Analysis
- 19.4.2. Platform Type
- 19.4.3. Frequency Band
- 19.4.4. Mode of Operation
- 19.4.5. Imaging Type
- 19.4.6. Antenna Type
- 19.4.7. Component
- 19.4.8. Polarization
- 19.4.9. Product Type
- 19.4.10. End-Use X Applications
- 19.5. UAE Synthetic Aperture Radar Market
- 19.5.1. Country Segmental Analysis
- 19.5.2. Platform Type
- 19.5.3. Frequency Band
- 19.5.4. Mode of Operation
- 19.5.5. Imaging Type
- 19.5.6. Antenna Type
- 19.5.7. Component
- 19.5.8. Polarization
- 19.5.9. Product Type
- 19.5.10. End-Use X Applications
- 19.6. Saudi Arabia Synthetic Aperture Radar Market
- 19.6.1. Country Segmental Analysis
- 19.6.2. Platform Type
- 19.6.3. Frequency Band
- 19.6.4. Mode of Operation
- 19.6.5. Imaging Type
- 19.6.6. Antenna Type
- 19.6.7. Component
- 19.6.8. Polarization
- 19.6.9. Product Type
- 19.6.10. End-Use X Applications
- 19.7. Israel Synthetic Aperture Radar Market
- 19.7.1. Country Segmental Analysis
- 19.7.2. Platform Type
- 19.7.3. Frequency Band
- 19.7.4. Mode of Operation
- 19.7.5. Imaging Type
- 19.7.6. Antenna Type
- 19.7.7. Component
- 19.7.8. Polarization
- 19.7.9. Product Type
- 19.7.10. End-Use X Applications
- 19.8. Rest of Middle East Synthetic Aperture Radar Market
- 19.8.1. Country Segmental Analysis
- 19.8.2. Platform Type
- 19.8.3. Frequency Band
- 19.8.4. Mode of Operation
- 19.8.5. Imaging Type
- 19.8.6. Antenna Type
- 19.8.7. Component
- 19.8.8. Polarization
- 19.8.9. Product Type
- 19.8.10. End-Use X Applications
- 20. Africa Synthetic Aperture Radar Market Analysis
- 20.1. Key Segment Analysis
- 20.2. Regional Snapshot
- 20.3. Africa Synthetic Aperture Radar Market Size (Volume - Million Units and Value - US$ Bn), Analysis, and Forecasts, 2021-2035
- 20.3.1. Platform Type
- 20.3.2. Frequency Band
- 20.3.3. Mode of Operation
- 20.3.4. Imaging Type
- 20.3.5. Antenna Type
- 20.3.6. Component
- 20.3.7. Polarization
- 20.3.8. Product Type
- 20.3.9. End-Use X Applications
- 20.3.10. Country
- 20.3.10.1. South Africa
- 20.3.10.2. Egypt
- 20.3.10.3. Nigeria
- 20.3.10.4. Algeria
- 20.3.10.5. Rest of Africa
- 20.4. South Africa Synthetic Aperture Radar Market
- 20.4.1. Country Segmental Analysis
- 20.4.2. Platform Type
- 20.4.3. Frequency Band
- 20.4.4. Mode of Operation
- 20.4.5. Imaging Type
- 20.4.6. Antenna Type
- 20.4.7. Component
- 20.4.8. Polarization
- 20.4.9. Product Type
- 20.4.10. End-Use X Applications
- 20.5. Egypt Synthetic Aperture Radar Market
- 20.5.1. Country Segmental Analysis
- 20.5.2. Platform Type
- 20.5.3. Frequency Band
- 20.5.4. Mode of Operation
- 20.5.5. Imaging Type
- 20.5.6. Antenna Type
- 20.5.7. Component
- 20.5.8. Polarization
- 20.5.9. Product Type
- 20.5.10. End-Use X Applications
- 20.6. Nigeria Synthetic Aperture Radar Market
- 20.6.1. Country Segmental Analysis
- 20.6.2. Platform Type
- 20.6.3. Frequency Band
- 20.6.4. Mode of Operation
- 20.6.5. Imaging Type
- 20.6.6. Antenna Type
- 20.6.7. Component
- 20.6.8. Polarization
- 20.6.9. Product Type
- 20.6.10. End-Use X Applications
- 20.7. Algeria Synthetic Aperture Radar Market
- 20.7.1. Country Segmental Analysis
- 20.7.2. Platform Type
- 20.7.3. Frequency Band
- 20.7.4. Mode of Operation
- 20.7.5. Imaging Type
- 20.7.6. Antenna Type
- 20.7.7. Component
- 20.7.8. Polarization
- 20.7.9. Product Type
- 20.7.10. End-Use X Applications
- 20.8. Rest of Africa Synthetic Aperture Radar Market
- 20.8.1. Country Segmental Analysis
- 20.8.2. Platform Type
- 20.8.3. Frequency Band
- 20.8.4. Mode of Operation
- 20.8.5. Imaging Type
- 20.8.6. Antenna Type
- 20.8.7. Component
- 20.8.8. Polarization
- 20.8.9. Product Type
- 20.8.10. End-Use X Applications
- 21. South America Synthetic Aperture Radar Market Analysis
- 21.1. Key Segment Analysis
- 21.2. Regional Snapshot
- 21.3. South America Synthetic Aperture Radar Market Size (Volume - Million Units and Value - US$ Bn), Analysis, and Forecasts, 2021-2035
- 21.3.1. Platform Type
- 21.3.2. Frequency Band
- 21.3.3. Mode of Operation
- 21.3.4. Imaging Type
- 21.3.5. Antenna Type
- 21.3.6. Component
- 21.3.7. Polarization
- 21.3.8. Product Type
- 21.3.9. End-Use X Applications
- 21.3.10. Country
- 21.3.10.1. Brazil
- 21.3.10.2. Argentina
- 21.3.10.3. Rest of South America
- 21.4. Brazil Synthetic Aperture Radar Market
- 21.4.1. Country Segmental Analysis
- 21.4.2. Platform Type
- 21.4.3. Frequency Band
- 21.4.4. Mode of Operation
- 21.4.5. Imaging Type
- 21.4.6. Antenna Type
- 21.4.7. Component
- 21.4.8. Polarization
- 21.4.9. Product Type
- 21.4.10. End-Use X Applications
- 21.5. Argentina Synthetic Aperture Radar Market
- 21.5.1. Country Segmental Analysis
- 21.5.2. Platform Type
- 21.5.3. Frequency Band
- 21.5.4. Mode of Operation
- 21.5.5. Imaging Type
- 21.5.6. Antenna Type
- 21.5.7. Component
- 21.5.8. Polarization
- 21.5.9. Product Type
- 21.5.10. End-Use X Applications
- 21.6. Rest of South America Synthetic Aperture Radar Market
- 21.6.1. Country Segmental Analysis
- 21.6.2. Platform Type
- 21.6.3. Frequency Band
- 21.6.4. Mode of Operation
- 21.6.5. Imaging Type
- 21.6.6. Antenna Type
- 21.6.7. Component
- 21.6.8. Polarization
- 21.6.9. Product Type
- 21.6.10. End-Use X Applications
- 22. Key Players/ Company Profile
- 22.1. Airbus Defence and Space
- 22.1.1. Company Details/ Overview
- 22.1.2. Company Financials
- 22.1.3. Key Customers and Competitors
- 22.1.4. Business/ Industry Portfolio
- 22.1.5. Product Portfolio/ Specification Details
- 22.1.6. Pricing Data
- 22.1.7. Strategic Overview
- 22.1.8. Recent Developments
- 22.2. ASELSAN A.Ş.
- 22.3. BAE Systems plc
- 22.4. Capella Space
- 22.5. Elbit Systems Ltd.
- 22.6. General Atomics
- 22.7. ICEYE
- 22.8. IMSAR LLC
- 22.9. Israel Aerospace Industries (IAI)
- 22.10. L3Harris Technologies
- 22.11. Leonardo S.p.A.
- 22.12. Lockheed Martin Corporation
- 22.13. Maxar Technologies
- 22.14. MDA Corporation
- 22.15. Northrop Grumman Corporation
- 22.16. Raytheon Technologies Corporation
- 22.17. Saab AB
- 22.18. Sandia National Laboratories
- 22.19. SRC Inc.
- 22.20. Synspective Inc.
- 22.21. Telephonics Corporation
- 22.22. Terma A/S
- 22.23. Thales Group
- 22.24. Umbra Lab
- 22.25. Other Key Players
- 22.1. Airbus Defence and Space
Note* - This is just tentative list of players. While providing the report, we will cover more number of players based on their revenue and share for each geography
Research Design
Our research design integrates both demand-side and supply-side analysis through a balanced combination of primary and secondary research methodologies. By utilizing both bottom-up and top-down approaches alongside rigorous data triangulation methods, we deliver robust market intelligence that supports strategic decision-making.
MarketGenics' comprehensive research design framework ensures the delivery of accurate, reliable, and actionable market intelligence. Through the integration of multiple research approaches, rigorous validation processes, and expert analysis, we provide our clients with the insights needed to make informed strategic decisions and capitalize on market opportunities.

MarketGenics leverages a dedicated industry panel of experts and a comprehensive suite of paid databases to effectively collect, consolidate, and analyze market intelligence.
Our approach has consistently proven to be reliable and effective in generating accurate market insights, identifying key industry trends, and uncovering emerging business opportunities.
Through both primary and secondary research, we capture and analyze critical company-level data such as manufacturing footprints, including technical centers, R&D facilities, sales offices, and headquarters.
Our expert panel further enhances our ability to estimate market size for specific brands based on validated field-level intelligence.
Our data mining techniques incorporate both parametric and non-parametric methods, allowing for structured data collection, sorting, processing, and cleaning.
Demand projections are derived from large-scale data sets analyzed through proprietary algorithms, culminating in robust and reliable market sizing.
Research Approach
The bottom-up approach builds market estimates by starting with the smallest addressable market units and systematically aggregating them to create comprehensive market size projections.
This method begins with specific, granular data points and builds upward to create the complete market landscape.
Customer Analysis → Segmental Analysis → Geographical Analysis
The top-down approach starts with the broadest possible market data and systematically narrows it down through a series of filters and assumptions to arrive at specific market segments or opportunities.
This method begins with the big picture and works downward to increasingly specific market slices.
TAM → SAM → SOM


Research Methods
Desk / Secondary Research
While analysing the market, we extensively study secondary sources, directories, and databases to identify and collect information useful for this technical, market-oriented, and commercial report. Secondary sources that we utilize are not only the public sources, but it is a combination of Open Source, Associations, Paid Databases, MG Repository & Knowledgebase, and others.
- Company websites, annual reports, financial reports, broker reports, and investor presentations
- National government documents, statistical databases and reports
- News articles, press releases and web-casts specific to the companies operating in the market, Magazines, reports, and others
- We gather information from commercial data sources for deriving company specific data such as segmental revenue, share for geography, product revenue, and others
- Internal and external proprietary databases (industry-specific), relevant patent, and regulatory databases
- Governing Bodies, Government Organizations
- Relevant Authorities, Country-specific Associations for Industries
We also employ the model mapping approach to estimate the product level market data through the players' product portfolio
Primary Research
Primary research/ interviews is vital in analyzing the market. Most of the cases involves paid primary interviews. Primary sources include primary interviews through e-mail interactions, telephonic interviews, surveys as well as face-to-face interviews with the different stakeholders across the value chain including several industry experts.
| Type of Respondents | Number of Primaries |
|---|---|
| Tier 2/3 Suppliers | ~20 |
| Tier 1 Suppliers | ~25 |
| End-users | ~25 |
| Industry Expert/ Panel/ Consultant | ~30 |
| Total | ~100 |
MG Knowledgebase
• Repository of industry blog, newsletter and case studies
• Online platform covering detailed market reports, and company profiles
Forecasting Factors and Models
Forecasting Factors
- Historical Trends – Past market patterns, cycles, and major events that shaped how markets behave over time. Understanding past trends helps predict future behavior.
- Industry Factors – Specific characteristics of the industry like structure, regulations, and innovation cycles that affect market dynamics.
- Macroeconomic Factors – Economic conditions like GDP growth, inflation, and employment rates that affect how much money people have to spend.
- Demographic Factors – Population characteristics like age, income, and location that determine who can buy your product.
- Technology Factors – How quickly people adopt new technology and how much technology infrastructure exists.
- Regulatory Factors – Government rules, laws, and policies that can help or restrict market growth.
- Competitive Factors – Analyzing competition structure such as degree of competition and bargaining power of buyers and suppliers.
Forecasting Models / Techniques
Multiple Regression Analysis
- Identify and quantify factors that drive market changes
- Statistical modeling to establish relationships between market drivers and outcomes
Time Series Analysis – Seasonal Patterns
- Understand regular cyclical patterns in market demand
- Advanced statistical techniques to separate trend, seasonal, and irregular components
Time Series Analysis – Trend Analysis
- Identify underlying market growth patterns and momentum
- Statistical analysis of historical data to project future trends
Expert Opinion – Expert Interviews
- Gather deep industry insights and contextual understanding
- In-depth interviews with key industry stakeholders
Multi-Scenario Development
- Prepare for uncertainty by modeling different possible futures
- Creating optimistic, pessimistic, and most likely scenarios
Time Series Analysis – Moving Averages
- Sophisticated forecasting for complex time series data
- Auto-regressive integrated moving average models with seasonal components
Econometric Models
- Apply economic theory to market forecasting
- Sophisticated economic models that account for market interactions
Expert Opinion – Delphi Method
- Harness collective wisdom of industry experts
- Structured, multi-round expert consultation process
Monte Carlo Simulation
- Quantify uncertainty and probability distributions
- Thousands of simulations with varying input parameters
Research Analysis
Our research framework is built upon the fundamental principle of validating market intelligence from both demand and supply perspectives. This dual-sided approach ensures comprehensive market understanding and reduces the risk of single-source bias.
Demand-Side Analysis: We understand end-user/application behavior, preferences, and market needs along with the penetration of the product for specific application.
Supply-Side Analysis: We estimate overall market revenue, analyze the segmental share along with industry capacity, competitive landscape, and market structure.
Validation & Evaluation
Data triangulation is a validation technique that uses multiple methods, sources, or perspectives to examine the same research question, thereby increasing the credibility and reliability of research findings. In market research, triangulation serves as a quality assurance mechanism that helps identify and minimize bias, validate assumptions, and ensure accuracy in market estimates.
- Data Source Triangulation – Using multiple data sources to examine the same phenomenon
- Methodological Triangulation – Using multiple research methods to study the same research question
- Investigator Triangulation – Using multiple researchers or analysts to examine the same data
- Theoretical Triangulation – Using multiple theoretical perspectives to interpret the same data

Custom Market Research Services
We will customise the research for you, in case the report listed above does not meet your requirements.
Get 10% Free Customisation