Agricultural Data Analytics Market Size, Share & Trends Analysis Report by Component (Hardware, Software, Services), Technology, Data Source, Deployment Mode, Crop Type, Farm Size, Application, End-User, and Geography (North America, Europe, Asia Pacific, Middle East, Africa, and South America) – Global Industry Data, Trends, and Forecasts, 2026–2035
Market Overview:
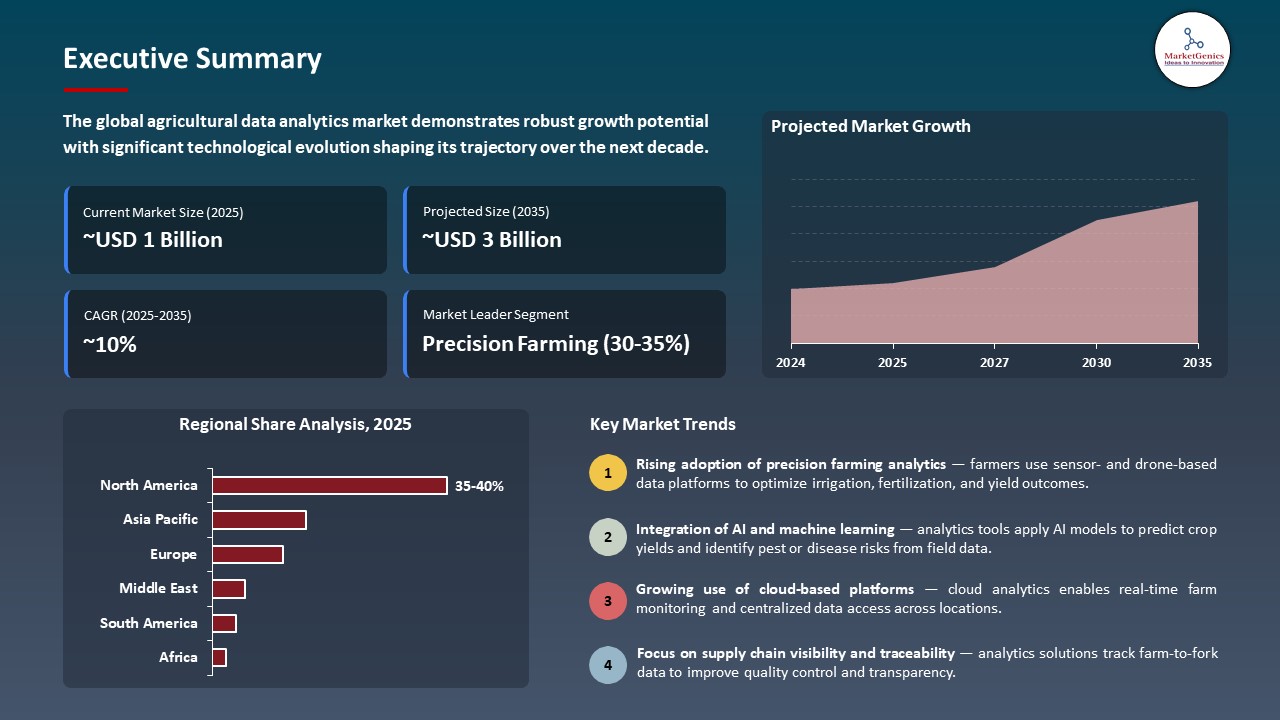
According to MarketGenics analysis only, the global agricultural data analytics market is witnessing strong growth, with an estimated valuation of USD 1.3 billion in 2025 and projected to reach USD 3.3 billion by 2035, achieving a CAGR of 9.7% during the forecast period.
|
|
|
Segmental Data Insights |
|
|
Demand Trends |
|
|
Competitive Landscape |
|
|
Strategic Development |
|
|
Future Outlook & Opportunities |
|
Agricultural Data Analytics Market Size, Share, and Growth
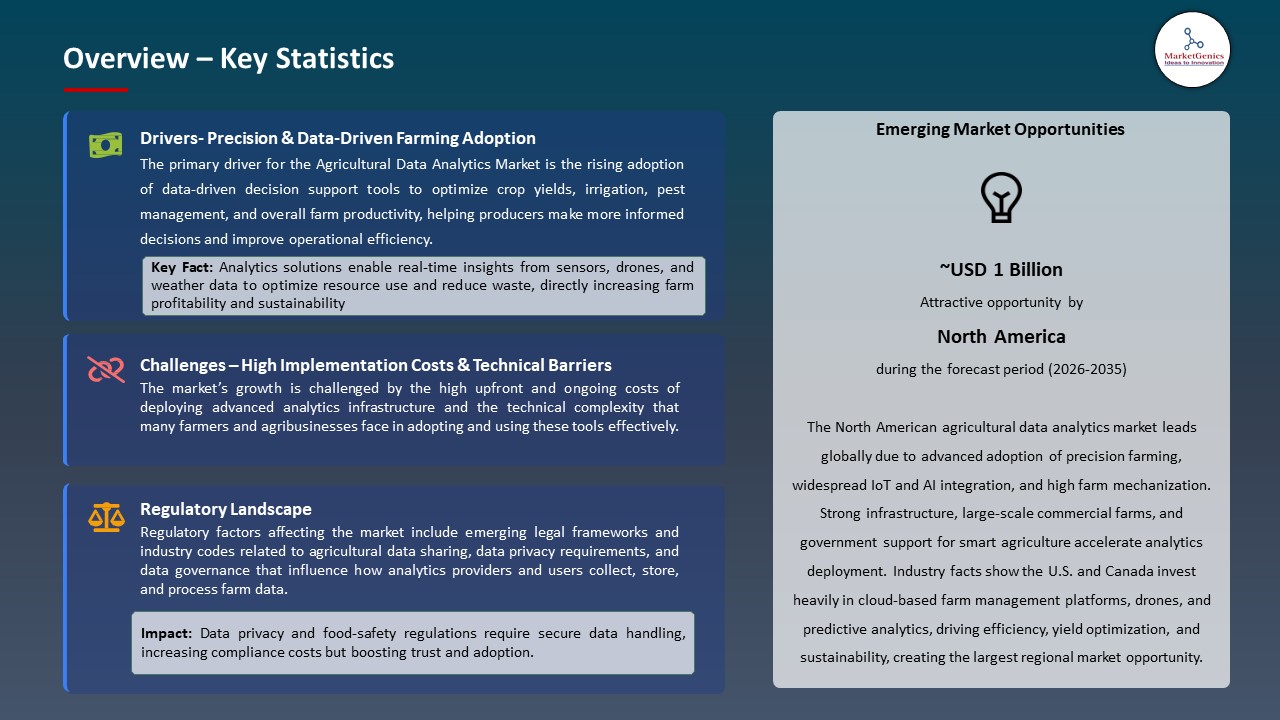
The global-agricultural-data-analytics market is driven by rising precision farming adoption, need for higher crop yields, climate variability, input cost optimization, and growing use of AI, IoT, and big data to enable data-driven, sustainable, and efficient farm decision-making.
"Farmers worldwide need technologies that support them to be more productive and profitable while minimizing the environmental impact of their operations," said Eric Hansotia, AGCO's Chairman, President and Chief Executive Officer. "PTx Trimble will provide farmers greater access to next-generation precision ag tools, no matter what brands of tractors and implements they operate."
The need to enhance their analytics offerings by acquiring key agri-equipment and solution vendors as well as fusing their platforms has accelerated the growth of agricultural data analytics market to provide end-to-end precision farming, real-time field insights, and data-driven operational optimization. For instance, in May 2025, John Deere purchased Sentera, a remote imagery and analytics company, supporting its precision agriculture technology through adding high-resolution aerial imagery to the John Deere Operations Center to generate more actionable and large-scale agronomic information. This driver enhances the implementation of data-driven agriculture and increases productivity, efficiency in operations, and scalability of large and mid-sized agricultural enterprises.
Moreover, growing partnerships between agricultural technology companies and AI/cloud providers are driving the agriculture data analytics market. These partnerships integrate machine learning-based analytics into farm management systems to enhance risk management, yield forecasting, and resource efficiency. For instance, IBM’s collaboration with the climate corporation leverages IBM Watson IoT to combine AI- and cloud-based analytics to improve the level of crop intelligence and the performance of farm operations. This driver enhances predictive correctness and large-scale decision-making that will accelerate and sustain increased productivity in global agriculture through the adoption of digital farm management.
Key adjacent opportunities to the global agricultural data analytics market include IoT-based farm equipment, drone and UAV services for crop monitoring, precision irrigation systems, climate-smart agri-solutions, and digital supply chain platforms. These industries are complementary to data analytics because they are promoting farm efficiency, predictive, and sustainability. The diversification into these market segments will increase market expansion and technology adoption in agriculture.
Agricultural Data Analytics Market Dynamics and Trends
Driver: Innovation Recognition for Advanced AI‑Powered Crop Analytics Platforms
-
The growing recognition and adoption of cutting-edge AI-driven crop intelligence platforms by leading agritech solution providers, which demonstrates their technological leadership, credibility, and strategic value in contemporary farming operations, is a major growth driver for the agricultural data analytics market.
- These platforms handle a wide ranging, multi-source set of data such as weather, soil, satellite images, and crop health indicators and recommendations to predictive insight, resource allocation optimization, and real time at scale decision-making. For instance, in August 2025, Bayer’s E.L.Y. system was named AI-based AgTech Solution of the Year, which applies generative AI to transform agronomic data into actionable insights, increase operational efficiency, and improve crop performance.
- This type of industry recognition is fast-tracking to build confidence and investment in AI-enabled analytics solutions, which would ensure further adoption by agricultural businesses and the establishment of the market as the driver of digital transformation in farming processes.
Restraint: Complexity of Integrating Diverse Data Sources Across Platforms
-
The complexity of combining various data streams from various sources, including soil and moisture sensors, satellite and drone imagery, weather stations, and machinery telemetry, into unified, interoperable analytics platforms is a major barrier to the agricultural data analytics market.
- Many solutions have compatibility and standardization challenges due to the disparity in data format, proprietary software and limited APIs, and thus need considerable customization and technical skills to ensure smooth insights. This is particularly acute in mixed fleet settings where managing equipment of different OEMs and maintaining the systems is a complex operation.
- The complexity of data integration is very high, which increases the cost and time of implementation, which limits the use of analytics solutions among farms that demand scalable and plug-and-play systems.
Opportunity: Expansion of AI‑Powered Precision Harvest and Crop Health Solutions by Major OEMs
-
A major market opportunity is in the development of AI-enabling accuracy harvesting, crop health surveillance and predictive field management systems by major original equipment manufacturers in the agricultural field, which means that additional data can be used and that additional value can be extracted out of conventional analytics solutions.
- OEMs are integrating sophisticated analytics into the working processes, improving yields and resource utilization and productivity of farms. For instance, in March 2025, Trimble released its AI-powered FarmLogs Pro, a new high-tech analytics system that combines satellite data with weather data and historical farm data to deliver real-time crop health analysis and field management advice.
- The combination of analytics in both machinery interfaces and enterprise farm management systems will allow manufacturers to provide differentiated, high-value products and enhance platform loyalty and longevity.
- OEM AI-centric analytics solutions increase application and use of technologies in the agricultural ecosystem, create new streams of revenue, and multiply the applicability of the market.
Key Trend: Convergence of Satellite Imagery and Predictive Analytics for Continuous Monitoring
-
The incorporation of high-resolution satellite imagery and predictive analytics models to assist with constant crop tracking, risk modeling, and large-scale operations planning is a major trend that is reshaping the agricultural data analytics landscape.
- The most popular agritech companies are increasing the application of the near-daily satellite data to their analytics systems to allow machine learning models to identify stress patterns and predict yield fluctuations, as well as ensure timely intervention throughout the crop cycle. For instance, in March 2025, Syngenta extended its partnership in the satellite imagery startup Planet to bring satellite imaging visualizations high-resolution, with almost daily frequencies, to its Cropwise digital agriculture system. It allows farmers to track the health of crops, identify pests and diseases and facilitates active and evidence-based decisions by combining geospatial and predictive analytics.
- Satellite-powered predictive analytics increase foresight and responsiveness in the operations, which also strengthens the strategic value of data analytics in the global agricultural operations.
 Agricultural Data Analytics Market Analysis and Segmental Data
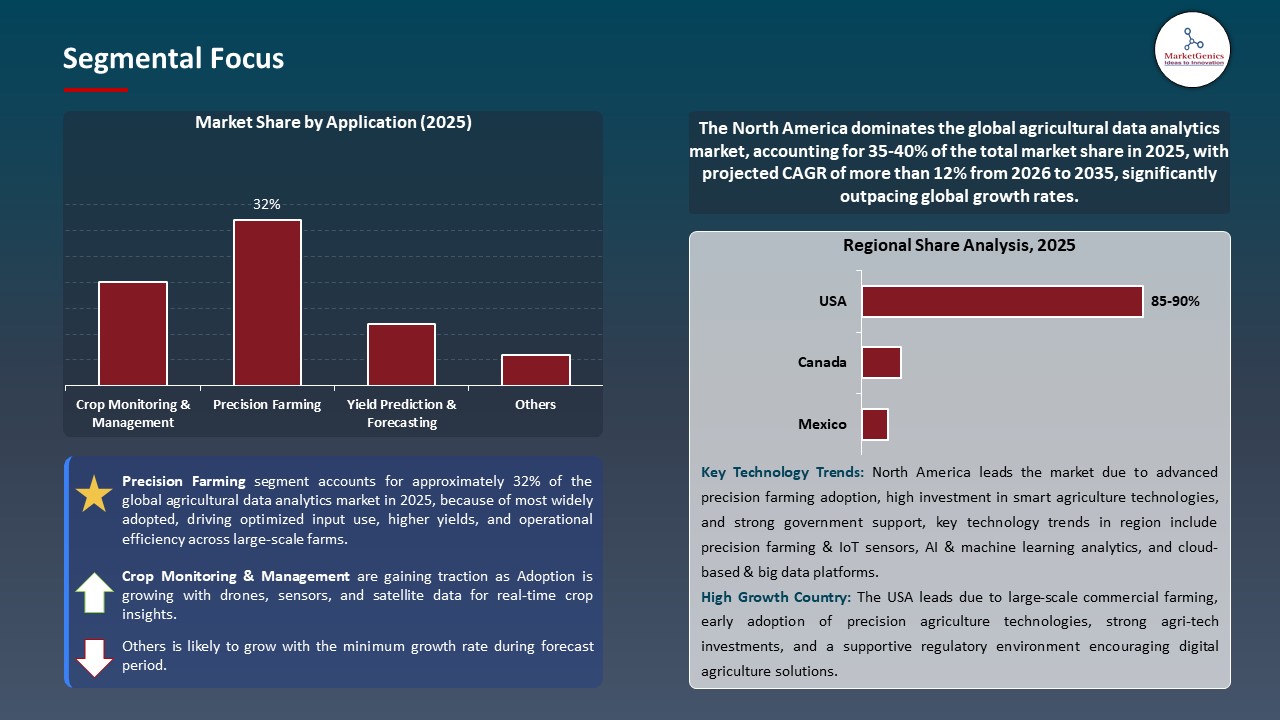
Precision Farming Dominate Global Agricultural Data Analytics Market
-
The precision farming segment dominates the global agricultural data analytics market, which is capable of transforming the massive, diversified data on the field into actionable information that is location-specific and that achieves operational efficiency, sustainability, and profitability. With the help of analytics, IoT sensors, GPS/GNSS, drones, and satellite imagery, precision farming can help growers keep track of soil, manage inputs, predict yields, and make informed decisions based on the data.
- This wealth of data flows directly to analytics platforms, which makes precision farming one of the key drivers of the agricultural analytics solutions. For instance, in November 2025, applications produced on the Cropwise platform of Syngenta will enable third-party developers to access AI agronomic models on 70 million hectares in 30+ countries to enable growers to customize precision farming tools and combine advanced analytics.
- The rise of precision farming increases the prevalence of analytics tools, expands the analytics platform use cases, and solidifies the central role of real-time data in contemporary agricultural decision-making.
North America Leads Global Agricultural Data Analytics Market Demand
-
North America leads the agricultural data analytics market is driven by widespread adoption of integrated farm management and agronomic analytics platforms developed by regional technology providers, which support data‑driven decision‑making across large‑scale operations.
- For instance, Granular Insights from Corteva Agriscience allows farmers to analyze field, satellite, and operational data, improving yield forecasting, input efficiency, and profitability, while integrating multiple equipment sources to accelerate precision farming adoption.
- Additionally, the major demand in North America is the introduction of new technologies to the OEM technologies in agriculture and the leading role of artificial intelligence and predictive analytics, to prove that analytics is essential in the daily farm management. For instance, John Deere’s Precision Ag Essentials and Operations Center enable farmers with the possibility to retrieve and analyze real-time data obtained on the connected equipment and optimize its work by planning it better and monitoring its performance.
- These drivers together contribute to the fact that North America is the biggest regional market as it will be able to adopt advanced analytics, enhance farm productivity, and become a global leader in data-oriented agriculture.
Agricultural Data Analytics Market Ecosystem
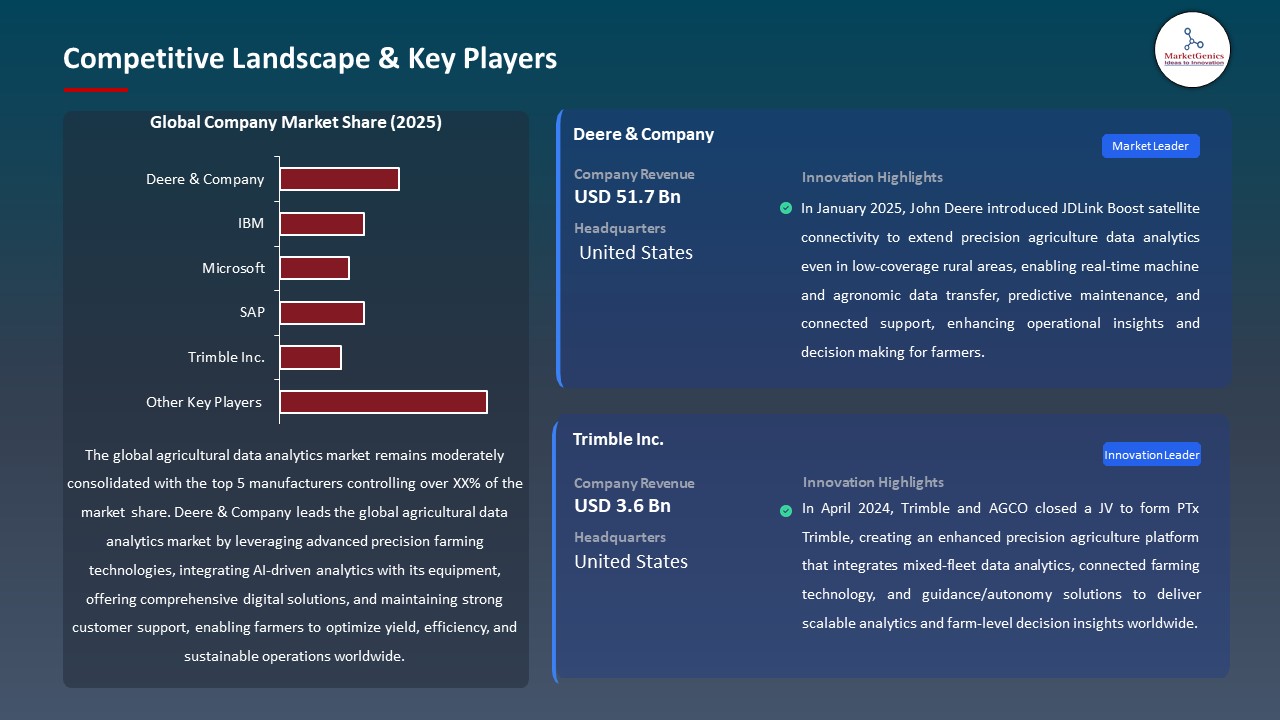
The global agricultural data analytics market is moderately consolidated, with leading players such as Deere & Company, IBM, Microsoft, SAP, and Trimble Inc. dominating through advanced technologies including AI, IoT, cloud computing, and machine learning–based analytics platforms. These firms capitalize on powerful digital ecosystems, hardware-software solutions, and international distribution channels to ensure that they hold a competitive edge and leadership in the market.
The major players are focused on niche and specialized solutions in order to advance innovation. Deere and Company have integrated analytics into the precision farming equipment in form of platforms such as Operations Center that provides field intelligence in real-time. Trimble Inc. focuses on data analytics of mixed fleets, GNSS guidance, and agronomic solutions, whereas IBM offers climate, weather, and agronomic data to its clients through its Environmental Intelligence Suite. Microsoft and SAP offer scalable cloud analytics solutions that can be used to integrate farm data and create digital twins as well as make decisions at the enterprise level.
Governmental agencies, research centers and research and development organizations are instrumental in promoting market capabilities. For instance, in June 2024 the U.S. Department of Agriculture (USDA) approved AI-driven precision agriculture research funding to finance data analytics tools to enhance yield forecasting, soil health monitoring, and climate resilience, and increase the adoption of such tools in large-scale farms.
This initiative significantly accelerated the adoption of agricultural data analytics by improving forecast accuracy, optimizing input usage, strengthening climate resilience, and enabling farmers to make data-driven decisions, ultimately enhancing farm productivity, sustainability outcomes, and long-term food security across the U.S. agricultural sector.
 Recent Development and Strategic Overview:
- In January 2026, SAP and Syngenta entered a strategic partnership to integrate AI and advanced analytics into Syngenta’s operations through SAP Business Data Cloud, strengthening data-driven decision-making across global supply chains and digital grower solutions.
- In November 2025, Microsoft partnered with Land O’Lakes to deploy an AI-enabled agronomic assistant built on Azure AI Foundry, providing access to two decades of crop and field data analytics to strengthen data-driven farm decision-making, operational efficiency, and cost optimization across agricultural operations.
Report Scope
|
Detail |
|
|
Market Size in 2025 |
USD 1.3 Bn |
|
Market Forecast Value in 2035 |
USD 3.3 Bn |
|
Growth Rate (CAGR) |
9.7% |
|
Forecast Period |
2026 – 2035 |
|
Historical Data Available for |
2021 – 2024 |
|
Market Size Units |
US$ Billion for Value |
|
Report Format |
Electronic (PDF) + Excel |
|
North America |
Europe |
Asia Pacific |
Middle East |
Africa |
South America |
|
|
|
|
|
|
|
Companies Covered |
|||||
|
|
|
|
|
|
Agricultural Data Analytics Market Segmentation and Highlights
|
Segment |
Sub-segment |
|
Agricultural Data Analytics Market, By Component |
|
|
Agricultural Data Analytics Market, By Technology |
|
|
Agricultural Data Analytics Market, By Data Source |
|
|
Agricultural Data Analytics Market, By Deployment Mode |
|
|
Agricultural Data Analytics Market, By Crop Type |
|
|
Agricultural Data Analytics Market, By Farm Size |
|
|
Agricultural Data Analytics Market, By Application |
|
|
Agricultural Data Analytics Market, By End-User |
|
Frequently Asked Questions
Table of Contents
- 1. Research Methodology and Assumptions
- 1.1. Definitions
- 1.2. Research Design and Approach
- 1.3. Data Collection Methods
- 1.4. Base Estimates and Calculations
- 1.5. Forecasting Models
- 1.5.1. Key Forecast Factors & Impact Analysis
- 1.6. Secondary Research
- 1.6.1. Open Sources
- 1.6.2. Paid Databases
- 1.6.3. Associations
- 1.7. Primary Research
- 1.7.1. Primary Sources
- 1.7.2. Primary Interviews with Stakeholders across Ecosystem
- 2. Executive Summary
- 2.1. Global Agricultural Data Analytics Market Outlook
- 2.1.1. Agricultural Data Analytics Market Size (Value - US$ Bn), and Forecasts, 2021-2035
- 2.1.2. Compounded Annual Growth Rate Analysis
- 2.1.3. Growth Opportunity Analysis
- 2.1.4. Segmental Share Analysis
- 2.1.5. Geographical Share Analysis
- 2.2. Market Analysis and Facts
- 2.3. Supply-Demand Analysis
- 2.4. Competitive Benchmarking
- 2.5. Go-to- Market Strategy
- 2.5.1. Customer/ End-use Industry Assessment
- 2.5.2. Growth Opportunity Data, 2026-2035
- 2.5.2.1. Regional Data
- 2.5.2.2. Country Data
- 2.5.2.3. Segmental Data
- 2.5.3. Identification of Potential Market Spaces
- 2.5.4. GAP Analysis
- 2.5.5. Potential Attractive Price Points
- 2.5.6. Prevailing Market Risks & Challenges
- 2.5.7. Preferred Sales & Marketing Strategies
- 2.5.8. Key Recommendations and Analysis
- 2.5.9. A Way Forward
- 2.1. Global Agricultural Data Analytics Market Outlook
- 3. Industry Data and Premium Insights
- 3.1. Global Agriculture Industry Overview, 2025
- 3.1.1. Agriculture Ecosystem Analysis
- 3.1.2. Key Trends for Agriculture Industry
- 3.1.3. Regional Distribution for Agriculture Industry
- 3.2. Supplier Customer Data
- 3.3. Technology Roadmap and Developments
- 3.4. Trade Analysis
- 3.4.1. Import & Export Analysis, 2025
- 3.4.2. Top Importing Countries
- 3.4.3. Top Exporting Countries
- 3.5. Trump Tariff Impact Analysis
- 3.5.1. Manufacturer
- 3.5.1.1. Based on the component & Raw material
- 3.5.2. Supply Chain
- 3.5.3. End Consumer
- 3.5.1. Manufacturer
- 3.6. Raw Material Analysis
- 3.1. Global Agriculture Industry Overview, 2025
- 4. Market Overview
- 4.1. Market Dynamics
- 4.1.1. Drivers
- 4.1.1.1. Growing need to improve crop yields and farm productivity amid rising global food demand
- 4.1.1.2. Increasing adoption of precision farming, IoT, AI, and cloud-based analytics
- 4.1.1.3. Government support and initiatives promoting digital and smart agriculture
- 4.1.2. Restraints
- 4.1.2.1. High implementation and maintenance costs, especially for small farmers
- 4.1.2.2. Data privacy, security concerns, and limited technical expertise
- 4.1.1. Drivers
- 4.2. Key Trend Analysis
- 4.3. Regulatory Framework
- 4.3.1. Key Regulations, Norms, and Subsidies, by Key Countries
- 4.3.2. Tariffs and Standards
- 4.3.3. Impact Analysis of Regulations on the Market
- 4.4. Ecosystem Analysis
- 4.5. Porter’s Five Forces Analysis
- 4.6. PESTEL Analysis
- 4.7. Global Agricultural Data Analytics Market Demand
- 4.7.1. Historical Market Size – in Value (US$ Bn), 2020-2024
- 4.7.2. Current and Future Market Size – in Value (US$ Bn), 2026–2035
- 4.7.2.1. Y-o-Y Growth Trends
- 4.7.2.2. Absolute $ Opportunity Assessment
- 4.1. Market Dynamics
- 5. Competition Landscape
- 5.1. Competition structure
- 5.1.1. Fragmented v/s consolidated
- 5.2. Company Share Analysis, 2025
- 5.2.1. Global Company Market Share
- 5.2.2. By Region
- 5.2.2.1. North America
- 5.2.2.2. Europe
- 5.2.2.3. Asia Pacific
- 5.2.2.4. Middle East
- 5.2.2.5. Africa
- 5.2.2.6. South America
- 5.3. Product Comparison Matrix
- 5.3.1. Specifications
- 5.3.2. Market Positioning
- 5.3.3. Pricing
- 5.1. Competition structure
- 6. Global Agricultural Data Analytics Market Analysis, by Component
- 6.1. Key Segment Analysis
- 6.2. Agricultural Data Analytics Market Size (Value - US$ Bn), Analysis, and Forecasts, Component, 2021-2035
- 6.2.1. Hardware
- 6.2.1.1. IoT Sensors & Actuators
- 6.2.1.1.1. Soil Sensors (moisture, pH, nutrients)
- 6.2.1.1.2. Weather & Climate Sensors
- 6.2.1.1.3. Crop Health & NDVI Sensors
- 6.2.1.1.4. Others
- 6.2.1.2. UAVs / Drones
- 6.2.1.2.1. Multispectral Cameras
- 6.2.1.2.2. Hyperspectral Cameras
- 6.2.1.2.3. Thermal Cameras
- 6.2.1.2.4. Others
- 6.2.1.3. Edge Devices & Gateways
- 6.2.1.4. GPS / GNSS Devices
- 6.2.1.5. Farm Machinery Telematics Devices
- 6.2.1.6. Others
- 6.2.1.1. IoT Sensors & Actuators
- 6.2.2. Software
- 6.2.2.1. Farm Management Software (FMS)
- 6.2.2.2. Data Analytics Platforms
- 6.2.2.3. Predictive Analytics Tools
- 6.2.2.4. Prescriptive Analytics Tools
- 6.2.2.5. Machine Learning / AI Applications
- 6.2.2.6. Visualization & Reporting Tools
- 6.2.2.7. Decision Support Systems (DSS)
- 6.2.2.8. Mobile & Web Applications
- 6.2.2.9. Others
- 6.2.3. Services
- 6.2.3.1. Consulting & Advisory Services
- 6.2.3.2. System Integration & Deployment
- 6.2.3.3. Training & Education
- 6.2.3.4. Maintenance & Support Services
- 6.2.3.5. Remote Monitoring & Managed Services
- 6.2.3.6. Others
- 6.2.1. Hardware
- 7. Global Agricultural Data Analytics Market Analysis, by Technology
- 7.1. Key Segment Analysis
- 7.2. Agricultural Data Analytics Market Size (Value - US$ Bn), Analysis, and Forecasts, by Technology, 2021-2035
- 7.2.1. Predictive Analytics
- 7.2.2. Descriptive Analytics
- 7.2.3. Prescriptive Analytics
- 7.2.4. Big Data Analytics
- 7.2.5. Artificial Intelligence / Machine Learning
- 7.2.6. Cloud Computing
- 7.2.7. Others
- 8. Global Agricultural Data Analytics Market Analysis, by Data Source
- 8.1. Key Segment Analysis
- 8.2. Agricultural Data Analytics Market Size (Value - US$ Bn), Analysis, and Forecasts, by Data Source, 2021-2035
- 8.2.1. Satellite Imagery
- 8.2.2. IoT Sensor Data
- 8.2.3. Drone & UAV Data
- 8.2.4. Weather & Climate Data
- 8.2.5. Farm Machinery Telematics
- 8.2.6. Market & Trade Data
- 8.2.7. Others
- 9. Global Agricultural Data Analytics Market Analysis, by Deployment Mode
- 9.1. Key Segment Analysis
- 9.2. Agricultural Data Analytics Market Size (Value - US$ Bn), Analysis, and Forecasts, by Deployment Mode, 2021-2035
- 9.2.1. Cloud-based
- 9.2.2. On-premise
- 10. Global Agricultural Data Analytics Market Analysis, by Crop Type
- 10.1. Key Segment Analysis
- 10.2. Agricultural Data Analytics Market Size (Value - US$ Bn), Analysis, and Forecasts, by Crop Type, 2021-2035
- 10.2.1. Field Crops
- 10.2.2. Horticulture
- 10.2.3. Fruits & Vegetables
- 10.2.4. Livestock & Poultry
- 10.2.5. Aquaculture
- 10.2.6. Others
- 11. Global Agricultural Data Analytics Market Analysis, by Farm Size
- 11.1. Key Segment Analysis
- 11.2. Agricultural Data Analytics Market Size (Value - US$ Bn), Analysis, and Forecasts, by Farm Size, 2021-2035
- 11.2.1. Small-scale Farms
- 11.2.2. Medium-scale Farms
- 11.2.3. Large Commercial Farms
- 12. Global Agricultural Data Analytics Market Analysis, by Application
- 12.1. Key Segment Analysis
- 12.2. Agricultural Data Analytics Market Size (Value - US$ Bn), Analysis, and Forecasts, by Application, 2021-2035
- 12.2.1. Crop Monitoring & Management
- 12.2.2. Precision Farming
- 12.2.3. Yield Prediction & Forecasting
- 12.2.4. Soil & Nutrient Management
- 12.2.5. Pest & Disease Management
- 12.2.6. Irrigation Management
- 12.2.7. Supply Chain & Traceability
- 12.2.8. Farm Equipment & Machinery Analytics
- 12.2.9. Others
- 13. Global Agricultural Data Analytics Market Analysis, by End-User
- 13.1. Key Segment Analysis
- 13.2. Agricultural Data Analytics Market Size (Value - US$ Bn), Analysis, and Forecasts, by End-User, 2021-2035
- 13.2.1. Farmers & Growers
- 13.2.2. Agribusiness Companies
- 13.2.3. Government & Research Institutions
- 13.2.4. Food Processing Companies
- 13.2.5. Agricultural Consultants
- 13.2.6. Others
- 14. Global Agricultural Data Analytics Market Analysis, by Region
- 14.1. Key Findings
- 14.2. Agricultural Data Analytics Market Size (Value - US$ Mn), Analysis, and Forecasts, by Region, 2021-2035
- 14.2.1. North America
- 14.2.2. Europe
- 14.2.3. Asia Pacific
- 14.2.4. Middle East
- 14.2.5. Africa
- 14.2.6. South America
- 15. North America Agricultural Data Analytics Market Analysis
- 15.1. Key Segment Analysis
- 15.2. Regional Snapshot
- 15.3. North America Agricultural Data Analytics Market Size Value - US$ Bn), Analysis, and Forecasts, 2021-2035
- 15.3.1. Component
- 15.3.2. Technology
- 15.3.3. Data Source
- 15.3.4. Deployment Mode
- 15.3.5. Crop Type
- 15.3.6. Farm Size
- 15.3.7. Application
- 15.3.8. End-User
- 15.3.9. Country
- 15.3.9.1. USA
- 15.3.9.2. Canada
- 15.3.9.3. Mexico
- 15.4. USA Agricultural Data Analytics Market
- 15.4.1. Country Segmental Analysis
- 15.4.2. Component
- 15.4.3. Technology
- 15.4.4. Data Source
- 15.4.5. Deployment Mode
- 15.4.6. Crop Type
- 15.4.7. Farm Size
- 15.4.8. Application
- 15.4.9. End-User
- 15.5. Canada Agricultural Data Analytics Market
- 15.5.1. Country Segmental Analysis
- 15.5.2. Component
- 15.5.3. Technology
- 15.5.4. Data Source
- 15.5.5. Deployment Mode
- 15.5.6. Crop Type
- 15.5.7. Farm Size
- 15.5.8. Application
- 15.5.9. End-User
- 15.6. Mexico Agricultural Data Analytics Market
- 15.6.1. Country Segmental Analysis
- 15.6.2. Component
- 15.6.3. Technology
- 15.6.4. Data Source
- 15.6.5. Deployment Mode
- 15.6.6. Crop Type
- 15.6.7. Farm Size
- 15.6.8. Application
- 15.6.9. End-User
- 16. Europe Agricultural Data Analytics Market Analysis
- 16.1. Key Segment Analysis
- 16.2. Regional Snapshot
- 16.3. Europe Agricultural Data Analytics Market Size (Value - US$ Bn), Analysis, and Forecasts, 2021-2035
- 16.3.1. Component
- 16.3.2. Technology
- 16.3.3. Data Source
- 16.3.4. Deployment Mode
- 16.3.5. Crop Type
- 16.3.6. Farm Size
- 16.3.7. Application
- 16.3.8. End-User
- 16.3.9. Country
- 16.3.9.1. Germany
- 16.3.9.2. United Kingdom
- 16.3.9.3. France
- 16.3.9.4. Italy
- 16.3.9.5. Spain
- 16.3.9.6. Netherlands
- 16.3.9.7. Nordic Countries
- 16.3.9.8. Poland
- 16.3.9.9. Russia & CIS
- 16.3.9.10. Rest of Europe
- 16.4. Germany Agricultural Data Analytics Market
- 16.4.1. Country Segmental Analysis
- 16.4.2. Component
- 16.4.3. Technology
- 16.4.4. Data Source
- 16.4.5. Deployment Mode
- 16.4.6. Crop Type
- 16.4.7. Farm Size
- 16.4.8. Application
- 16.4.9. End-User
- 16.5. United Kingdom Agricultural Data Analytics Market
- 16.5.1. Country Segmental Analysis
- 16.5.2. Component
- 16.5.3. Technology
- 16.5.4. Data Source
- 16.5.5. Deployment Mode
- 16.5.6. Crop Type
- 16.5.7. Farm Size
- 16.5.8. Application
- 16.5.9. End-User
- 16.6. France Agricultural Data Analytics Market
- 16.6.1. Country Segmental Analysis
- 16.6.2. Component
- 16.6.3. Technology
- 16.6.4. Data Source
- 16.6.5. Deployment Mode
- 16.6.6. Crop Type
- 16.6.7. Farm Size
- 16.6.8. Application
- 16.6.9. End-User
- 16.7. Italy Agricultural Data Analytics Market
- 16.7.1. Country Segmental Analysis
- 16.7.2. Component
- 16.7.3. Technology
- 16.7.4. Data Source
- 16.7.5. Deployment Mode
- 16.7.6. Crop Type
- 16.7.7. Farm Size
- 16.7.8. Application
- 16.7.9. End-User
- 16.8. Spain Agricultural Data Analytics Market
- 16.8.1. Country Segmental Analysis
- 16.8.2. Component
- 16.8.3. Technology
- 16.8.4. Data Source
- 16.8.5. Deployment Mode
- 16.8.6. Crop Type
- 16.8.7. Farm Size
- 16.8.8. Application
- 16.8.9. End-User
- 16.9. Netherlands Agricultural Data Analytics Market
- 16.9.1. Country Segmental Analysis
- 16.9.2. Component
- 16.9.3. Technology
- 16.9.4. Data Source
- 16.9.5. Deployment Mode
- 16.9.6. Crop Type
- 16.9.7. Farm Size
- 16.9.8. Application
- 16.9.9. End-User
- 16.10. Nordic Countries Agricultural Data Analytics Market
- 16.10.1. Country Segmental Analysis
- 16.10.2. Component
- 16.10.3. Technology
- 16.10.4. Data Source
- 16.10.5. Deployment Mode
- 16.10.6. Crop Type
- 16.10.7. Farm Size
- 16.10.8. Application
- 16.10.9. End-User
- 16.11. Poland Agricultural Data Analytics Market
- 16.11.1. Country Segmental Analysis
- 16.11.2. Component
- 16.11.3. Technology
- 16.11.4. Data Source
- 16.11.5. Deployment Mode
- 16.11.6. Crop Type
- 16.11.7. Farm Size
- 16.11.8. Application
- 16.11.9. End-User
- 16.12. Russia & CIS Agricultural Data Analytics Market
- 16.12.1. Country Segmental Analysis
- 16.12.2. Component
- 16.12.3. Technology
- 16.12.4. Data Source
- 16.12.5. Deployment Mode
- 16.12.6. Crop Type
- 16.12.7. Farm Size
- 16.12.8. Application
- 16.12.9. End-User
- 16.13. Rest of Europe Agricultural Data Analytics Market
- 16.13.1. Country Segmental Analysis
- 16.13.2. Component
- 16.13.3. Technology
- 16.13.4. Data Source
- 16.13.5. Deployment Mode
- 16.13.6. Crop Type
- 16.13.7. Farm Size
- 16.13.8. Application
- 16.13.9. End-User
- 17. Asia Pacific Agricultural Data Analytics Market Analysis
- 17.1. Key Segment Analysis
- 17.2. Regional Snapshot
- 17.3. Asia Pacific Agricultural Data Analytics Market Size (Value - US$ Bn), Analysis, and Forecasts, 2021-2035
- 17.3.1. Component
- 17.3.2. Technology
- 17.3.3. Data Source
- 17.3.4. Deployment Mode
- 17.3.5. Crop Type
- 17.3.6. Farm Size
- 17.3.7. Application
- 17.3.8. End-User
- 17.3.9. Country
- 17.3.9.1. China
- 17.3.9.2. India
- 17.3.9.3. Japan
- 17.3.9.4. South Korea
- 17.3.9.5. Australia and New Zealand
- 17.3.9.6. Indonesia
- 17.3.9.7. Malaysia
- 17.3.9.8. Thailand
- 17.3.9.9. Vietnam
- 17.3.9.10. Rest of Asia Pacific
- 17.4. China Agricultural Data Analytics Market
- 17.4.1. Country Segmental Analysis
- 17.4.2. Component
- 17.4.3. Technology
- 17.4.4. Data Source
- 17.4.5. Deployment Mode
- 17.4.6. Crop Type
- 17.4.7. Farm Size
- 17.4.8. Application
- 17.4.9. End-User
- 17.5. India Agricultural Data Analytics Market
- 17.5.1. Country Segmental Analysis
- 17.5.2. Component
- 17.5.3. Technology
- 17.5.4. Data Source
- 17.5.5. Deployment Mode
- 17.5.6. Crop Type
- 17.5.7. Farm Size
- 17.5.8. Application
- 17.5.9. End-User
- 17.6. Japan Agricultural Data Analytics Market
- 17.6.1. Country Segmental Analysis
- 17.6.2. Component
- 17.6.3. Technology
- 17.6.4. Data Source
- 17.6.5. Deployment Mode
- 17.6.6. Crop Type
- 17.6.7. Farm Size
- 17.6.8. Application
- 17.6.9. End-User
- 17.7. South Korea Agricultural Data Analytics Market
- 17.7.1. Country Segmental Analysis
- 17.7.2. Component
- 17.7.3. Technology
- 17.7.4. Data Source
- 17.7.5. Deployment Mode
- 17.7.6. Crop Type
- 17.7.7. Farm Size
- 17.7.8. Application
- 17.7.9. End-User
- 17.8. Australia and New Zealand Agricultural Data Analytics Market
- 17.8.1. Country Segmental Analysis
- 17.8.2. Component
- 17.8.3. Technology
- 17.8.4. Data Source
- 17.8.5. Deployment Mode
- 17.8.6. Crop Type
- 17.8.7. Farm Size
- 17.8.8. Application
- 17.8.9. End-User
- 17.9. Indonesia Agricultural Data Analytics Market
- 17.9.1. Country Segmental Analysis
- 17.9.2. Component
- 17.9.3. Technology
- 17.9.4. Data Source
- 17.9.5. Deployment Mode
- 17.9.6. Crop Type
- 17.9.7. Farm Size
- 17.9.8. Application
- 17.9.9. End-User
- 17.10. Malaysia Agricultural Data Analytics Market
- 17.10.1. Country Segmental Analysis
- 17.10.2. Component
- 17.10.3. Technology
- 17.10.4. Data Source
- 17.10.5. Deployment Mode
- 17.10.6. Crop Type
- 17.10.7. Farm Size
- 17.10.8. Application
- 17.10.9. End-User
- 17.11. Thailand Agricultural Data Analytics Market
- 17.11.1. Country Segmental Analysis
- 17.11.2. Component
- 17.11.3. Technology
- 17.11.4. Data Source
- 17.11.5. Deployment Mode
- 17.11.6. Crop Type
- 17.11.7. Farm Size
- 17.11.8. Application
- 17.11.9. End-User
- 17.12. Vietnam Agricultural Data Analytics Market
- 17.12.1. Country Segmental Analysis
- 17.12.2. Component
- 17.12.3. Technology
- 17.12.4. Data Source
- 17.12.5. Deployment Mode
- 17.12.6. Crop Type
- 17.12.7. Farm Size
- 17.12.8. Application
- 17.12.9. End-User
- 17.13. Rest of Asia Pacific Agricultural Data Analytics Market
- 17.13.1. Country Segmental Analysis
- 17.13.2. Component
- 17.13.3. Technology
- 17.13.4. Data Source
- 17.13.5. Deployment Mode
- 17.13.6. Crop Type
- 17.13.7. Farm Size
- 17.13.8. Application
- 17.13.9. End-User
- 18. Middle East Agricultural Data Analytics Market Analysis
- 18.1. Key Segment Analysis
- 18.2. Regional Snapshot
- 18.3. Middle East Agricultural Data Analytics Market Size (Value - US$ Bn), Analysis, and Forecasts, 2021-2035
- 18.3.1. Component
- 18.3.2. Technology
- 18.3.3. Data Source
- 18.3.4. Deployment Mode
- 18.3.5. Crop Type
- 18.3.6. Farm Size
- 18.3.7. Application
- 18.3.8. End-User
- 18.3.9. Country
- 18.3.9.1. Turkey
- 18.3.9.2. UAE
- 18.3.9.3. Saudi Arabia
- 18.3.9.4. Israel
- 18.3.9.5. Rest of Middle East
- 18.4. Turkey Agricultural Data Analytics Market
- 18.4.1. Country Segmental Analysis
- 18.4.2. Component
- 18.4.3. Technology
- 18.4.4. Data Source
- 18.4.5. Deployment Mode
- 18.4.6. Crop Type
- 18.4.7. Farm Size
- 18.4.8. Application
- 18.4.9. End-User
- 18.5. UAE Agricultural Data Analytics Market
- 18.5.1. Country Segmental Analysis
- 18.5.2. Component
- 18.5.3. Technology
- 18.5.4. Data Source
- 18.5.5. Deployment Mode
- 18.5.6. Crop Type
- 18.5.7. Farm Size
- 18.5.8. Application
- 18.5.9. End-User
- 18.6. Saudi Arabia Agricultural Data Analytics Market
- 18.6.1. Country Segmental Analysis
- 18.6.2. Component
- 18.6.3. Technology
- 18.6.4. Data Source
- 18.6.5. Deployment Mode
- 18.6.6. Crop Type
- 18.6.7. Farm Size
- 18.6.8. Application
- 18.6.9. End-User
- 18.7. Israel Agricultural Data Analytics Market
- 18.7.1. Country Segmental Analysis
- 18.7.2. Component
- 18.7.3. Technology
- 18.7.4. Data Source
- 18.7.5. Deployment Mode
- 18.7.6. Crop Type
- 18.7.7. Farm Size
- 18.7.8. Application
- 18.7.9. End-User
- 18.8. Rest of Middle East Agricultural Data Analytics Market
- 18.8.1. Country Segmental Analysis
- 18.8.2. Component
- 18.8.3. Technology
- 18.8.4. Data Source
- 18.8.5. Deployment Mode
- 18.8.6. Crop Type
- 18.8.7. Farm Size
- 18.8.8. Application
- 18.8.9. End-User
- 19. Africa Agricultural Data Analytics Market Analysis
- 19.1. Key Segment Analysis
- 19.2. Regional Snapshot
- 19.3. Africa Agricultural Data Analytics Market Size (Value - US$ Bn), Analysis, and Forecasts, 2021-2035
- 19.3.1. Component
- 19.3.2. Technology
- 19.3.3. Data Source
- 19.3.4. Deployment Mode
- 19.3.5. Crop Type
- 19.3.6. Farm Size
- 19.3.7. Application
- 19.3.8. End-User
- 19.3.9. Country
- 19.3.9.1. South Africa
- 19.3.9.2. Egypt
- 19.3.9.3. Nigeria
- 19.3.9.4. Algeria
- 19.3.9.5. Rest of Africa
- 19.4. South Africa Agricultural Data Analytics Market
- 19.4.1. Country Segmental Analysis
- 19.4.2. Component
- 19.4.3. Technology
- 19.4.4. Data Source
- 19.4.5. Deployment Mode
- 19.4.6. Crop Type
- 19.4.7. Farm Size
- 19.4.8. Application
- 19.4.9. End-User
- 19.5. Egypt Agricultural Data Analytics Market
- 19.5.1. Country Segmental Analysis
- 19.5.2. Component
- 19.5.3. Technology
- 19.5.4. Data Source
- 19.5.5. Deployment Mode
- 19.5.6. Crop Type
- 19.5.7. Farm Size
- 19.5.8. Application
- 19.5.9. End-User
- 19.6. Nigeria Agricultural Data Analytics Market
- 19.6.1. Country Segmental Analysis
- 19.6.2. Component
- 19.6.3. Technology
- 19.6.4. Data Source
- 19.6.5. Deployment Mode
- 19.6.6. Crop Type
- 19.6.7. Farm Size
- 19.6.8. Application
- 19.6.9. End-User
- 19.7. Algeria Agricultural Data Analytics Market
- 19.7.1. Country Segmental Analysis
- 19.7.2. Component
- 19.7.3. Technology
- 19.7.4. Data Source
- 19.7.5. Deployment Mode
- 19.7.6. Crop Type
- 19.7.7. Farm Size
- 19.7.8. Application
- 19.7.9. End-User
- 19.8. Rest of Africa Agricultural Data Analytics Market
- 19.8.1. Country Segmental Analysis
- 19.8.2. Component
- 19.8.3. Technology
- 19.8.4. Data Source
- 19.8.5. Deployment Mode
- 19.8.6. Crop Type
- 19.8.7. Farm Size
- 19.8.8. Application
- 19.8.9. End-User
- 20. South America Agricultural Data Analytics Market Analysis
- 20.1. Key Segment Analysis
- 20.2. Regional Snapshot
- 20.3. South America Agricultural Data Analytics Market Size (Value - US$ Bn), Analysis, and Forecasts, 2021-2035
- 20.3.1. Component
- 20.3.2. Technology
- 20.3.3. Data Source
- 20.3.4. Deployment Mode
- 20.3.5. Crop Type
- 20.3.6. Farm Size
- 20.3.7. Application
- 20.3.8. End-User
- 20.3.9. Country
- 20.3.9.1. Brazil
- 20.3.9.2. Argentina
- 20.3.9.3. Rest of South America
- 20.4. Brazil Agricultural Data Analytics Market
- 20.4.1. Country Segmental Analysis
- 20.4.2. Component
- 20.4.3. Technology
- 20.4.4. Data Source
- 20.4.5. Deployment Mode
- 20.4.6. Crop Type
- 20.4.7. Farm Size
- 20.4.8. Application
- 20.4.9. End-User
- 20.5. Argentina Agricultural Data Analytics Market
- 20.5.1. Country Segmental Analysis
- 20.5.2. Component
- 20.5.3. Technology
- 20.5.4. Data Source
- 20.5.5. Deployment Mode
- 20.5.6. Crop Type
- 20.5.7. Farm Size
- 20.5.8. Application
- 20.5.9. End-User
- 20.6. Rest of South America Agricultural Data Analytics Market
- 20.6.1. Country Segmental Analysis
- 20.6.2. Component
- 20.6.3. Technology
- 20.6.4. Data Source
- 20.6.5. Deployment Mode
- 20.6.6. Crop Type
- 20.6.7. Farm Size
- 20.6.8. Application
- 20.6.9. End-User
- 21. Key Players/ Company Profile
- 21.1. AgEagle Aerial Systems
- 21.1.1. Company Details/ Overview
- 21.1.2. Company Financials
- 21.1.3. Key Customers and Competitors
- 21.1.4. Business/ Industry Portfolio
- 21.1.5. Product Portfolio/ Specification Details
- 21.1.6. Pricing Data
- 21.1.7. Strategic Overview
- 21.1.8. Recent Developments
- 21.2. Agrian
- 21.3. Arable Labs
- 21.4. aWhere
- 21.5. Ceres Imaging
- 21.6. Conservis
- 21.7. CropIn Technology Solutions
- 21.8. Deere & Company
- 21.9. Farmers Edge
- 21.10. GEOSYS
- 21.11. Granular
- 21.12. IBM
- 21.13. Indigo Ag
- 21.14. Microsoft
- 21.15. Prospera Technologies
- 21.16. SAP
- 21.17. Sentera
- 21.18. Taranis
- 21.19. The Climate Corporation
- 21.20. Trimble Inc.
- 21.21. Other Key Players
- 21.1. AgEagle Aerial Systems
Note* - This is just tentative list of players. While providing the report, we will cover more number of players based on their revenue and share for each geography
Research Design
Our research design integrates both demand-side and supply-side analysis through a balanced combination of primary and secondary research methodologies. By utilizing both bottom-up and top-down approaches alongside rigorous data triangulation methods, we deliver robust market intelligence that supports strategic decision-making.
MarketGenics' comprehensive research design framework ensures the delivery of accurate, reliable, and actionable market intelligence. Through the integration of multiple research approaches, rigorous validation processes, and expert analysis, we provide our clients with the insights needed to make informed strategic decisions and capitalize on market opportunities.

MarketGenics leverages a dedicated industry panel of experts and a comprehensive suite of paid databases to effectively collect, consolidate, and analyze market intelligence.
Our approach has consistently proven to be reliable and effective in generating accurate market insights, identifying key industry trends, and uncovering emerging business opportunities.
Through both primary and secondary research, we capture and analyze critical company-level data such as manufacturing footprints, including technical centers, R&D facilities, sales offices, and headquarters.
Our expert panel further enhances our ability to estimate market size for specific brands based on validated field-level intelligence.
Our data mining techniques incorporate both parametric and non-parametric methods, allowing for structured data collection, sorting, processing, and cleaning.
Demand projections are derived from large-scale data sets analyzed through proprietary algorithms, culminating in robust and reliable market sizing.
Research Approach
The bottom-up approach builds market estimates by starting with the smallest addressable market units and systematically aggregating them to create comprehensive market size projections.
This method begins with specific, granular data points and builds upward to create the complete market landscape.
Customer Analysis → Segmental Analysis → Geographical Analysis
The top-down approach starts with the broadest possible market data and systematically narrows it down through a series of filters and assumptions to arrive at specific market segments or opportunities.
This method begins with the big picture and works downward to increasingly specific market slices.
TAM → SAM → SOM


Research Methods
Desk / Secondary Research
While analysing the market, we extensively study secondary sources, directories, and databases to identify and collect information useful for this technical, market-oriented, and commercial report. Secondary sources that we utilize are not only the public sources, but it is a combination of Open Source, Associations, Paid Databases, MG Repository & Knowledgebase, and others.
- Company websites, annual reports, financial reports, broker reports, and investor presentations
- National government documents, statistical databases and reports
- News articles, press releases and web-casts specific to the companies operating in the market, Magazines, reports, and others
- We gather information from commercial data sources for deriving company specific data such as segmental revenue, share for geography, product revenue, and others
- Internal and external proprietary databases (industry-specific), relevant patent, and regulatory databases
- Governing Bodies, Government Organizations
- Relevant Authorities, Country-specific Associations for Industries
We also employ the model mapping approach to estimate the product level market data through the players' product portfolio
Primary Research
Primary research/ interviews is vital in analyzing the market. Most of the cases involves paid primary interviews. Primary sources include primary interviews through e-mail interactions, telephonic interviews, surveys as well as face-to-face interviews with the different stakeholders across the value chain including several industry experts.
| Type of Respondents | Number of Primaries |
|---|---|
| Tier 2/3 Suppliers | ~20 |
| Tier 1 Suppliers | ~25 |
| End-users | ~25 |
| Industry Expert/ Panel/ Consultant | ~30 |
| Total | ~100 |
MG Knowledgebase
• Repository of industry blog, newsletter and case studies
• Online platform covering detailed market reports, and company profiles
Forecasting Factors and Models
Forecasting Factors
- Historical Trends – Past market patterns, cycles, and major events that shaped how markets behave over time. Understanding past trends helps predict future behavior.
- Industry Factors – Specific characteristics of the industry like structure, regulations, and innovation cycles that affect market dynamics.
- Macroeconomic Factors – Economic conditions like GDP growth, inflation, and employment rates that affect how much money people have to spend.
- Demographic Factors – Population characteristics like age, income, and location that determine who can buy your product.
- Technology Factors – How quickly people adopt new technology and how much technology infrastructure exists.
- Regulatory Factors – Government rules, laws, and policies that can help or restrict market growth.
- Competitive Factors – Analyzing competition structure such as degree of competition and bargaining power of buyers and suppliers.
Forecasting Models / Techniques
Multiple Regression Analysis
- Identify and quantify factors that drive market changes
- Statistical modeling to establish relationships between market drivers and outcomes
Time Series Analysis – Seasonal Patterns
- Understand regular cyclical patterns in market demand
- Advanced statistical techniques to separate trend, seasonal, and irregular components
Time Series Analysis – Trend Analysis
- Identify underlying market growth patterns and momentum
- Statistical analysis of historical data to project future trends
Expert Opinion – Expert Interviews
- Gather deep industry insights and contextual understanding
- In-depth interviews with key industry stakeholders
Multi-Scenario Development
- Prepare for uncertainty by modeling different possible futures
- Creating optimistic, pessimistic, and most likely scenarios
Time Series Analysis – Moving Averages
- Sophisticated forecasting for complex time series data
- Auto-regressive integrated moving average models with seasonal components
Econometric Models
- Apply economic theory to market forecasting
- Sophisticated economic models that account for market interactions
Expert Opinion – Delphi Method
- Harness collective wisdom of industry experts
- Structured, multi-round expert consultation process
Monte Carlo Simulation
- Quantify uncertainty and probability distributions
- Thousands of simulations with varying input parameters
Research Analysis
Our research framework is built upon the fundamental principle of validating market intelligence from both demand and supply perspectives. This dual-sided approach ensures comprehensive market understanding and reduces the risk of single-source bias.
Demand-Side Analysis: We understand end-user/application behavior, preferences, and market needs along with the penetration of the product for specific application.
Supply-Side Analysis: We estimate overall market revenue, analyze the segmental share along with industry capacity, competitive landscape, and market structure.
Validation & Evaluation
Data triangulation is a validation technique that uses multiple methods, sources, or perspectives to examine the same research question, thereby increasing the credibility and reliability of research findings. In market research, triangulation serves as a quality assurance mechanism that helps identify and minimize bias, validate assumptions, and ensure accuracy in market estimates.
- Data Source Triangulation – Using multiple data sources to examine the same phenomenon
- Methodological Triangulation – Using multiple research methods to study the same research question
- Investigator Triangulation – Using multiple researchers or analysts to examine the same data
- Theoretical Triangulation – Using multiple theoretical perspectives to interpret the same data

Custom Market Research Services
We will customise the research for you, in case the report listed above does not meet your requirements.
Get 10% Free Customisation