Citric Acid Market Size, Share & Trends Analysis Report by Form (Anhydrous Citric Acid, Monohydrate Citric Acid, Liquid Citric Acid), Purity Level, Production Method, Raw Material Source, Packaging Type, Distribution Channel, Technology/Process Type, Rated Production Capacity (Annual), End-Use Industry, and Geography (North America, Europe, Asia Pacific, Middle East, Africa, and South America) – Global Industry Data, Trends, and Forecasts, 2026–2035
|
|
|
Segmental Data Insights |
|
|
Demand Trends |
|
|
Competitive Landscape |
|
|
Strategic Development |
|
|
Future Outlook & Opportunities |
|
Citric Acid Market Size, Share, and Growth
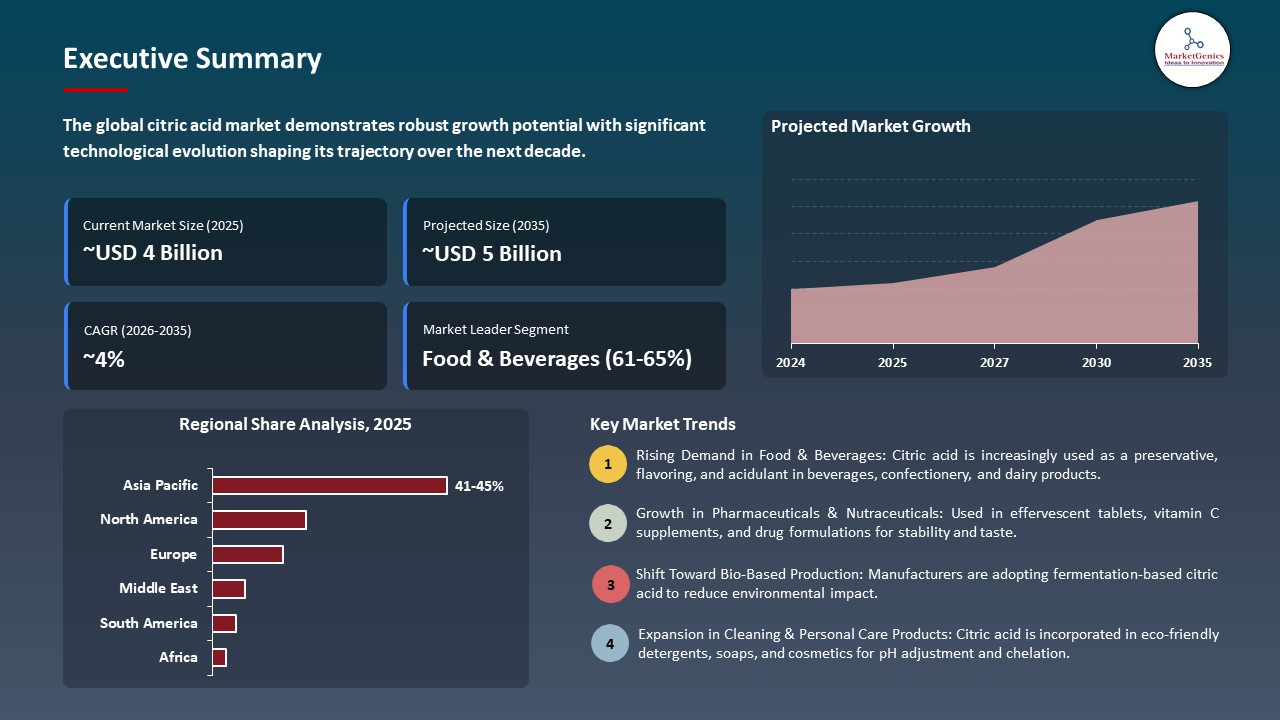
The global citric acid market is experiencing robust growth, with its estimated value of USD 3.8 billion in the year 2025 and USD 5.4 billion by the period 2035, registering a CAGR of 3.5%, during the forecast period. The citric acid market is growing stronger with the manufacturers and brand owners becoming more aware of the importance of functional versatility, clean-label positioning, and regulatory contentment. Increased use of natural, plant-based, and non-synthetic ingredients is increasing the usage in food, beverage, pharmaceutical, nutraceutical, and personal care products.
Eef Benoit, Sales Manager at Citribel, said, At Citribel, we value sustainable and long-term collaborations. Our partnership with Brenntag as leading distributor of chemicals and ingredients is a prime example of this commitment. By combining Brenntag's expertise with our premium citric acid and citrate products, we ensure reliable and sustainable solutions for the pharmaceutical industry.
The citric acid market is shifting away in the bulk acidulant portion into a more strategic portion of the ingredient, which forms the foundations of regulatory compliance, purity assurance and high-level formulation logic. The manufactures of pharmaceuticals, nutraceuticals, personal care, home care, and precision agriculture are also incorporating citric acid not only in acidity regulation but as a versatile systems ingredient that stabilizes complex actives, regulates metal-ion interference, and enhances pH-dependent bioavailability. The reasons behind this repositioning are the change in the global standards of formulation, where traceability, low toxicity profiles, and cross-border compliance mandate the use of the ingredients with established safety, biodegradability, and wide technical compatibility.
Similarly, the fast evolution of precision fermentation, cell-culture platforms, bio-derived plastics, and microbiome-targeted supplements are increasing the role of citric acid as a performance ingredient within industrial bioprocesses. Its predictable chelating nature, low-residue properties and high purity levels enhance bio-reactor performance, facilitate downstream filtration and minimize batch losses that makes it an essential facilitator to the new bio-industrial supply chains. With the increase in the fermentation capacity and fluctuations in the feedstock prices, the producers are shifting to renewable carbohydrate feeds, membrane-based purification, and energy-saving crystallization systems to ensure stability and lower the environmental footprint.
Adjacent opportunities to the citric acid market include food acidulants and flavor enhancers, clean-label preservatives, pharmaceutical excipients, biodegradable chelating agents for detergents and water treatment, and bio-based chemicals for cosmetics and personal care, leveraging citric acid’s acidity control, chelation, and antimicrobial properties across multiple industries, thereby expanding market reach, enabling cross-sector adoption, and reducing reliance on core food and beverage applications.
Citric Acid Market Dynamics and Trends
Driver: Growing Demand for Natural Additives & Clean‑Label Products
-
The global citric acid market is growing fast due to the increasing trend of food, beverage and personal-care products producers to adopt natural and plant based products and label friendly products. Consumers are also turning their backs on artificial preservatives, synthetic acidity control systems and petrochemical-based chelating systems, which have led to the adoption of citric acid as a more biodegradable, GRAS acceptable compound and multifunctional preservative. The clean-label reformulation of carbonated beverages, confectionery, dairy, processed foods, infant foods, and natural cosmetics now include citric acid, which delivers microbial stability, flavor enhancement, and acidity control without jeopardizing transparency and product purity.
- This change in the market is being supported by the fact that short-ingredient listing, vegan formulations, and artificial chemicals formulations free are gaining more popularity. The ability to use citric acid in organic, non-GMO, and minimally processed product lines also contributes to its popularity as an ingredient among the brands that focus on the effectiveness of consumer trust and respond to the changing retail requirements of clean-label adherence.
- Heightened consumer questioning, increasing global regulations on synthetic additives, and the strategic repositioning of major brands to clean-label product lines around citric acid remains the most important force behind clean-label products development in the global citric acid market.
Restraint: Raw‑Material Volatility and Production Cost Pressures
-
The global citric acid market faces extreme limitations in terms of its reliance on agricultural raw materials like corn, cassava and sugarcane inputs that are subject to shocks with changes in climate, global scarcity of fertilizers and its competition by the bio fuel industry. This has increased the price of fermentation grade carbohydrates and has a direct effect on the cost-effectiveness of large scale citric acid production. The manufacturers are also struggling with an increase in costs of fermentation nutrients, optimization of microbial-strains and energy consuming purification processes, which add complexity and costs to the levels of operation.
- Moreover, to keep the processing contamination-free, it is necessary to have advanced wastewater treatment, closed-loop fermentation, and high sterility levels, which also increase the capital and operating expenses. Another financial burden is the logistics because food and pharma-grade citric acid should comply with strict requirements regarding the international transport, purity, and documentation.
- Even minor fluctuations in fermentation performance or purity can compel batch reprocessing or disposal that brings about costly losses and regulatory threats that, when summed up, calls the market pressure of production cost a significant market constraint.
Opportunity: Expansion into Industrial, Pharmaceutical & Eco‑Friendly Applications
-
The global citric acid market is growing out of the food and beverage sector to high-value industrial, pharmaceutical, personal-care, and eco-cleaning products due to the need of non-toxic, biodegradable, and versatile ingredients capable of substituting phosphates and harsher acids in the formula.
- To meet these segments, producers are coming up with high-purity grades, chelators based on citrates as well as low-residue pharmaceutical excipients. For instance, in April 2025, BASF released Trilon G (GLDA), a biodegradable chelating agent that is marketed as a green cleaner and industrial use; this is an early market indication that buyers are willing to use green chelators and is a positive indicator that citric-acid-based eco-cleaning may be a viable alternative to phosphate and EDTA.
- Bio-based polymers, citrate-based process chemistries, and scalable onsite production make lower-carbon supply chains. Citric acids new stream of revenues as sustainability requirements and green procurement increases and take away additional share within industrial and regulated markets.
Key Trend: Shift toward Bio‑Based, Sustainable Production and Green Chemistry
-
The global citric acid market is undergoing a robust shift in the manufacturing direction to bio-based, low-carbon and green-chemistry production routes as manufacturers are progressively being pressured to lessen their reliance on corn-based raw components, minimize pollution, and address the instability of their supply. Businesses are building circular-economy-based models of waste biomass, renewable feedstocks, and energy-saving fermentation to meet global sustainability goals.
- Manufacturers are also increasing the pace of R&D to enhance yields and reduce environmental impact with engineered microbial strains and renewable substrates. Indicatively, scientists showed that a genetically engineered Yarrowia lipolytica is capable of synthesizing large-scale citric acid by using lignocellulosic agricultural waste thereby indicating a scalable pathway to bio-based and waste-upcycled production.
- This facilitates industry-wide shifts to high-end fermentation, bioprocesses that are enzyme optimised and manufacturing lines that are carbon neutral. With the increase in acceptance of green-chemistry, manufacturers are increasingly distinguishing themselves using eco-certified grades, biodegradable process inputs and clear report on sustainability.
- Based on these advancements, the companies will be more competitive, minimize the risks of raw materials, and make bio-based citric acid an ingredient of choice in food, beverages, pharmaceuticals, and personal-care products across the globe.

Citric-Acid-Market Analysis and Segmental Data
Food & Beverages Dominate Global Citric Acid Market
-
Food and beverage leads the citric acid market because of its multifunctional characteristics which may be used as a natural preservative, as a flavourings, as an acidulant, and as a shelf-life extender in beverages, dairy, confectionary, sauces, and processed foods. It is a better option to manufacturers who are interested in health-conscious consumers due to its clean-label profile and non-toxicity.
- Beginning with trends in innovation, customized formulations and high-purity grades are of concern. For instance, manufacturers are progressively providing granulated, coated, or slow-release citric acid in drinks and confectionery, with better solubility, flavor profile, and stability and less caking and moisture uptake, and in line with the present-day manufacturing and environmentally sustainable ambitions.
- This strong orientation toward food and beverage applications profoundly influences overall market structure, competitive dynamics, demand growth, and strategic priorities within the industry.
Asia Pacific Leads Global Citric Acid Market Demand
-
Asia Pacific leads the citric acid market because of the fast industrialization, growing food and beverage processing sectors, increased demand on natural preservatives and clean-label food ingredients. This is due to increased urbanization, growth in disposable incomes as well as the rise in health consciousness among consumers that are increasing the use of citric acid in beverages, confectionery, dairy foods and processed foods.
- Manufacturers and suppliers are also investing in sustainable production technologies, capacity expansions and innovations in quality control to ensure that they meet the regulatory requirements as well as the expectations of the customer. Indicatively, there is the implementation of new eco efficient extraction and purification procedures to enhance yield, decreasing energy usage and maintaining consistency in the quality of the products to support local as well as export markets.
- The advanced processing methods, strategically positioning in the local manufacturing and optimization of the supply chain enhance the regional presence and responsiveness. Through these advances, Asia Pacific is able to spearhead citric acid adoption in the world through the provision of cost effective, high purity and regulatory compliant solutions and enhances innovations and sustainable development throughout the market.
Citric-Acid-Market Ecosystem
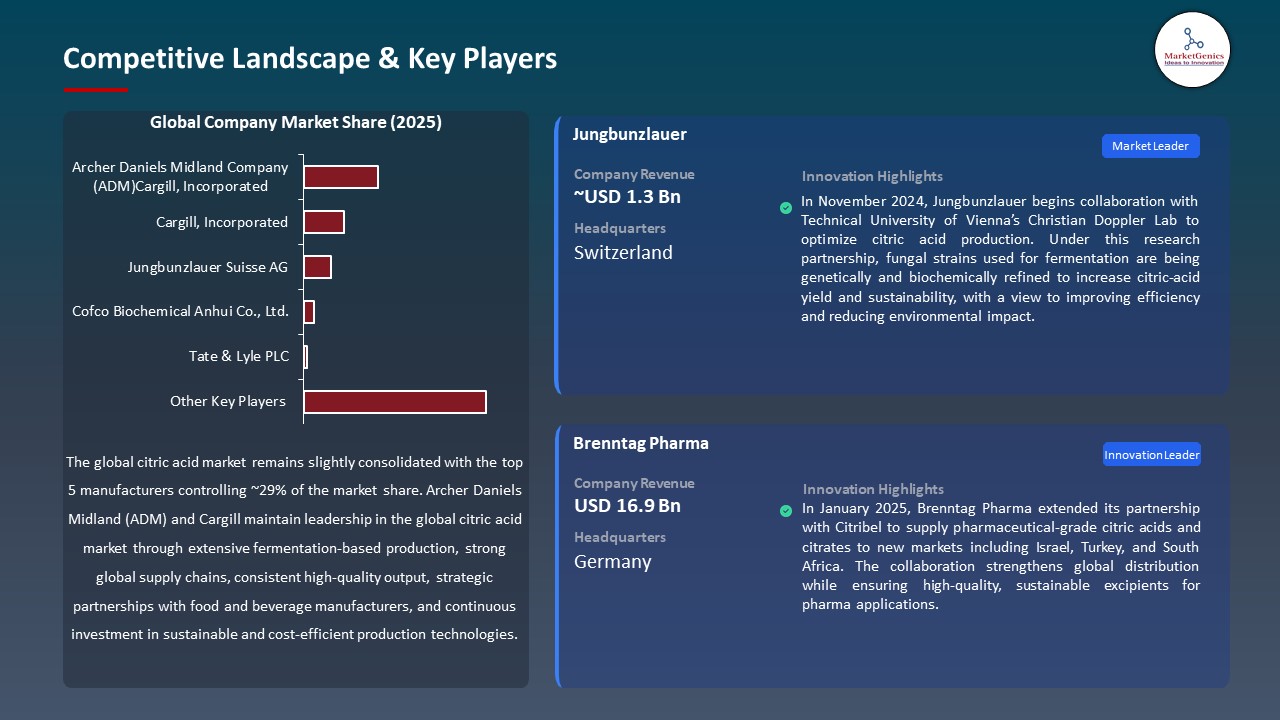
The global citric acid market is moderately consolidated with medium to high concentration of major multinational manufacturers of citric acid to food and beverage markets to pharmaceutical and personal care market, and to industrial chemical markets. Well-known competitors are Archer Daniels Midland Company, Cargill, Incorporated, Jungbunzlauer Suisse AG, Cofco Biochemical Anhui Co., Ltd., and Tate & Lyle PLC. ADM and Cargill are Tier 1 companies, which control the world production and distribution, relying on large-scale fermentation plants, strong research and development, and regulatory skills.
Regional, high-purity grade or pharmaceutical-grade products are targeted by Tier 2 players such as Jungbunzlauer, and by the Tier 3 players such as Cofco Biochemical, niche applications or local markets are targeted. The citric acid value chain includes upstream suppliers (sugar, molasses, and starch), fermentation and extraction plants, formulation and processing plants, and downstream food, beverage, and pharmaceutical companies. Some of the ways that are being used by the market players to improve the ecosystem include sustainable bio-based production, process automation, and vertical integration, digital quality monitoring and compliance-driven innovation which ensures that the products remain stable, cost-effective, and globally compliant in various end-use applications.
Recent Development and Strategic Overview
-
In November 2024, Jungbunzlauer begins collaboration with Technical University of Vienna’s Christian Doppler Lab to optimise citric acid production. Under this research partnership, fungal strains used for fermentation are being genetically and biochemically refined to increase citric-acid yield and sustainability, with a view to improving efficiency and reducing environmental impact.
- In January 2025, Brenntag Pharma extended its partnership with Citribel to supply pharmaceutical‑grade citric acids and citrates to new markets including Israel, Turkey, and South Africa. The collaboration strengthens global distribution while ensuring high-quality, sustainable excipients for pharma applications.
Report Scope
|
Detail |
|
|
Market Size in 2025 |
USD 3.8 Bn |
|
Market Forecast Value in 2035 |
USD 5.4 Bn |
|
Growth Rate (CAGR) |
3.5% |
|
Forecast Period |
2026 – 2035 |
|
Historical Data Available for |
2021 – 2024 |
|
Market Size Units |
US$ Billion for Value Metric Tons for Value |
|
Report Format |
Electronic (PDF) + Excel |
|
North America |
Europe |
Asia Pacific |
Middle East |
Africa |
South America |
|
|
|
|
|
|
|
Companies Covered |
|||||
|
|
|
|
|
|
Citric-Acid-Market Segmentation and Highlights
|
Segment |
Sub-segment |
|
Citric Acid Market, By Form |
|
|
Citric Acid Market, By Purity Level |
|
|
Citric Acid Market, By Production Method |
|
|
Citric Acid Market, By Raw Material Source |
|
|
Citric Acid Market, By Packaging Type |
|
|
Citric Acid Market, By Distribution Channel |
|
|
Citric Acid Market, By Technology/Process Type |
|
|
Citric Acid Market, By Rated Production Capacity (Annual) |
|
|
Citric Acid Market, By End-Use Industry |
|
Frequently Asked Questions
Table of Contents
- 1. Research Methodology and Assumptions
- 1.1. Definitions
- 1.2. Research Design and Approach
- 1.3. Data Collection Methods
- 1.4. Base Estimates and Calculations
- 1.5. Forecasting Models
- 1.5.1. Key Forecast Factors & Impact Analysis
- 1.6. Secondary Research
- 1.6.1. Open Sources
- 1.6.2. Paid Databases
- 1.6.3. Associations
- 1.7. Primary Research
- 1.7.1. Primary Sources
- 1.7.2. Primary Interviews with Stakeholders across Ecosystem
- 2. Executive Summary
- 2.1. Global Citric Acid Market Outlook
- 2.1.1. Citric Acid Market Size Volume (Metric Tons) and Value (US$ Bn), and Forecasts, 2021-2035
- 2.1.2. Compounded Annual Growth Rate Analysis
- 2.1.3. Growth Opportunity Analysis
- 2.1.4. Segmental Share Analysis
- 2.1.5. Geographical Share Analysis
- 2.2. Market Analysis and Facts
- 2.3. Supply-Demand Analysis
- 2.4. Competitive Benchmarking
- 2.5. Go-to- Market Strategy
- 2.5.1. Customer/ End-use Industry Assessment
- 2.5.2. Growth Opportunity Data, 2026-2035
- 2.5.2.1. Regional Data
- 2.5.2.2. Country Data
- 2.5.2.3. Segmental Data
- 2.5.3. Identification of Potential Market Spaces
- 2.5.4. GAP Analysis
- 2.5.5. Potential Attractive Price Points
- 2.5.6. Prevailing Market Risks & Challenges
- 2.5.7. Preferred Sales & Marketing Strategies
- 2.5.8. Key Recommendations and Analysis
- 2.5.9. A Way Forward
- 2.1. Global Citric Acid Market Outlook
- 3. Industry Data and Premium Insights
- 3.1. Global Food & Beverages Industry Overview, 2025
- 3.1.1. Industry Ecosystem Analysis
- 3.1.2. Key Trends for Food & Beverages Industry
- 3.1.3. Regional Distribution for Food & Beverages Industry
- 3.2. Supplier Customer Data
- 3.3. Technology Roadmap and Developments
- 3.4. Trade Analysis
- 3.4.1. Import & Export Analysis, 2025
- 3.4.2. Top Importing Countries
- 3.4.3. Top Exporting Countries
- 3.5. Trump Tariff Impact Analysis
- 3.5.1. Manufacturer
- 3.5.1.1. Based on the component & Raw material
- 3.5.2. Supply Chain
- 3.5.3. End Consumer
- 3.5.1. Manufacturer
- 3.6. Raw Material Analysis
- 3.1. Global Food & Beverages Industry Overview, 2025
- 4. Market Overview
- 4.1. Market Dynamics
- 4.1.1. Drivers
- 4.1.1.1. Growing demand for clean-label, natural, and plant-derived ingredients in food, beverages, and personal-care products.
- 4.1.1.2. Expanding applications in pharmaceuticals, nutraceuticals, and household products for pH control, preservation, and safety.
- 4.1.1.3. Rising consumer awareness of health, sustainability, and biodegradable solutions driving substitution of synthetic additives.
- 4.1.2. Restraints
- 4.1.2.1. Volatility in raw material supply (e.g., sugar and corn) affecting production costs and availability.
- 4.1.2.2. Regulatory variations and strict compliance requirements across regions, increasing operational and certification challenges.
- 4.1.1. Drivers
- 4.2. Key Trend Analysis
- 4.3. Regulatory Framework
- 4.3.1. Key Regulations, Norms, and Subsidies, by Key Countries
- 4.3.2. Tariffs and Standards
- 4.3.3. Impact Analysis of Regulations on the Market
- 4.4. Value Chain Analysis
- 4.4.1. Raw Material Suppliers
- 4.4.2. Citric Acid Manufacturers
- 4.4.3. Dealers/ Distributors
- 4.4.4. End-Users/ Customers
- 4.5. Cost Structure Analysis
- 4.5.1. Parameter’s Share for Cost Associated
- 4.5.2. COGP vs COGS
- 4.5.3. Profit Margin Analysis
- 4.6. Pricing Analysis
- 4.6.1. Regional Pricing Analysis
- 4.6.2. Segmental Pricing Trends
- 4.6.3. Factors Influencing Pricing
- 4.7. Porter’s Five Forces Analysis
- 4.8. PESTEL Analysis
- 4.9. Global Citric Acid Market Demand
- 4.9.1. Historical Market Size – Volume (Metric Tons) and Value (US$ Bn), 2020-2024
- 4.9.2. Current and Future Market Size – Volume (Metric Tons) and Value (US$ Bn), 2026–2035
- 4.9.2.1. Y-o-Y Growth Trends
- 4.9.2.2. Absolute $ Opportunity Assessment
- 4.1. Market Dynamics
- 5. Competition Landscape
- 5.1. Competition structure
- 5.1.1. Fragmented v/s consolidated
- 5.2. Company Share Analysis, 2025
- 5.2.1. Global Company Market Share
- 5.2.2. By Region
- 5.2.2.1. North America
- 5.2.2.2. Europe
- 5.2.2.3. Asia Pacific
- 5.2.2.4. Middle East
- 5.2.2.5. Africa
- 5.2.2.6. South America
- 5.3. Product Comparison Matrix
- 5.3.1. Specifications
- 5.3.2. Market Positioning
- 5.3.3. Pricing
- 5.1. Competition structure
- 6. Global Citric Acid Market Analysis, by Form
- 6.1. Key Segment Analysis
- 6.2. Citric Acid Market Size Volume (Metric Tons) and Value (US$ Bn), Analysis, and Forecasts, by Form, 2021-2035
- 6.2.1. Anhydrous Citric Acid
- 6.2.2. Monohydrate Citric Acid
- 6.2.3. Liquid Citric Acid
- 7. Global Citric Acid Market Analysis, by Purity Level
- 7.1. Key Segment Analysis
- 7.2. Citric Acid Market Size Volume (Metric Tons) and Value (US$ Bn), Analysis, and Forecasts, by Purity Level, 2021-2035
- 7.2.1. Food Grade (>99.5% purity)
- 7.2.2. Pharmaceutical Grade (USP/EP standards)
- 7.2.3. Industrial Grade (>99% purity)
- 7.2.4. Technical Grade (<99% purity)
- 8. Global Citric Acid Market Analysis, by Production Method
- 8.1. Key Segment Analysis
- 8.2. Citric Acid Market Size Volume (Metric Tons) and Value (US$ Bn), Analysis, and Forecasts, by Production Method, 2021-2035
- 8.2.1. Submerged Fermentation
- 8.2.2. Surface Fermentation
- 8.2.3. Synthetic/Chemical Synthesis
- 8.2.4. Bio-based/Natural Extraction
- 9. Global Citric Acid Market Analysis, by Raw Material Source
- 9.1. Key Segment Analysis
- 9.2. Citric Acid Market Size Volume (Metric Tons) and Value (US$ Bn), Analysis, and Forecasts, by Raw Material Source, 2021-2035
- 9.2.1. Corn-based
- 9.2.2. Cassava-based
- 9.2.3. Molasses-based
- 9.2.4. Sugar-based
- 9.2.5. Other Carbohydrate Sources
- 10. Global Citric Acid Market Analysis, by Packaging Type
- 10.1. Key Segment Analysis
- 10.2. Citric Acid Market Size Volume (Metric Tons) and Value (US$ Bn), Analysis, and Forecasts, by Packaging Type, 2021-2035
- 10.2.1. Bulk Packaging (>25 kg bags)
- 10.2.2. Medium Packaging (10-25 kg bags)
- 10.2.3. Small Packaging (<10 kg)
- 10.2.4. IBC Containers/Drums
- 10.2.5. Super Sacks/FIBC
- 11. Global Citric Acid Market Analysis, by Distribution Channel
- 11.1. Key Segment Analysis
- 11.2. Citric Acid Market Size Volume (Metric Tons) and Value (US$ Bn), Analysis, and Forecasts, by Distribution Channel, 2021-2035
- 11.2.1. Direct Sales/Manufacturers
- 11.2.2. Distributors/Wholesalers
- 11.2.3. Online Retailers
- 11.2.4. Specialty Chemical Suppliers
- 12. Global Citric Acid Market Analysis, by Technology/Process Type
- 12.1. Key Segment Analysis
- 12.2. Citric Acid Market Size Volume (Metric Tons) and Value (US$ Bn), Analysis, and Forecasts, by Technology/Process Type, 2021-2035
- 12.2.1. Aspergillus niger Fermentation
- 12.2.2. Advanced Enzymatic Process
- 12.2.3. Conventional Chemical Process
- 12.2.4. Membrane Separation Technology
- 13. Global Citric Acid Market Analysis, by Rated Production Capacity (Annual)
- 13.1. Key Segment Analysis
- 13.2. Citric Acid Market Size Volume (Metric Tons) and Value (US$ Bn), Analysis, and Forecasts, by Rated Production Capacity (Annual), 2021-2035
- 13.2.1. <10,000 MT/year
- 13.2.2. 10,000-50,000 MT/year
- 13.2.3. 50,000-100,000 MT/year
- 13.2.4. >100,000 MT/year
- 14. Global Citric Acid Market Analysis, by End-Use Industry
- 14.1. Key Segment Analysis
- 14.2. Citric Acid Market Size Volume (Metric Tons) and Value (US$ Bn), Analysis, and Forecasts, by End-Use Industry, 2021-2035
- 14.2.1. Food & Beverages Industry
- 14.2.1.1. Beverages
- 14.2.1.2. Confectionery & Candies
- 14.2.1.3. Dairy Products
- 14.2.1.4. Processed Foods & Ready Meals
- 14.2.1.5. Bakery & Baked Goods
- 14.2.1.6. Flavor Enhancement
- 14.2.1.7. pH Regulation & Acidulant
- 14.2.1.8. Others
- 14.2.2. Pharmaceuticals Industry
- 14.2.2.1. Effervescent Tablets & Formulations
- 14.2.2.2. Syrups & Liquid Medications
- 14.2.2.3. Anticoagulant Solutions
- 14.2.2.4. Active Pharmaceutical Ingredients (API)
- 14.2.2.5. Vitamin & Supplement Manufacturing
- 14.2.2.6. Others
- 14.2.3. Personal Care & Cosmetics
- 14.2.4. Household & Industrial Cleaning
- 14.2.5. Chemical
- 14.2.5.1. Chelating Agents Manufacturing
- 14.2.5.2. Plasticizers Production
- 14.2.5.3. Esterification Processes
- 14.2.5.4. Metal Cleaning & Passivation
- 14.2.5.5. Electroplating Applications
- 14.2.5.6. Others
- 14.2.6. Agriculture & Animal Feed
- 14.2.7. Water Treatment
- 14.2.8. Textile
- 14.2.9. Oil & Gas
- 14.2.10. Other Industries
- 14.2.1. Food & Beverages Industry
- 15. Global Citric Acid Market Analysis and Forecasts, by Region
- 15.1. Key Findings
- 15.2. Citric Acid Market Size Volume (Metric Tons) and Value (US$ Bn), Analysis, and Forecasts, by Region, 2021-2035
- 15.2.1. North America
- 15.2.2. Europe
- 15.2.3. Asia Pacific
- 15.2.4. Middle East
- 15.2.5. Africa
- 15.2.6. South America
- 16. North America Citric Acid Market Analysis
- 16.1. Key Segment Analysis
- 16.2. Regional Snapshot
- 16.3. North America Citric Acid Market Size- Volume (Metric Tons) and Value (US$ Bn), Analysis, and Forecasts, 2021-2035
- 16.3.1. Form
- 16.3.2. Purity Level
- 16.3.3. Production Method
- 16.3.4. Raw Material Source
- 16.3.5. Packaging Type
- 16.3.6. Distribution Channel
- 16.3.7. Technology/Process Type
- 16.3.8. Rated Production Capacity (Annual)
- 16.3.9. End-Use Industry
- 16.3.10. Country
- 16.3.10.1. USA
- 16.3.10.2. Canada
- 16.3.10.3. Mexico
- 16.4. USA Citric Acid Market
- 16.4.1. Country Segmental Analysis
- 16.4.2. Form
- 16.4.3. Purity Level
- 16.4.4. Production Method
- 16.4.5. Raw Material Source
- 16.4.6. Packaging Type
- 16.4.7. Distribution Channel
- 16.4.8. Technology/Process Type
- 16.4.9. Rated Production Capacity (Annual)
- 16.4.10. End-Use Industry
- 16.5. Canada Citric Acid Market
- 16.5.1. Country Segmental Analysis
- 16.5.2. Form
- 16.5.3. Purity Level
- 16.5.4. Production Method
- 16.5.5. Raw Material Source
- 16.5.6. Packaging Type
- 16.5.7. Distribution Channel
- 16.5.8. Technology/Process Type
- 16.5.9. Rated Production Capacity (Annual)
- 16.5.10. End-Use Industry
- 16.6. Mexico Citric Acid Market
- 16.6.1. Country Segmental Analysis
- 16.6.2. Form
- 16.6.3. Purity Level
- 16.6.4. Production Method
- 16.6.5. Raw Material Source
- 16.6.6. Packaging Type
- 16.6.7. Distribution Channel
- 16.6.8. Technology/Process Type
- 16.6.9. Rated Production Capacity (Annual)
- 16.6.10. End-Use Industry
- 17. Europe Citric Acid Market Analysis
- 17.1. Key Segment Analysis
- 17.2. Regional Snapshot
- 17.3. Europe Citric Acid Market Size Volume (Metric Tons) and Value (US$ Bn), Analysis, and Forecasts, 2021-2035
- 17.3.1. Form
- 17.3.2. Purity Level
- 17.3.3. Production Method
- 17.3.4. Raw Material Source
- 17.3.5. Packaging Type
- 17.3.6. Distribution Channel
- 17.3.7. Technology/Process Type
- 17.3.8. Rated Production Capacity (Annual)
- 17.3.9. End-Use Industry
- 17.3.10. Country
- 17.3.10.1. Germany
- 17.3.10.2. United Kingdom
- 17.3.10.3. France
- 17.3.10.4. Italy
- 17.3.10.5. Spain
- 17.3.10.6. Netherlands
- 17.3.10.7. Nordic Countries
- 17.3.10.8. Poland
- 17.3.10.9. Russia & CIS
- 17.3.10.10. Rest of Europe
- 17.4. Germany Citric Acid Market
- 17.4.1. Country Segmental Analysis
- 17.4.2. Form
- 17.4.3. Purity Level
- 17.4.4. Production Method
- 17.4.5. Raw Material Source
- 17.4.6. Packaging Type
- 17.4.7. Distribution Channel
- 17.4.8. Technology/Process Type
- 17.4.9. Rated Production Capacity (Annual)
- 17.4.10. End-Use Industry
- 17.5. United Kingdom Citric Acid Market
- 17.5.1. Country Segmental Analysis
- 17.5.2. Form
- 17.5.3. Purity Level
- 17.5.4. Production Method
- 17.5.5. Raw Material Source
- 17.5.6. Packaging Type
- 17.5.7. Distribution Channel
- 17.5.8. Technology/Process Type
- 17.5.9. Rated Production Capacity (Annual)
- 17.5.10. End-Use Industry
- 17.6. France Citric Acid Market
- 17.6.1. Country Segmental Analysis
- 17.6.2. Form
- 17.6.3. Purity Level
- 17.6.4. Production Method
- 17.6.5. Raw Material Source
- 17.6.6. Packaging Type
- 17.6.7. Distribution Channel
- 17.6.8. Technology/Process Type
- 17.6.9. Rated Production Capacity (Annual)
- 17.6.10. End-Use Industry
- 17.7. Italy Citric Acid Market
- 17.7.1. Country Segmental Analysis
- 17.7.2. Form
- 17.7.3. Purity Level
- 17.7.4. Production Method
- 17.7.5. Raw Material Source
- 17.7.6. Packaging Type
- 17.7.7. Distribution Channel
- 17.7.8. Technology/Process Type
- 17.7.9. Rated Production Capacity (Annual)
- 17.7.10. End-Use Industry
- 17.8. Spain Citric Acid Market
- 17.8.1. Country Segmental Analysis
- 17.8.2. Form
- 17.8.3. Purity Level
- 17.8.4. Production Method
- 17.8.5. Raw Material Source
- 17.8.6. Packaging Type
- 17.8.7. Distribution Channel
- 17.8.8. Technology/Process Type
- 17.8.9. Rated Production Capacity (Annual)
- 17.8.10. End-Use Industry
- 17.9. Netherlands Citric Acid Market
- 17.9.1. Country Segmental Analysis
- 17.9.2. Form
- 17.9.3. Purity Level
- 17.9.4. Production Method
- 17.9.5. Raw Material Source
- 17.9.6. Packaging Type
- 17.9.7. Distribution Channel
- 17.9.8. Technology/Process Type
- 17.9.9. Rated Production Capacity (Annual)
- 17.9.10. End-Use Industry
- 17.10. Nordic Countries Citric Acid Market
- 17.10.1. Country Segmental Analysis
- 17.10.2. Form
- 17.10.3. Purity Level
- 17.10.4. Production Method
- 17.10.5. Raw Material Source
- 17.10.6. Packaging Type
- 17.10.7. Distribution Channel
- 17.10.8. Technology/Process Type
- 17.10.9. Rated Production Capacity (Annual)
- 17.10.10. End-Use Industry
- 17.11. Poland Citric Acid Market
- 17.11.1. Country Segmental Analysis
- 17.11.2. Form
- 17.11.3. Purity Level
- 17.11.4. Production Method
- 17.11.5. Raw Material Source
- 17.11.6. Packaging Type
- 17.11.7. Distribution Channel
- 17.11.8. Technology/Process Type
- 17.11.9. Rated Production Capacity (Annual)
- 17.11.10. End-Use Industry
- 17.12. Russia & CIS Citric Acid Market
- 17.12.1. Country Segmental Analysis
- 17.12.2. Form
- 17.12.3. Purity Level
- 17.12.4. Production Method
- 17.12.5. Raw Material Source
- 17.12.6. Packaging Type
- 17.12.7. Distribution Channel
- 17.12.8. Technology/Process Type
- 17.12.9. Rated Production Capacity (Annual)
- 17.12.10. End-Use Industry
- 17.13. Rest of Europe Citric Acid Market
- 17.13.1. Country Segmental Analysis
- 17.13.2. Form
- 17.13.3. Purity Level
- 17.13.4. Production Method
- 17.13.5. Raw Material Source
- 17.13.6. Packaging Type
- 17.13.7. Distribution Channel
- 17.13.8. Technology/Process Type
- 17.13.9. Rated Production Capacity (Annual)
- 17.13.10. End-Use Industry
- 18. Asia Pacific Citric Acid Market Analysis
- 18.1. Key Segment Analysis
- 18.2. Regional Snapshot
- 18.3. Asia Pacific Citric Acid Market Size Volume (Metric Tons) and Value (US$ Bn), Analysis, and Forecasts, 2021-2035
- 18.3.1. Form
- 18.3.2. Purity Level
- 18.3.3. Production Method
- 18.3.4. Raw Material Source
- 18.3.5. Packaging Type
- 18.3.6. Distribution Channel
- 18.3.7. Technology/Process Type
- 18.3.8. Rated Production Capacity (Annual)
- 18.3.9. End-Use Industry
- 18.3.10. Country
- 18.3.10.1. China
- 18.3.10.2. India
- 18.3.10.3. Japan
- 18.3.10.4. South Korea
- 18.3.10.5. Australia and New Zealand
- 18.3.10.6. Indonesia
- 18.3.10.7. Malaysia
- 18.3.10.8. Thailand
- 18.3.10.9. Vietnam
- 18.3.10.10. Rest of Asia Pacific
- 18.4. China Citric Acid Market
- 18.4.1. Country Segmental Analysis
- 18.4.2. Form
- 18.4.3. Purity Level
- 18.4.4. Production Method
- 18.4.5. Raw Material Source
- 18.4.6. Packaging Type
- 18.4.7. Distribution Channel
- 18.4.8. Technology/Process Type
- 18.4.9. Rated Production Capacity (Annual)
- 18.4.10. End-Use Industry
- 18.5. India Citric Acid Market
- 18.5.1. Country Segmental Analysis
- 18.5.2. Form
- 18.5.3. Purity Level
- 18.5.4. Production Method
- 18.5.5. Raw Material Source
- 18.5.6. Packaging Type
- 18.5.7. Distribution Channel
- 18.5.8. Technology/Process Type
- 18.5.9. Rated Production Capacity (Annual)
- 18.5.10. End-Use Industry
- 18.6. Japan Citric Acid Market
- 18.6.1. Country Segmental Analysis
- 18.6.2. Form
- 18.6.3. Purity Level
- 18.6.4. Production Method
- 18.6.5. Raw Material Source
- 18.6.6. Packaging Type
- 18.6.7. Distribution Channel
- 18.6.8. Technology/Process Type
- 18.6.9. Rated Production Capacity (Annual)
- 18.6.10. End-Use Industry
- 18.7. South Korea Citric Acid Market
- 18.7.1. Country Segmental Analysis
- 18.7.2. Form
- 18.7.3. Purity Level
- 18.7.4. Production Method
- 18.7.5. Raw Material Source
- 18.7.6. Packaging Type
- 18.7.7. Distribution Channel
- 18.7.8. Technology/Process Type
- 18.7.9. Rated Production Capacity (Annual)
- 18.7.10. End-Use Industry
- 18.8. Australia and New Zealand Citric Acid Market
- 18.8.1. Country Segmental Analysis
- 18.8.2. Form
- 18.8.3. Purity Level
- 18.8.4. Production Method
- 18.8.5. Raw Material Source
- 18.8.6. Packaging Type
- 18.8.7. Distribution Channel
- 18.8.8. Technology/Process Type
- 18.8.9. Rated Production Capacity (Annual)
- 18.8.10. End-Use Industry
- 18.9. Indonesia Citric Acid Market
- 18.9.1. Country Segmental Analysis
- 18.9.2. Form
- 18.9.3. Purity Level
- 18.9.4. Production Method
- 18.9.5. Raw Material Source
- 18.9.6. Packaging Type
- 18.9.7. Distribution Channel
- 18.9.8. Technology/Process Type
- 18.9.9. Rated Production Capacity (Annual)
- 18.9.10. End-Use Industry
- 18.10. Malaysia Citric Acid Market
- 18.10.1. Country Segmental Analysis
- 18.10.2. Form
- 18.10.3. Purity Level
- 18.10.4. Production Method
- 18.10.5. Raw Material Source
- 18.10.6. Packaging Type
- 18.10.7. Distribution Channel
- 18.10.8. Technology/Process Type
- 18.10.9. Rated Production Capacity (Annual)
- 18.10.10. End-Use Industry
- 18.11. Thailand Citric Acid Market
- 18.11.1. Country Segmental Analysis
- 18.11.2. Form
- 18.11.3. Purity Level
- 18.11.4. Production Method
- 18.11.5. Raw Material Source
- 18.11.6. Packaging Type
- 18.11.7. Distribution Channel
- 18.11.8. Technology/Process Type
- 18.11.9. Rated Production Capacity (Annual)
- 18.11.10. End-Use Industry
- 18.12. Vietnam Citric Acid Market
- 18.12.1. Country Segmental Analysis
- 18.12.2. Form
- 18.12.3. Purity Level
- 18.12.4. Production Method
- 18.12.5. Raw Material Source
- 18.12.6. Packaging Type
- 18.12.7. Distribution Channel
- 18.12.8. Technology/Process Type
- 18.12.9. Rated Production Capacity (Annual)
- 18.12.10. End-Use Industry
- 18.13. Rest of Asia Pacific Citric Acid Market
- 18.13.1. Country Segmental Analysis
- 18.13.2. Form
- 18.13.3. Purity Level
- 18.13.4. Production Method
- 18.13.5. Raw Material Source
- 18.13.6. Packaging Type
- 18.13.7. Distribution Channel
- 18.13.8. Technology/Process Type
- 18.13.9. Rated Production Capacity (Annual)
- 18.13.10. End-Use Industry
- 19. Middle East Citric Acid Market Analysis
- 19.1. Key Segment Analysis
- 19.2. Regional Snapshot
- 19.3. Middle East Citric Acid Market Size Volume (Metric Tons) and Value (US$ Bn), Analysis, and Forecasts, 2021-2035
- 19.3.1. Form
- 19.3.2. Purity Level
- 19.3.3. Production Method
- 19.3.4. Raw Material Source
- 19.3.5. Packaging Type
- 19.3.6. Distribution Channel
- 19.3.7. Technology/Process Type
- 19.3.8. Rated Production Capacity (Annual)
- 19.3.9. End-Use Industry
- 19.3.10. Country
- 19.3.10.1. Turkey
- 19.3.10.2. UAE
- 19.3.10.3. Saudi Arabia
- 19.3.10.4. Israel
- 19.3.10.5. Rest of Middle East
- 19.4. Turkey Citric Acid Market
- 19.4.1. Country Segmental Analysis
- 19.4.2. Form
- 19.4.3. Purity Level
- 19.4.4. Production Method
- 19.4.5. Raw Material Source
- 19.4.6. Packaging Type
- 19.4.7. Distribution Channel
- 19.4.8. Technology/Process Type
- 19.4.9. Rated Production Capacity (Annual)
- 19.4.10. End-Use Industry
- 19.5. UAE Citric Acid Market
- 19.5.1. Country Segmental Analysis
- 19.5.2. Form
- 19.5.3. Purity Level
- 19.5.4. Production Method
- 19.5.5. Raw Material Source
- 19.5.6. Packaging Type
- 19.5.7. Distribution Channel
- 19.5.8. Technology/Process Type
- 19.5.9. Rated Production Capacity (Annual)
- 19.5.10. End-Use Industry
- 19.6. Saudi Arabia Citric Acid Market
- 19.6.1. Country Segmental Analysis
- 19.6.2. Form
- 19.6.3. Purity Level
- 19.6.4. Production Method
- 19.6.5. Raw Material Source
- 19.6.6. Packaging Type
- 19.6.7. Distribution Channel
- 19.6.8. Technology/Process Type
- 19.6.9. Rated Production Capacity (Annual)
- 19.6.10. End-Use Industry
- 19.7. Israel Citric Acid Market
- 19.7.1. Country Segmental Analysis
- 19.7.2. Form
- 19.7.3. Purity Level
- 19.7.4. Production Method
- 19.7.5. Raw Material Source
- 19.7.6. Packaging Type
- 19.7.7. Distribution Channel
- 19.7.8. Technology/Process Type
- 19.7.9. Rated Production Capacity (Annual)
- 19.7.10. End-Use Industry
- 19.8. Rest of Middle East Citric Acid Market
- 19.8.1. Country Segmental Analysis
- 19.8.2. Form
- 19.8.3. Purity Level
- 19.8.4. Production Method
- 19.8.5. Raw Material Source
- 19.8.6. Packaging Type
- 19.8.7. Distribution Channel
- 19.8.8. Technology/Process Type
- 19.8.9. Rated Production Capacity (Annual)
- 19.8.10. End-Use Industry
- 20. Africa Citric Acid Market Analysis
- 20.1. Key Segment Analysis
- 20.2. Regional Snapshot
- 20.3. Africa Citric Acid Market Size Volume (Metric Tons) and Value (US$ Bn), Analysis, and Forecasts, 2021-2035
- 20.3.1. Form
- 20.3.2. Purity Level
- 20.3.3. Production Method
- 20.3.4. Raw Material Source
- 20.3.5. Packaging Type
- 20.3.6. Distribution Channel
- 20.3.7. Technology/Process Type
- 20.3.8. Rated Production Capacity (Annual)
- 20.3.9. End-Use Industry
- 20.3.10. country
- 20.3.10.1. South Africa
- 20.3.10.2. Egypt
- 20.3.10.3. Nigeria
- 20.3.10.4. Algeria
- 20.3.10.5. Rest of Africa
- 20.4. South Africa Citric Acid Market
- 20.4.1. Country Segmental Analysis
- 20.4.2. Form
- 20.4.3. Purity Level
- 20.4.4. Production Method
- 20.4.5. Raw Material Source
- 20.4.6. Packaging Type
- 20.4.7. Distribution Channel
- 20.4.8. Technology/Process Type
- 20.4.9. Rated Production Capacity (Annual)
- 20.4.10. End-Use Industry
- 20.5. Egypt Citric Acid Market
- 20.5.1. Country Segmental Analysis
- 20.5.2. Form
- 20.5.3. Purity Level
- 20.5.4. Production Method
- 20.5.5. Raw Material Source
- 20.5.6. Packaging Type
- 20.5.7. Distribution Channel
- 20.5.8. Technology/Process Type
- 20.5.9. Rated Production Capacity (Annual)
- 20.5.10. End-Use Industry
- 20.6. Nigeria Citric Acid Market
- 20.6.1. Country Segmental Analysis
- 20.6.2. Form
- 20.6.3. Purity Level
- 20.6.4. Production Method
- 20.6.5. Raw Material Source
- 20.6.6. Packaging Type
- 20.6.7. Distribution Channel
- 20.6.8. Technology/Process Type
- 20.6.9. Rated Production Capacity (Annual)
- 20.6.10. End-Use Industry
- 20.7. Algeria Citric Acid Market
- 20.7.1. Country Segmental Analysis
- 20.7.2. Form
- 20.7.3. Purity Level
- 20.7.4. Production Method
- 20.7.5. Raw Material Source
- 20.7.6. Packaging Type
- 20.7.7. Distribution Channel
- 20.7.8. Technology/Process Type
- 20.7.9. Rated Production Capacity (Annual)
- 20.7.10. End-Use Industry
- 20.8. Rest of Africa Citric Acid Market
- 20.8.1. Country Segmental Analysis
- 20.8.2. Form
- 20.8.3. Purity Level
- 20.8.4. Production Method
- 20.8.5. Raw Material Source
- 20.8.6. Packaging Type
- 20.8.7. Distribution Channel
- 20.8.8. Technology/Process Type
- 20.8.9. Rated Production Capacity (Annual)
- 20.8.10. End-Use Industry
- 21. South America Citric Acid Market Analysis
- 21.1. Key Segment Analysis
- 21.2. Regional Snapshot
- 21.3. South America Citric Acid Market Size Volume (Metric Tons) and Value (US$ Bn), Analysis, and Forecasts, 2021-2035
- 21.3.1. Form
- 21.3.2. Purity Level
- 21.3.3. Production Method
- 21.3.4. Raw Material Source
- 21.3.5. Packaging Type
- 21.3.6. Distribution Channel
- 21.3.7. Technology/Process Type
- 21.3.8. Rated Production Capacity (Annual)
- 21.3.9. End-Use Industry
- 21.3.10. Country
- 21.3.10.1. Brazil
- 21.3.10.2. Argentina
- 21.3.10.3. Rest of South America
- 21.4. Brazil Citric Acid Market
- 21.4.1. Country Segmental Analysis
- 21.4.2. Form
- 21.4.3. Purity Level
- 21.4.4. Production Method
- 21.4.5. Raw Material Source
- 21.4.6. Packaging Type
- 21.4.7. Distribution Channel
- 21.4.8. Technology/Process Type
- 21.4.9. Rated Production Capacity (Annual)
- 21.4.10. End-Use Industry
- 21.5. Argentina Citric Acid Market
- 21.5.1. Country Segmental Analysis
- 21.5.2. Form
- 21.5.3. Purity Level
- 21.5.4. Production Method
- 21.5.5. Raw Material Source
- 21.5.6. Packaging Type
- 21.5.7. Distribution Channel
- 21.5.8. Technology/Process Type
- 21.5.9. Rated Production Capacity (Annual)
- 21.5.10. End-Use Industry
- 21.6. Rest of South America Citric Acid Market
- 21.6.1. Country Segmental Analysis
- 21.6.2. Form
- 21.6.3. Purity Level
- 21.6.4. Production Method
- 21.6.5. Raw Material Source
- 21.6.6. Packaging Type
- 21.6.7. Distribution Channel
- 21.6.8. Technology/Process Type
- 21.6.9. Rated Production Capacity (Annual)
- 21.6.10. End-Use Industry
- 22. Key Players/ Company Profile
- 22.1. Anhui Bbca Biochemical Co., Ltd.
- 22.1.1. Company Details/ Overview
- 22.1.2. Company Financials
- 22.1.3. Key Customers and Competitors
- 22.1.4. Business/ Industry Portfolio
- 22.1.5. Product Portfolio/ Specification Details
- 22.1.6. Pricing Data
- 22.1.7. Strategic Overview
- 22.1.8. Recent Developments
- 22.2. Archer Daniels Midland Company (ADM)
- 22.3. Baiyin Haogejin Chemical Co., Ltd.
- 22.4. Cargill, Incorporated
- 22.5. Cofco Biochemical Anhui Co., Ltd.
- 22.6. Foodchem International Corporation
- 22.7. Gadot Biochemical Industries Ltd.
- 22.8. Huangshi Xinghua Biochemical Co., Ltd.
- 22.9. Hunan Dongting Citric Acid Chemicals Co., Ltd.
- 22.10. Jiangsu Guoxin Union Energy Co., Ltd.
- 22.11. Jungbunzlauer Suisse AG
- 22.12. Laiwu Taihe Biochemistry Co., Ltd.
- 22.13. Pengcheng Chemical Co., Ltd.
- 22.14. Rzbc Group Co. Ltd.
- 22.15. S.A. Citrique Belge N.V.
- 22.16. Shandong Create Lemon Biochemical Co., Ltd.
- 22.17. Shandong Kaixiang Biochemical Co., Ltd.
- 22.18. Sucroal S.A.
- 22.19. Tate & Lyle PLC
- 22.20. Thai Flour Industry Co., Ltd.
- 22.21. Weifang Ensign Industry Co., Ltd.
- 22.22. Weifang Luyuan Salt Chemical Co., Ltd.
- 22.23. Yixing-Union Biochemical Co., Ltd.
- 22.24. Other Key Players
- 22.1. Anhui Bbca Biochemical Co., Ltd.
Note* - This is just tentative list of players. While providing the report, we will cover more number of players based on their revenue and share for each geography
Research Design
Our research design integrates both demand-side and supply-side analysis through a balanced combination of primary and secondary research methodologies. By utilizing both bottom-up and top-down approaches alongside rigorous data triangulation methods, we deliver robust market intelligence that supports strategic decision-making.
MarketGenics' comprehensive research design framework ensures the delivery of accurate, reliable, and actionable market intelligence. Through the integration of multiple research approaches, rigorous validation processes, and expert analysis, we provide our clients with the insights needed to make informed strategic decisions and capitalize on market opportunities.

MarketGenics leverages a dedicated industry panel of experts and a comprehensive suite of paid databases to effectively collect, consolidate, and analyze market intelligence.
Our approach has consistently proven to be reliable and effective in generating accurate market insights, identifying key industry trends, and uncovering emerging business opportunities.
Through both primary and secondary research, we capture and analyze critical company-level data such as manufacturing footprints, including technical centers, R&D facilities, sales offices, and headquarters.
Our expert panel further enhances our ability to estimate market size for specific brands based on validated field-level intelligence.
Our data mining techniques incorporate both parametric and non-parametric methods, allowing for structured data collection, sorting, processing, and cleaning.
Demand projections are derived from large-scale data sets analyzed through proprietary algorithms, culminating in robust and reliable market sizing.
Research Approach
The bottom-up approach builds market estimates by starting with the smallest addressable market units and systematically aggregating them to create comprehensive market size projections.
This method begins with specific, granular data points and builds upward to create the complete market landscape.
Customer Analysis → Segmental Analysis → Geographical Analysis
The top-down approach starts with the broadest possible market data and systematically narrows it down through a series of filters and assumptions to arrive at specific market segments or opportunities.
This method begins with the big picture and works downward to increasingly specific market slices.
TAM → SAM → SOM


Research Methods
Desk / Secondary Research
While analysing the market, we extensively study secondary sources, directories, and databases to identify and collect information useful for this technical, market-oriented, and commercial report. Secondary sources that we utilize are not only the public sources, but it is a combination of Open Source, Associations, Paid Databases, MG Repository & Knowledgebase, and others.
- Company websites, annual reports, financial reports, broker reports, and investor presentations
- National government documents, statistical databases and reports
- News articles, press releases and web-casts specific to the companies operating in the market, Magazines, reports, and others
- We gather information from commercial data sources for deriving company specific data such as segmental revenue, share for geography, product revenue, and others
- Internal and external proprietary databases (industry-specific), relevant patent, and regulatory databases
- Governing Bodies, Government Organizations
- Relevant Authorities, Country-specific Associations for Industries
We also employ the model mapping approach to estimate the product level market data through the players' product portfolio
Primary Research
Primary research/ interviews is vital in analyzing the market. Most of the cases involves paid primary interviews. Primary sources include primary interviews through e-mail interactions, telephonic interviews, surveys as well as face-to-face interviews with the different stakeholders across the value chain including several industry experts.
| Type of Respondents | Number of Primaries |
|---|---|
| Tier 2/3 Suppliers | ~20 |
| Tier 1 Suppliers | ~25 |
| End-users | ~25 |
| Industry Expert/ Panel/ Consultant | ~30 |
| Total | ~100 |
MG Knowledgebase
• Repository of industry blog, newsletter and case studies
• Online platform covering detailed market reports, and company profiles
Forecasting Factors and Models
Forecasting Factors
- Historical Trends – Past market patterns, cycles, and major events that shaped how markets behave over time. Understanding past trends helps predict future behavior.
- Industry Factors – Specific characteristics of the industry like structure, regulations, and innovation cycles that affect market dynamics.
- Macroeconomic Factors – Economic conditions like GDP growth, inflation, and employment rates that affect how much money people have to spend.
- Demographic Factors – Population characteristics like age, income, and location that determine who can buy your product.
- Technology Factors – How quickly people adopt new technology and how much technology infrastructure exists.
- Regulatory Factors – Government rules, laws, and policies that can help or restrict market growth.
- Competitive Factors – Analyzing competition structure such as degree of competition and bargaining power of buyers and suppliers.
Forecasting Models / Techniques
Multiple Regression Analysis
- Identify and quantify factors that drive market changes
- Statistical modeling to establish relationships between market drivers and outcomes
Time Series Analysis – Seasonal Patterns
- Understand regular cyclical patterns in market demand
- Advanced statistical techniques to separate trend, seasonal, and irregular components
Time Series Analysis – Trend Analysis
- Identify underlying market growth patterns and momentum
- Statistical analysis of historical data to project future trends
Expert Opinion – Expert Interviews
- Gather deep industry insights and contextual understanding
- In-depth interviews with key industry stakeholders
Multi-Scenario Development
- Prepare for uncertainty by modeling different possible futures
- Creating optimistic, pessimistic, and most likely scenarios
Time Series Analysis – Moving Averages
- Sophisticated forecasting for complex time series data
- Auto-regressive integrated moving average models with seasonal components
Econometric Models
- Apply economic theory to market forecasting
- Sophisticated economic models that account for market interactions
Expert Opinion – Delphi Method
- Harness collective wisdom of industry experts
- Structured, multi-round expert consultation process
Monte Carlo Simulation
- Quantify uncertainty and probability distributions
- Thousands of simulations with varying input parameters
Research Analysis
Our research framework is built upon the fundamental principle of validating market intelligence from both demand and supply perspectives. This dual-sided approach ensures comprehensive market understanding and reduces the risk of single-source bias.
Demand-Side Analysis: We understand end-user/application behavior, preferences, and market needs along with the penetration of the product for specific application.
Supply-Side Analysis: We estimate overall market revenue, analyze the segmental share along with industry capacity, competitive landscape, and market structure.
Validation & Evaluation
Data triangulation is a validation technique that uses multiple methods, sources, or perspectives to examine the same research question, thereby increasing the credibility and reliability of research findings. In market research, triangulation serves as a quality assurance mechanism that helps identify and minimize bias, validate assumptions, and ensure accuracy in market estimates.
- Data Source Triangulation – Using multiple data sources to examine the same phenomenon
- Methodological Triangulation – Using multiple research methods to study the same research question
- Investigator Triangulation – Using multiple researchers or analysts to examine the same data
- Theoretical Triangulation – Using multiple theoretical perspectives to interpret the same data

Custom Market Research Services
We will customise the research for you, in case the report listed above does not meet your requirements.
Get 10% Free Customisation