Fortified Food Market Size, Share & Trends Analysis Report by Product Type (Fortified Dairy Products, Fortified Cereals and Cereal-Based Products, Fortified Bakery and Confectionery Products, Fortified Beverages, Fortified Infant Formula and Baby Food, Fortified Fats and Oils, Fortified Snacks and Convenience Foods, Fortified Condiments and Sauces, Others), Nutrient Type, Form, Fortification Type, Packaging Type, Application, End User, Distribution Channel and Geography (North America, Europe, Asia Pacific, Middle East, Africa, and South America) – Global Industry Data, Trends, and Forecasts, 2025–2035
|
Market Structure & Evolution |
|
|
Segmental Data Insights |
|
|
Demand Trends |
|
|
Competitive Landscape |
|
|
Strategic Development |
|
|
Future Outlook & Opportunities |
|
Fortified Food Market Size, Share, and Growth
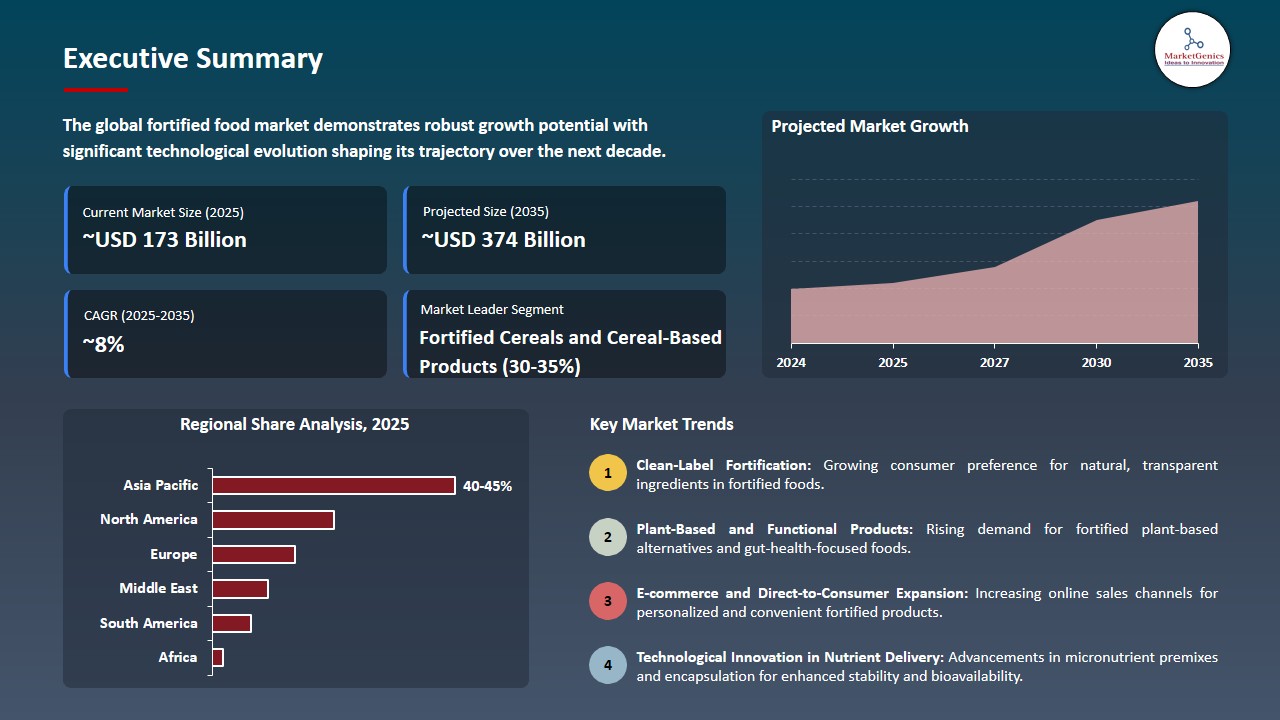
The global fortified food market is experiencing robust growth, with its estimated value of USD 173 billion in the year 2025 and USD 374.3 billion by 2035, registering a CAGR of 8% during the forecast period.
Mike Del Pozo, President of PepsiCo North America Commercial, said, “We looked at the consumer trends, they do not want to compromise between wellness, functionality and what tastes good,” in the context of PepsiCo’s launch of a fiber‑fortified beverage that reflects how major companies are integrating functional fortification into mainstream food products to meet evolving nutritional preferences.
The global fortified food market experiences fast growth because various factors drive its expansion together with new products that provide essential nutrients to combat micronutrient deficiencies while satisfying increased consumer health demands. The Nutriday Orange Pine Dairy Drink which Danone Southern Africa introduced in June 2025 comes with 12 essential vitamins and minerals to provide South African families with complete nutritional support.
ACI Pure Flour Limited launched its product ACI Pure Power Flour Fortified Atta in Bangladesh during 2025 which contains 10 essential vitamins and minerals to help consumers overcome their common dietary nutrient deficiencies.
The demand for fortified foods as a public health solution to combat hidden hunger gets stronger through product innovation and government policies which require staple food fortification in India and Brazil. The market expansion results from three factors which include technological advances in fortification methods and product portfolio growth and government policies which promote healthy food access.
The fortified food market presents adjacent opportunities through manufacturers who use fortified snacks and bars and fortified beverages and biofortified staple crops and functional infant or clinical nutrition products to create diversified product lines that enhance nutritional value while generating additional revenue throughout health-focused food categories.
Fortified Food Market Dynamics and Trends
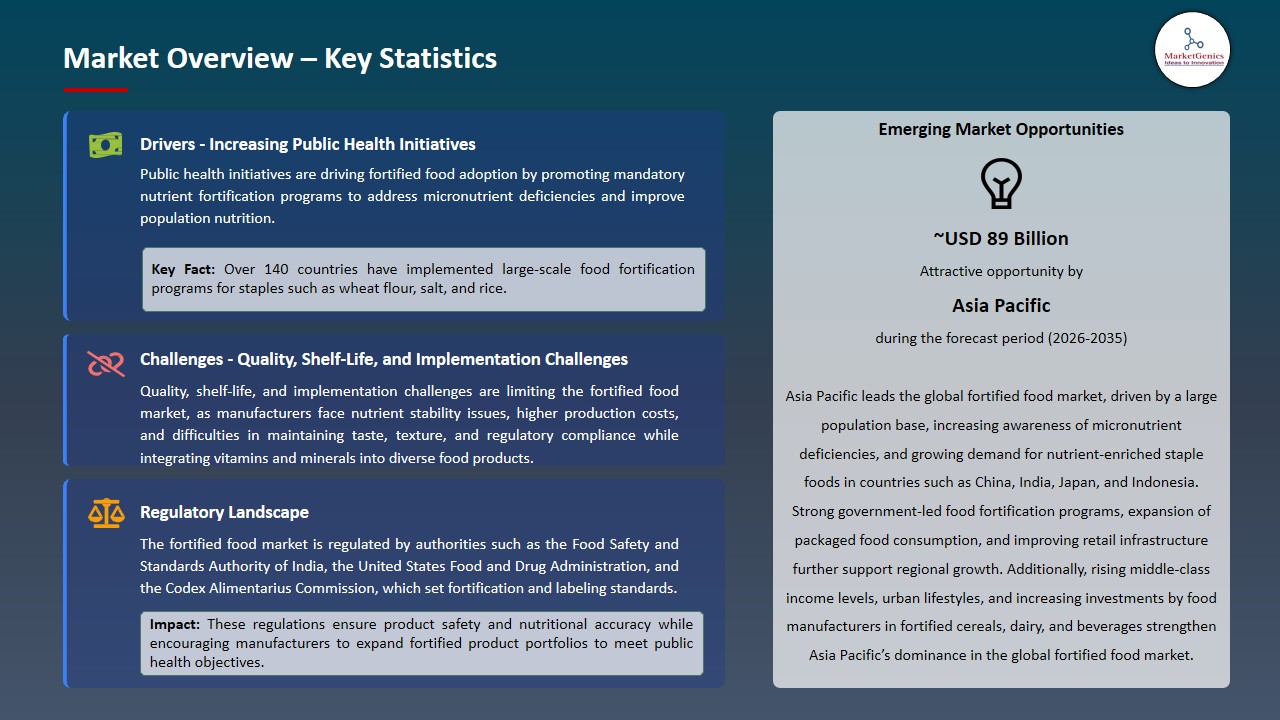
Driver: Increasing Public Health Initiatives Driving Fortified Food Adoption
-
The fortified food market keeps growing because governments and health organizations increase mandatory and voluntary fortification programs to solve micronutrient deficiency problems. The Uttar Pradesh Government in India announced in April 2025 its plan to distribute fortified wheat flour through the Public Distribution System which it developed to fight anemia after the state completed its rice fortification program.
- Millers for Nutrition together with industry partners introduced five new fortified food brands in West Bengal during November 2025 which promoted fortified rice and wheat flour to enhance nutrition results for women and children.
- The World Food Programme's initiative to expand fortified staple distribution throughout Asia-Pacific serves as a public health program which helps people access fortified foods while establishing these items as essential nutritional solutions. All these factors are likely to continue to escalate the growth of the fortified food market.
Restraint: Quality, Shelf‑Life, and Implementation Challenges Restraining Fortified Food Market Growth
-
The operational difficulties of implementation and distribution restrict the growth of fortification programs which are currently expanding. The Indian government decided to stop the distribution of fortified rice through welfare programs in 2026 because they needed to assess the product's shelf life and stability before proceeding.
- The Food Corporation of India rejected large amounts of fortified rice because they did not meet standards which demonstrates the quality compliance and supply chain problems that exist in large-scale fortification programs.
- Manufacturers face their most difficult challenges because complex regulatory systems and changing regional nutrition standards make it hard to synchronize international fortification requirements with health claims. All these elements are expected to restrict the expansion of the fortified food market.
Opportunity: Innovation in Nutrient Delivery and Functional Products
-
Scientific innovation is developing new methods for nutrient fortification through technological advancements. In August 2025, researchers at MIT introduced an iron and iodine fortification toolbox which utilizes metal organic frameworks to enhance nutrient preservation in food and beverage products thus enabling better nutrient delivery systems.
- Manufacturers are responding with fortified product expansions across segments, in March 2025, Danone Southern Africa introduced a new vitamin‑ and mineral‑fortified dairy drink targeting family nutrition needs.
- The increasing demand for plant-based products and gut health solutions has created rising market interest in fiber fortified and prebiotic enriched beverages which will continue to grow as nutritional trends change. And thus, is expected to create more opportunities in future for fortified food market.
Key Trend: Regulatory Action and Food Safety Focus
-
Regulatory authorities have established new rules which require mandatory fortification of certain food products across developed nations. The California law which will take effect in January 2026 mandates that all corn masa flour used for tortilla production must contain folic acid to reduce the risk of neural tube defects.
- The United States Department of Agriculture's food fortification regulations create specific guidelines for the mandatory use of fortified ingredients in designated staple food products.
- Enhanced food safety regulations work together with fortified product certification processes to create improved compliance standards which build consumer trust in fortified foods across international markets. And thus, is expected to influence significant trends in the fortified food market.
Fortified Food Market Analysis and Segmental Data
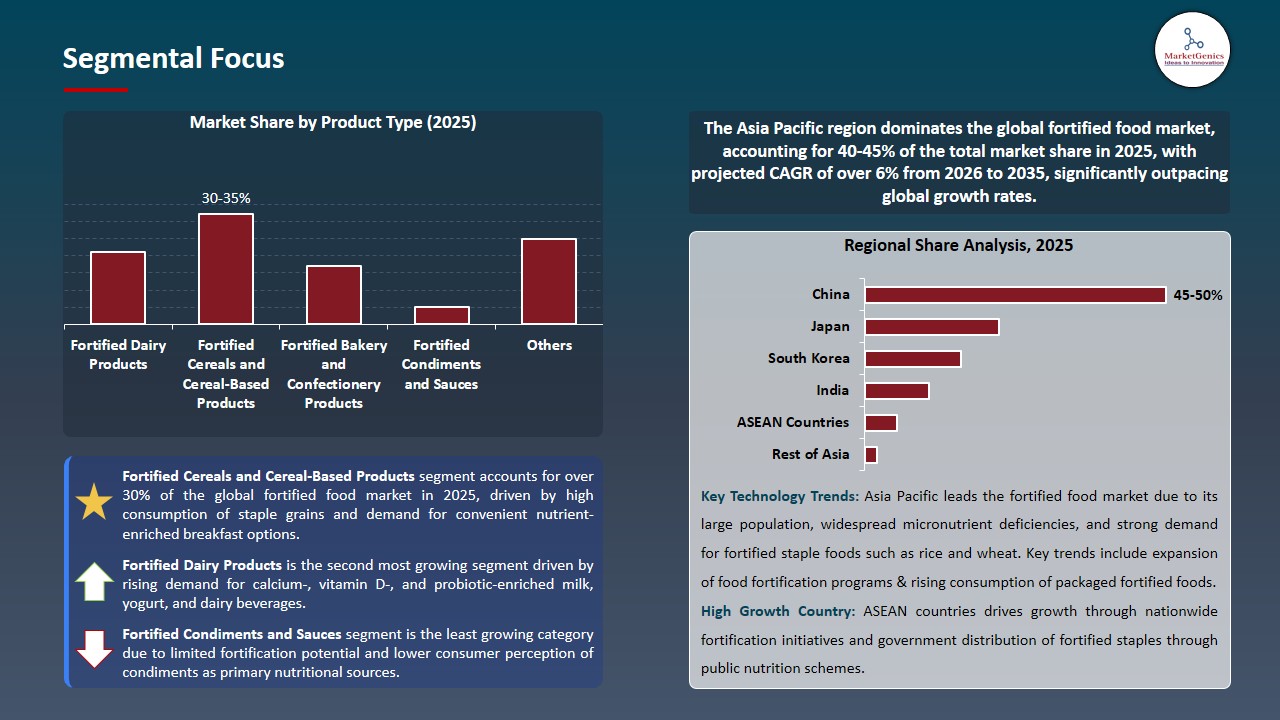
Fortified Cereals and Cereal-Based Products Dominates Global Fortified Food Market amid Rising Health Awareness and Micronutrient Deficiency Concerns
-
The global fortified food market is currently led by fortified cereals and cereal-based products because people are becoming more health conscious while they battle micronutrient deficiencies. The products provide convenient solutions which contain essential nutrients and enable people to include them in their everyday meals while using them as effective methods to deliver essential vitamins and minerals which people need to complete their daily nutritional requirements.
- The North America and Asia Pacific markets experienced strong growth for fortified breakfast cereals in 2025 because consumers wanted high-fiber products which contained essential micronutrients and needed quick meals which provided nutritional value.
- The segment gains advantages from new formulation developments which create products that support immunity and energy and digestive health and from the growing distribution networks which include online shopping platforms and supermarket stores, strengthening fortified cereals and cereal-based products segment in fortified food market.
Asia Pacific Dominates the Fortified Food Market amid Rapid Population Growth, Rising Health Awareness, and Government Nutrition Initiatives
-
The fortified food market in Asia Pacific movement which shows population growth patterns and increasing health awareness and government efforts to improve nutrition. The region's large and growing population increases overall food consumption and creates a unique opportunity for micronutrient delivery through fortified staples that address widespread "hidden hunger."
- Governments in India, China, Sri Lanka, Bangladesh and Pakistan have implemented rice, wheat and flour fortification programs through their public distribution systems and school feeding programs to combat anemia and micronutrient deficiencies. The World Food Programme and ASEAN regional cooperation partnerships both advance the progress of fortification standardization and adoption.
- Rising urbanization and expanding middle classes together with increased consumer focus on preventive health drive greater demand for fortified packaged foods throughout Asia Pacific markets, underscoring Asia Pacific’s dominance in the global fortified food market.
Fortified Food Market Ecosystem
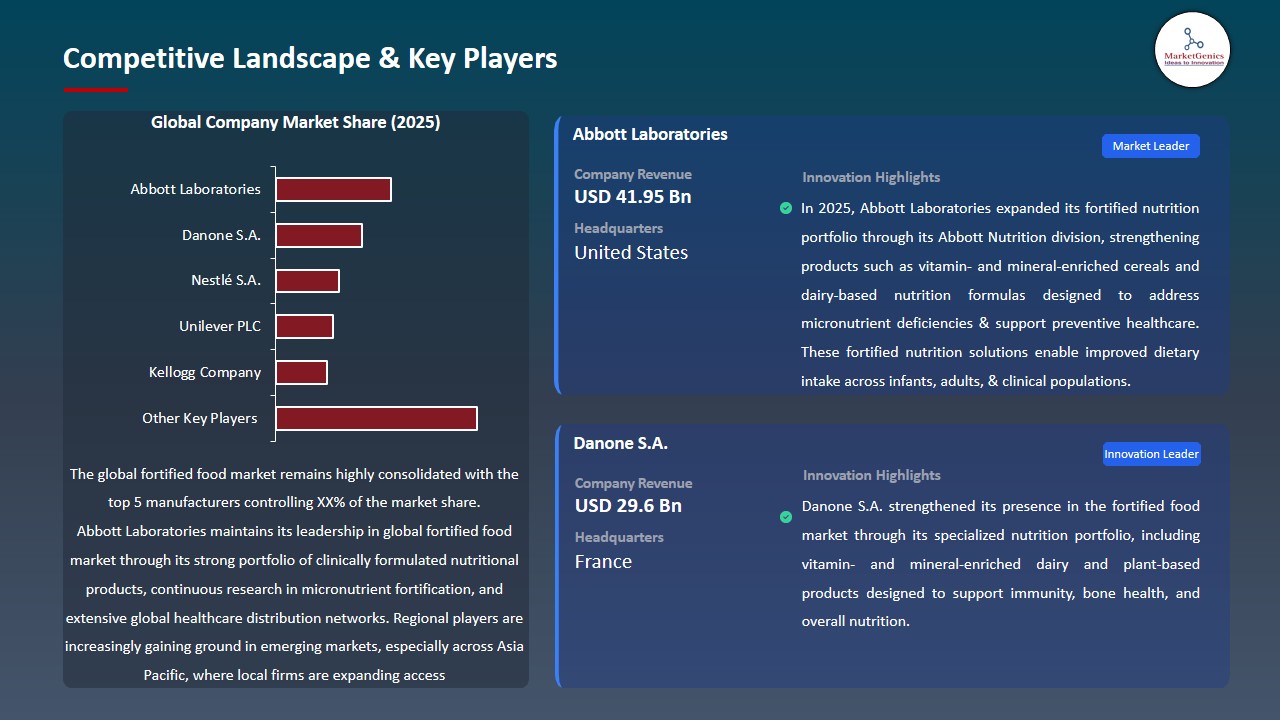
The global fortified food market shows moderate fragmentation because mid-level concentration exists between Nestlé and Danone and General Mills who represent Tier 1 market players while Tier 2 and Tier 3 companies concentrate on regional and niche markets.
The main value chain elements identify micronutrient premix formulation which maintains nutrient stability and processing and quality certification that establishes compliance with regulatory requirements. Tata Chemicals will expand its fortified salt production capacity in India during 2025 to enhance its supply capabilities which meet the increasing demand for nutrient-enriched foods.
Recent Development and Strategic Overview:
-
In December 2025, The Lagos State Government established a locally fortified rice program which provides the Eko Rice product that contains iron zinc vitamin B12 folic acid pyridoxine niacin and thiamine to enhance nutrition and food security throughout the region. This government‑backed programme enhances affordable access to fortified staples and supports widespread micronutrient intervention in Nigeria’s food system.
- In August 2025, The Government of India extended its flagship fortified rice scheme under national food safety programmes through 2028, backed by a ₹17,082 crore budget to continue distribution of rice fortified with iron, folic acid, and vitamin B12 via public distribution systems to combat anemia and micronutrient deficiencies at scale.
Report Scope
|
Attribute |
Detail |
|
Market Size in 2025 |
USD 173 Bn |
|
Market Forecast Value in 2035 |
USD 374.3 Bn |
|
Growth Rate (CAGR) |
8% |
|
Forecast Period |
2025 – 2035 |
|
Historical Data Available for |
2020 – 2024 |
|
Market Size Units |
USD Billion for Value |
|
Report Format |
Electronic (PDF) + Excel |
|
Regions and Countries Covered |
|||||
|
North America |
Europe |
Asia Pacific |
Middle East |
Africa |
South America |
|
|
|
|
|
|
|
Companies Covered |
|||||
|
|
|
|
|
|
Fortified Food Market Segmentation and Highlights
|
Segment |
Sub-segment |
|
Fortified Food Market, By Product Type |
|
|
Fortified Food Market, By Nutrient Type |
|
|
Fortified Food Market, By Form |
|
|
Fortified Food Market, By Fortification Type |
|
|
Fortified Food Market, By Packaging Type |
|
|
Fortified Food Market, By Application |
|
|
Fortified Food Market, By End User |
|
|
Fortified Food Market, By Distribution Channel |
|
Frequently Asked Questions
Table of Contents
- 1. Research Methodology and Assumptions
- 1.1. Definitions
- 1.2. Research Design and Approach
- 1.3. Data Collection Methods
- 1.4. Base Estimates and Calculations
- 1.5. Forecasting Models
- 1.5.1. Key Forecast Factors & Impact Analysis
- 1.6. Secondary Research
- 1.6.1. Open Sources
- 1.6.2. Paid Databases
- 1.6.3. Associations
- 1.7. Primary Research
- 1.7.1. Primary Sources
- 1.7.2. Primary Interviews with Stakeholders across Ecosystem
- 2. Executive Summary
- 2.1. Global Fortified Food Market Outlook
- 2.1.1. Fortified Food Market Size (Value - US$ Bn), and Forecasts, 2021-2035
- 2.1.2. Compounded Annual Growth Rate Analysis
- 2.1.3. Growth Opportunity Analysis
- 2.1.4. Segmental Share Analysis
- 2.1.5. Geographical Share Analysis
- 2.2. Market Analysis and Facts
- 2.3. Supply-Demand Analysis
- 2.4. Competitive Benchmarking
- 2.5. Go-to- Market Strategy
- 2.5.1. Customer/ End-use Industry Assessment
- 2.5.2. Growth Opportunity Data, 2026-2035
- 2.5.2.1. Regional Data
- 2.5.2.2. Country Data
- 2.5.2.3. Segmental Data
- 2.5.3. Identification of Potential Market Spaces
- 2.5.4. GAP Analysis
- 2.5.5. Potential Attractive Price Points
- 2.5.6. Prevailing Market Risks & Challenges
- 2.5.7. Preferred Sales & Marketing Strategies
- 2.5.8. Key Recommendations and Analysis
- 2.5.9. A Way Forward
- 2.1. Global Fortified Food Market Outlook
- 3. Industry Data and Premium Insights
- 3.1. Global Food & Beverages Industry Overview, 2025
- 3.1.1. Food & Beverages Industry Analysis
- 3.1.2. Key Trends for Food & Beverages Industry
- 3.1.3. Regional Distribution for Food & Beverages Industry
- 3.2. Supplier Customer Data
- 3.3. Technology Roadmap and Developments
- 3.1. Global Food & Beverages Industry Overview, 2025
- 4. Market Overview
- 4.1. Market Dynamics
- 4.1.1. Drivers
- 4.1.1.1. Rising health awareness and demand for nutrient-enriched foods are boosting fortified food consumption.
- 4.1.1.2. Government-led fortification programs for staple foods are expanding market adoption.
- 4.1.1.3. Growing demand for functional and convenient packaged foods is accelerating fortified product development.
- 4.1.2. Restraints
- 4.1.2.1. Nutrient stability and shelf-life challenges affect the quality and effectiveness of fortified foods.
- 4.1.2.2. Higher production costs due to micronutrient premixes and quality compliance limit manufacturer margins.
- 4.1.1. Drivers
- 4.2. Key Trend Analysis
- 4.3. Regulatory Framework
- 4.3.1. Key Regulations, Norms, and Subsidies, by Key Countries
- 4.3.2. Tariffs and Standards
- 4.3.3. Impact Analysis of Regulations on the Market
- 4.4. Value Chain Analysis
- 4.5. Cost Structure Analysis
- 4.6. Porter’s Five Forces Analysis
- 4.7. PESTEL Analysis
- 4.8. Global Fortified Food Market Demand
- 4.8.1. Historical Market Size – Value (US$ Bn) and Volume – (Billion Units), 2020-2024
- 4.8.2. Current and Future Market Size – Value (US$ Bn) and Volume – (Billion Units), 2026–2035
- 4.8.2.1. Y-o-Y Growth Trends
- 4.8.2.2. Absolute $ Opportunity Assessment
- 4.1. Market Dynamics
- 5. Competition Landscape
- 5.1. Competition structure
- 5.1.1. Fragmented v/s consolidated
- 5.2. Company Share Analysis, 2025
- 5.2.1. Global Company Market Share
- 5.2.2. By Region
- 5.2.2.1. North America
- 5.2.2.2. Europe
- 5.2.2.3. Asia Pacific
- 5.2.2.4. Middle East
- 5.2.2.5. Africa
- 5.2.2.6. South America
- 5.3. Product Comparison Matrix
- 5.3.1. Specifications
- 5.3.2. Market Positioning
- 5.3.3. Pricing
- 5.1. Competition structure
- 6. Global Fortified Food Market Analysis, by Product Type
- 6.1. Key Segment Analysis
- 6.2. Fortified Food Market Size (Value - US$ Bn), Analysis, and Forecasts, by Product Type, 2021-2035
- 6.2.1. Fortified Dairy Products
- 6.2.2. Fortified Cereals and Cereal-Based Products
- 6.2.3. Fortified Bakery and Confectionery Products
- 6.2.4. Fortified Beverages
- 6.2.5. Fortified Infant Formula and Baby Food
- 6.2.6. Fortified Fats and Oils
- 6.2.7. Fortified Snacks and Convenience Foods
- 6.2.8. Fortified Condiments and Sauces
- 6.2.9. Others
- 7. Global Fortified Food Market Analysis, by Nutrient Type
- 7.1. Key Segment Analysis
- 7.2. Fortified Food Market Size (Value - US$ Bn), Analysis, and Forecasts, by Nutrient Type, 2021-2035
- 7.2.1. Vitamins
- 7.2.2. Minerals
- 7.2.3. Proteins and Amino Acids
- 7.2.4. Dietary Fibers
- 7.2.5. Omega-3 Fatty Acids
- 7.2.6. Probiotics and Prebiotics
- 7.2.7. Antioxidants
- 7.2.8. Others
- 8. Global Fortified Food Market Analysis, by Form
- 8.1. Key Segment Analysis
- 8.2. Fortified Food Market Size (Value - US$ Bn), Analysis, and Forecasts, by Form, 2021-2035
- 8.2.1. Solid
- 8.2.2. Liquid
- 8.2.3. Powder
- 8.2.4. Semi-Solid
- 9. Global Fortified Food Market Analysis, by Fortification Type
- 9.1. Key Segment Analysis
- 9.2. Fortified Food Market Size (Value - US$ Bn), Analysis, and Forecasts, by Fortification Type, 2021-2035
- 9.2.1. Mass Fortification
- 9.2.2. Targeted Fortification
- 9.2.3. Market-Driven Fortification
- 9.2.4. Biofortification
- 10. Global Fortified Food Market Analysis, by Packaging Type
- 10.1. Key Segment Analysis
- 10.2. Fortified Food Market Size (Value - US$ Bn), Analysis, and Forecasts, by Packaging Type, 2021-2035
- 10.2.1. Pouches
- 10.2.2. Bottles and Jars
- 10.2.3. Cartons
- 10.2.4. Cans
- 10.2.5. Boxes
- 10.2.6. Sachets
- 10.2.7. Others
- 11. Global Fortified Food Market Analysis, by Application
- 11.1. Key Segment Analysis
- 11.2. Fortified Food Market Size (Value - US$ Bn), Analysis, and Forecasts, by Application, 2021-2035
- 11.2.1. General Health and Wellness
- 11.2.2. Bone Health
- 11.2.3. Digestive Health
- 11.2.4. Immune Support
- 11.2.5. Heart Health
- 11.2.6. Energy and Metabolism
- 11.2.7. Maternal and Infant Nutrition
- 11.2.8. Others
- 12. Global Fortified Food Market Analysis, by End User
- 12.1. Key Segment Analysis
- 12.2. Fortified Food Market Size (Value - US$ Bn), Analysis, and Forecasts, by End User, 2021-2035
- 12.2.1. Infants and Children
- 12.2.2. Adults
- 12.2.3. Pregnant Women
- 12.2.4. Geriatric Population
- 12.2.5. Athletes and Fitness Enthusiasts
- 12.2.6. Others
- 13. Global Fortified Food Market Analysis, by Distribution Channel
- 13.1. Key Segment Analysis
- 13.2. Fortified Food Market Size (Value - US$ Bn), Analysis, and Forecasts, by Distribution Channel, 2021-2035
- 13.2.1. Supermarkets and Hypermarkets
- 13.2.2. Convenience Stores
- 13.2.3. Specialty Stores
- 13.2.4. Online Retail
- 13.2.5. Pharmacies and Drug Stores
- 13.2.6. Others
- 14. Global Fortified Food Market Analysis and Forecasts, by Region
- 14.1. Key Findings
- 14.2. Fortified Food Market Size (Value - US$ Bn), Analysis, and Forecasts, by Region, 2021-2035
- 14.2.1. North America
- 14.2.2. Europe
- 14.2.3. Asia Pacific
- 14.2.4. Middle East
- 14.2.5. Africa
- 14.2.6. South America
- 15. North America Fortified Food Market Analysis
- 15.1. Key Segment Analysis
- 15.2. Regional Snapshot
- 15.3. North America Fortified Food Market Size (Value - US$ Bn), Analysis, and Forecasts, 2021-2035
- 15.3.1. Product Type
- 15.3.2. Nutrient Type
- 15.3.3. Form
- 15.3.4. Fortification Type
- 15.3.5. Packaging Type
- 15.3.6. Application
- 15.3.7. End User
- 15.3.8. Distribution Channel
- 15.3.9. Country
- 15.3.9.1. USA
- 15.3.9.2. Canada
- 15.3.9.3. Mexico
- 15.4. USA Fortified Food Market
- 15.4.1. Country Segmental Analysis
- 15.4.2. Product Type
- 15.4.3. Nutrient Type
- 15.4.4. Form
- 15.4.5. Fortification Type
- 15.4.6. Packaging Type
- 15.4.7. Application
- 15.4.8. End User
- 15.4.9. Distribution Channel
- 15.5. Canada Fortified Food Market
- 15.5.1. Country Segmental Analysis
- 15.5.2. Product Type
- 15.5.3. Nutrient Type
- 15.5.4. Form
- 15.5.5. Fortification Type
- 15.5.6. Packaging Type
- 15.5.7. Application
- 15.5.8. End User
- 15.5.9. Distribution Channel
- 15.6. Mexico Fortified Food Market
- 15.6.1. Country Segmental Analysis
- 15.6.2. Product Type
- 15.6.3. Nutrient Type
- 15.6.4. Form
- 15.6.5. Fortification Type
- 15.6.6. Packaging Type
- 15.6.7. Application
- 15.6.8. End User
- 15.6.9. Distribution Channel
- 16. Europe Fortified Food Market Analysis
- 16.1. Key Segment Analysis
- 16.2. Regional Snapshot
- 16.3. Europe Fortified Food Market Size (Value - US$ Bn), Analysis, and Forecasts, 2021-2035
- 16.3.1. Product Type
- 16.3.2. Nutrient Type
- 16.3.3. Form
- 16.3.4. Fortification Type
- 16.3.5. Packaging Type
- 16.3.6. Application
- 16.3.7. End User
- 16.3.8. Distribution Channel
- 16.3.9. Country
- 16.3.9.1. Germany
- 16.3.9.2. United Kingdom
- 16.3.9.3. France
- 16.3.9.4. Italy
- 16.3.9.5. Spain
- 16.3.9.6. Netherlands
- 16.3.9.7. Nordic Countries
- 16.3.9.8. Poland
- 16.3.9.9. Russia & CIS
- 16.3.9.10. Rest of Europe
- 16.4. Germany Fortified Food Market
- 16.4.1. Country Segmental Analysis
- 16.4.2. Product Type
- 16.4.3. Nutrient Type
- 16.4.4. Form
- 16.4.5. Fortification Type
- 16.4.6. Packaging Type
- 16.4.7. Application
- 16.4.8. End User
- 16.4.9. Distribution Channel
- 16.5. United Kingdom Fortified Food Market
- 16.5.1. Country Segmental Analysis
- 16.5.2. Product Type
- 16.5.3. Nutrient Type
- 16.5.4. Form
- 16.5.5. Fortification Type
- 16.5.6. Packaging Type
- 16.5.7. Application
- 16.5.8. End User
- 16.5.9. Distribution Channel
- 16.6. France Fortified Food Market
- 16.6.1. Country Segmental Analysis
- 16.6.2. Product Type
- 16.6.3. Nutrient Type
- 16.6.4. Form
- 16.6.5. Fortification Type
- 16.6.6. Packaging Type
- 16.6.7. Application
- 16.6.8. End User
- 16.6.9. Distribution Channel
- 16.7. Italy Fortified Food Market
- 16.7.1. Country Segmental Analysis
- 16.7.2. Product Type
- 16.7.3. Nutrient Type
- 16.7.4. Form
- 16.7.5. Fortification Type
- 16.7.6. Packaging Type
- 16.7.7. Application
- 16.7.8. End User
- 16.7.9. Distribution Channel
- 16.8. Spain Fortified Food Market
- 16.8.1. Country Segmental Analysis
- 16.8.2. Product Type
- 16.8.3. Nutrient Type
- 16.8.4. Form
- 16.8.5. Fortification Type
- 16.8.6. Packaging Type
- 16.8.7. Application
- 16.8.8. End User
- 16.8.9. Distribution Channel
- 16.9. Netherlands Fortified Food Market
- 16.9.1. Country Segmental Analysis
- 16.9.2. Product Type
- 16.9.3. Nutrient Type
- 16.9.4. Form
- 16.9.5. Fortification Type
- 16.9.6. Packaging Type
- 16.9.7. Application
- 16.9.8. End User
- 16.9.9. Distribution Channel
- 16.10. Nordic Countries Fortified Food Market
- 16.10.1. Country Segmental Analysis
- 16.10.2. Product Type
- 16.10.3. Nutrient Type
- 16.10.4. Form
- 16.10.5. Fortification Type
- 16.10.6. Packaging Type
- 16.10.7. Application
- 16.10.8. End User
- 16.10.9. Distribution Channel
- 16.11. Poland Fortified Food Market
- 16.11.1. Country Segmental Analysis
- 16.11.2. Product Type
- 16.11.3. Nutrient Type
- 16.11.4. Form
- 16.11.5. Fortification Type
- 16.11.6. Packaging Type
- 16.11.7. Application
- 16.11.8. End User
- 16.11.9. Distribution Channel
- 16.12. Russia & CIS Fortified Food Market
- 16.12.1. Country Segmental Analysis
- 16.12.2. Product Type
- 16.12.3. Nutrient Type
- 16.12.4. Form
- 16.12.5. Fortification Type
- 16.12.6. Packaging Type
- 16.12.7. Application
- 16.12.8. End User
- 16.12.9. Distribution Channel
- 16.13. Rest of Europe Fortified Food Market
- 16.13.1. Country Segmental Analysis
- 16.13.2. Product Type
- 16.13.3. Nutrient Type
- 16.13.4. Form
- 16.13.5. Fortification Type
- 16.13.6. Packaging Type
- 16.13.7. Application
- 16.13.8. End User
- 16.13.9. Distribution Channel
- 17. Asia Pacific Fortified Food Market Analysis
- 17.1. Key Segment Analysis
- 17.2. Regional Snapshot
- 17.3. Asia Pacific Fortified Food Market Size (Value - US$ Bn), Analysis, and Forecasts, 2021-2035
- 17.3.1. Product Type
- 17.3.2. Nutrient Type
- 17.3.3. Form
- 17.3.4. Fortification Type
- 17.3.5. Packaging Type
- 17.3.6. Application
- 17.3.7. End User
- 17.3.8. Distribution Channel
- 17.3.9. Country
- 17.3.9.1. China
- 17.3.9.2. India
- 17.3.9.3. Japan
- 17.3.9.4. South Korea
- 17.3.9.5. Australia and New Zealand
- 17.3.9.6. Indonesia
- 17.3.9.7. Malaysia
- 17.3.9.8. Thailand
- 17.3.9.9. Vietnam
- 17.3.9.10. Rest of Asia Pacific
- 17.4. China Fortified Food Market
- 17.4.1. Country Segmental Analysis
- 17.4.2. Product Type
- 17.4.3. Nutrient Type
- 17.4.4. Form
- 17.4.5. Fortification Type
- 17.4.6. Packaging Type
- 17.4.7. Application
- 17.4.8. End User
- 17.4.9. Distribution Channel
- 17.5. India Fortified Food Market
- 17.5.1. Country Segmental Analysis
- 17.5.2. Product Type
- 17.5.3. Nutrient Type
- 17.5.4. Form
- 17.5.5. Fortification Type
- 17.5.6. Packaging Type
- 17.5.7. Application
- 17.5.8. End User
- 17.5.9. Distribution Channel
- 17.6. Japan Fortified Food Market
- 17.6.1. Country Segmental Analysis
- 17.6.2. Product Type
- 17.6.3. Nutrient Type
- 17.6.4. Form
- 17.6.5. Fortification Type
- 17.6.6. Packaging Type
- 17.6.7. Application
- 17.6.8. End User
- 17.6.9. Distribution Channel
- 17.7. South Korea Fortified Food Market
- 17.7.1. Country Segmental Analysis
- 17.7.2. Product Type
- 17.7.3. Nutrient Type
- 17.7.4. Form
- 17.7.5. Fortification Type
- 17.7.6. Packaging Type
- 17.7.7. Application
- 17.7.8. End User
- 17.7.9. Distribution Channel
- 17.8. Australia and New Zealand Fortified Food Market
- 17.8.1. Country Segmental Analysis
- 17.8.2. Product Type
- 17.8.3. Nutrient Type
- 17.8.4. Form
- 17.8.5. Fortification Type
- 17.8.6. Packaging Type
- 17.8.7. Application
- 17.8.8. End User
- 17.8.9. Distribution Channel
- 17.9. Indonesia Fortified Food Market
- 17.9.1. Country Segmental Analysis
- 17.9.2. Product Type
- 17.9.3. Nutrient Type
- 17.9.4. Form
- 17.9.5. Fortification Type
- 17.9.6. Packaging Type
- 17.9.7. Application
- 17.9.8. End User
- 17.9.9. Distribution Channel
- 17.10. Malaysia Fortified Food Market
- 17.10.1. Country Segmental Analysis
- 17.10.2. Product Type
- 17.10.3. Nutrient Type
- 17.10.4. Form
- 17.10.5. Fortification Type
- 17.10.6. Packaging Type
- 17.10.7. Application
- 17.10.8. End User
- 17.10.9. Distribution Channel
- 17.11. Thailand Fortified Food Market
- 17.11.1. Country Segmental Analysis
- 17.11.2. Product Type
- 17.11.3. Nutrient Type
- 17.11.4. Form
- 17.11.5. Fortification Type
- 17.11.6. Packaging Type
- 17.11.7. Application
- 17.11.8. End User
- 17.11.9. Distribution Channel
- 17.12. Vietnam Fortified Food Market
- 17.12.1. Country Segmental Analysis
- 17.12.2. Product Type
- 17.12.3. Nutrient Type
- 17.12.4. Form
- 17.12.5. Fortification Type
- 17.12.6. Packaging Type
- 17.12.7. Application
- 17.12.8. End User
- 17.12.9. Distribution Channel
- 17.13. Rest of Asia Pacific Fortified Food Market
- 17.13.1. Country Segmental Analysis
- 17.13.2. Product Type
- 17.13.3. Nutrient Type
- 17.13.4. Form
- 17.13.5. Fortification Type
- 17.13.6. Packaging Type
- 17.13.7. Application
- 17.13.8. End User
- 17.13.9. Distribution Channel
- 18. Middle East Fortified Food Market Analysis
- 18.1. Key Segment Analysis
- 18.2. Regional Snapshot
- 18.3. Middle East Fortified Food Market Size (Value - US$ Bn), Analysis, and Forecasts, 2021-2035
- 18.3.1. Product Type
- 18.3.2. Nutrient Type
- 18.3.3. Form
- 18.3.4. Fortification Type
- 18.3.5. Packaging Type
- 18.3.6. Application
- 18.3.7. End User
- 18.3.8. Distribution Channel
- 18.3.9. Country
- 18.3.9.1. Turkey
- 18.3.9.2. UAE
- 18.3.9.3. Saudi Arabia
- 18.3.9.4. Israel
- 18.3.9.5. Rest of Middle East
- 18.4. Turkey Fortified Food Market
- 18.4.1. Country Segmental Analysis
- 18.4.2. Product Type
- 18.4.3. Nutrient Type
- 18.4.4. Form
- 18.4.5. Fortification Type
- 18.4.6. Packaging Type
- 18.4.7. Application
- 18.4.8. End User
- 18.4.9. Distribution Channel
- 18.5. UAE Fortified Food Market
- 18.5.1. Country Segmental Analysis
- 18.5.2. Product Type
- 18.5.3. Nutrient Type
- 18.5.4. Form
- 18.5.5. Fortification Type
- 18.5.6. Packaging Type
- 18.5.7. Application
- 18.5.8. End User
- 18.5.9. Distribution Channel
- 18.6. Saudi Arabia Fortified Food Market
- 18.6.1. Country Segmental Analysis
- 18.6.2. Product Type
- 18.6.3. Nutrient Type
- 18.6.4. Form
- 18.6.5. Fortification Type
- 18.6.6. Packaging Type
- 18.6.7. Application
- 18.6.8. End User
- 18.6.9. Distribution Channel
- 18.7. Israel Fortified Food Market
- 18.7.1. Country Segmental Analysis
- 18.7.2. Product Type
- 18.7.3. Nutrient Type
- 18.7.4. Form
- 18.7.5. Fortification Type
- 18.7.6. Packaging Type
- 18.7.7. Application
- 18.7.8. End User
- 18.7.9. Distribution Channel
- 18.8. Rest of Middle East Fortified Food Market
- 18.8.1. Country Segmental Analysis
- 18.8.2. Product Type
- 18.8.3. Nutrient Type
- 18.8.4. Form
- 18.8.5. Fortification Type
- 18.8.6. Packaging Type
- 18.8.7. Application
- 18.8.8. End User
- 18.8.9. Distribution Channel
- 19. Africa Fortified Food Market Analysis
- 19.1. Key Segment Analysis
- 19.2. Regional Snapshot
- 19.3. Africa Fortified Food Market Size (Value - US$ Bn), Analysis, and Forecasts, 2021-2035
- 19.3.1. Product Type
- 19.3.2. Nutrient Type
- 19.3.3. Form
- 19.3.4. Fortification Type
- 19.3.5. Packaging Type
- 19.3.6. Application
- 19.3.7. End User
- 19.3.8. Distribution Channel
- 19.3.9. Country
- 19.3.9.1. South Africa
- 19.3.9.2. Egypt
- 19.3.9.3. Nigeria
- 19.3.9.4. Algeria
- 19.3.9.5. Rest of Africa
- 19.4. South Africa Fortified Food Market
- 19.4.1. Country Segmental Analysis
- 19.4.2. Product Type
- 19.4.3. Nutrient Type
- 19.4.4. Form
- 19.4.5. Fortification Type
- 19.4.6. Packaging Type
- 19.4.7. Application
- 19.4.8. End User
- 19.4.9. Distribution Channel
- 19.5. Egypt Fortified Food Market
- 19.5.1. Country Segmental Analysis
- 19.5.2. Product Type
- 19.5.3. Nutrient Type
- 19.5.4. Form
- 19.5.5. Fortification Type
- 19.5.6. Packaging Type
- 19.5.7. Application
- 19.5.8. End User
- 19.5.9. Distribution Channel
- 19.6. Nigeria Fortified Food Market
- 19.6.1. Country Segmental Analysis
- 19.6.2. Product Type
- 19.6.3. Nutrient Type
- 19.6.4. Form
- 19.6.5. Fortification Type
- 19.6.6. Packaging Type
- 19.6.7. Application
- 19.6.8. End User
- 19.6.9. Distribution Channel
- 19.7. Algeria Fortified Food Market
- 19.7.1. Country Segmental Analysis
- 19.7.2. Product Type
- 19.7.3. Nutrient Type
- 19.7.4. Form
- 19.7.5. Fortification Type
- 19.7.6. Packaging Type
- 19.7.7. Application
- 19.7.8. End User
- 19.7.9. Distribution Channel
- 19.8. Rest of Africa Fortified Food Market
- 19.8.1. Country Segmental Analysis
- 19.8.2. Product Type
- 19.8.3. Nutrient Type
- 19.8.4. Form
- 19.8.5. Fortification Type
- 19.8.6. Packaging Type
- 19.8.7. Application
- 19.8.8. End User
- 19.8.9. Distribution Channel
- 20. South America Fortified Food Market Analysis
- 20.1. Key Segment Analysis
- 20.2. Regional Snapshot
- 20.3. South America Fortified Food Market Size (Value - US$ Bn), Analysis, and Forecasts, 2021-2035
- 20.3.1. Product Type
- 20.3.2. Nutrient Type
- 20.3.3. Form
- 20.3.4. Fortification Type
- 20.3.5. Packaging Type
- 20.3.6. Application
- 20.3.7. End User
- 20.3.8. Distribution Channel
- 20.3.9. Country
- 20.3.9.1. Brazil
- 20.3.9.2. Argentina
- 20.3.9.3. Rest of South America
- 20.4. Brazil Fortified Food Market
- 20.4.1. Country Segmental Analysis
- 20.4.2. Product Type
- 20.4.3. Nutrient Type
- 20.4.4. Form
- 20.4.5. Fortification Type
- 20.4.6. Packaging Type
- 20.4.7. Application
- 20.4.8. End User
- 20.4.9. Distribution Channel
- 20.5. Argentina Fortified Food Market
- 20.5.1. Country Segmental Analysis
- 20.5.2. Product Type
- 20.5.3. Nutrient Type
- 20.5.4. Form
- 20.5.5. Fortification Type
- 20.5.6. Packaging Type
- 20.5.7. Application
- 20.5.8. End User
- 20.5.9. Distribution Channel
- 20.6. Rest of South America Fortified Food Market
- 20.6.1. Country Segmental Analysis
- 20.6.2. Product Type
- 20.6.3. Nutrient Type
- 20.6.4. Form
- 20.6.5. Fortification Type
- 20.6.6. Packaging Type
- 20.6.7. Application
- 20.6.8. End User
- 20.6.9. Distribution Channel
- 21. Key Players/ Company Profile
- 21.1. Amy’s Kitchen, Inc.
- 21.1.1. Company Details/ Overview
- 21.1.2. Company Financials
- 21.1.3. Key Customers and Competitors
- 21.1.4. Business/ Industry Portfolio
- 21.1.5. Product Portfolio/ Specification Details
- 21.1.6. Pricing Data
- 21.1.7. Strategic Overview
- 21.1.8. Recent Developments
- 21.2. Beyond Meat, Inc.
- 21.3. Blue Diamond Growers
- 21.4. Califia Farms, LLC
- 21.5. Conagra Brands, Inc.
- 21.6. Daiya Foods Inc.
- 21.7. Danone S.A.
- 21.8. Field Roast Grain Meat Co.
- 21.9. Flora Food Group
- 21.10. Impossible Foods Inc.
- 21.11. Kellogg Company
- 21.12. Kite Hill
- 21.13. Nestlé S.A.
- 21.14. NotCo
- 21.15. Oatly Group AB
- 21.16. Quorn Foods
- 21.17. Redefine Meat Ltd.
- 21.18. The Tofurky Company
- 21.19. Unilever PLC
- 21.20. V2Food
- 21.21. Other Key Players
- 21.1. Amy’s Kitchen, Inc.
Note* - This is just tentative list of players. While providing the report, we will cover more number of players based on their revenue and share for each geography
Research Design
Our research design integrates both demand-side and supply-side analysis through a balanced combination of primary and secondary research methodologies. By utilizing both bottom-up and top-down approaches alongside rigorous data triangulation methods, we deliver robust market intelligence that supports strategic decision-making.
MarketGenics' comprehensive research design framework ensures the delivery of accurate, reliable, and actionable market intelligence. Through the integration of multiple research approaches, rigorous validation processes, and expert analysis, we provide our clients with the insights needed to make informed strategic decisions and capitalize on market opportunities.

MarketGenics leverages a dedicated industry panel of experts and a comprehensive suite of paid databases to effectively collect, consolidate, and analyze market intelligence.
Our approach has consistently proven to be reliable and effective in generating accurate market insights, identifying key industry trends, and uncovering emerging business opportunities.
Through both primary and secondary research, we capture and analyze critical company-level data such as manufacturing footprints, including technical centers, R&D facilities, sales offices, and headquarters.
Our expert panel further enhances our ability to estimate market size for specific brands based on validated field-level intelligence.
Our data mining techniques incorporate both parametric and non-parametric methods, allowing for structured data collection, sorting, processing, and cleaning.
Demand projections are derived from large-scale data sets analyzed through proprietary algorithms, culminating in robust and reliable market sizing.
Research Approach
The bottom-up approach builds market estimates by starting with the smallest addressable market units and systematically aggregating them to create comprehensive market size projections.
This method begins with specific, granular data points and builds upward to create the complete market landscape.
Customer Analysis → Segmental Analysis → Geographical Analysis
The top-down approach starts with the broadest possible market data and systematically narrows it down through a series of filters and assumptions to arrive at specific market segments or opportunities.
This method begins with the big picture and works downward to increasingly specific market slices.
TAM → SAM → SOM


Research Methods
Desk / Secondary Research
While analysing the market, we extensively study secondary sources, directories, and databases to identify and collect information useful for this technical, market-oriented, and commercial report. Secondary sources that we utilize are not only the public sources, but it is a combination of Open Source, Associations, Paid Databases, MG Repository & Knowledgebase, and others.
- Company websites, annual reports, financial reports, broker reports, and investor presentations
- National government documents, statistical databases and reports
- News articles, press releases and web-casts specific to the companies operating in the market, Magazines, reports, and others
- We gather information from commercial data sources for deriving company specific data such as segmental revenue, share for geography, product revenue, and others
- Internal and external proprietary databases (industry-specific), relevant patent, and regulatory databases
- Governing Bodies, Government Organizations
- Relevant Authorities, Country-specific Associations for Industries
We also employ the model mapping approach to estimate the product level market data through the players' product portfolio
Primary Research
Primary research/ interviews is vital in analyzing the market. Most of the cases involves paid primary interviews. Primary sources include primary interviews through e-mail interactions, telephonic interviews, surveys as well as face-to-face interviews with the different stakeholders across the value chain including several industry experts.
| Type of Respondents | Number of Primaries |
|---|---|
| Tier 2/3 Suppliers | ~20 |
| Tier 1 Suppliers | ~25 |
| End-users | ~25 |
| Industry Expert/ Panel/ Consultant | ~30 |
| Total | ~100 |
MG Knowledgebase
• Repository of industry blog, newsletter and case studies
• Online platform covering detailed market reports, and company profiles
Forecasting Factors and Models
Forecasting Factors
- Historical Trends – Past market patterns, cycles, and major events that shaped how markets behave over time. Understanding past trends helps predict future behavior.
- Industry Factors – Specific characteristics of the industry like structure, regulations, and innovation cycles that affect market dynamics.
- Macroeconomic Factors – Economic conditions like GDP growth, inflation, and employment rates that affect how much money people have to spend.
- Demographic Factors – Population characteristics like age, income, and location that determine who can buy your product.
- Technology Factors – How quickly people adopt new technology and how much technology infrastructure exists.
- Regulatory Factors – Government rules, laws, and policies that can help or restrict market growth.
- Competitive Factors – Analyzing competition structure such as degree of competition and bargaining power of buyers and suppliers.
Forecasting Models / Techniques
Multiple Regression Analysis
- Identify and quantify factors that drive market changes
- Statistical modeling to establish relationships between market drivers and outcomes
Time Series Analysis – Seasonal Patterns
- Understand regular cyclical patterns in market demand
- Advanced statistical techniques to separate trend, seasonal, and irregular components
Time Series Analysis – Trend Analysis
- Identify underlying market growth patterns and momentum
- Statistical analysis of historical data to project future trends
Expert Opinion – Expert Interviews
- Gather deep industry insights and contextual understanding
- In-depth interviews with key industry stakeholders
Multi-Scenario Development
- Prepare for uncertainty by modeling different possible futures
- Creating optimistic, pessimistic, and most likely scenarios
Time Series Analysis – Moving Averages
- Sophisticated forecasting for complex time series data
- Auto-regressive integrated moving average models with seasonal components
Econometric Models
- Apply economic theory to market forecasting
- Sophisticated economic models that account for market interactions
Expert Opinion – Delphi Method
- Harness collective wisdom of industry experts
- Structured, multi-round expert consultation process
Monte Carlo Simulation
- Quantify uncertainty and probability distributions
- Thousands of simulations with varying input parameters
Research Analysis
Our research framework is built upon the fundamental principle of validating market intelligence from both demand and supply perspectives. This dual-sided approach ensures comprehensive market understanding and reduces the risk of single-source bias.
Demand-Side Analysis: We understand end-user/application behavior, preferences, and market needs along with the penetration of the product for specific application.
Supply-Side Analysis: We estimate overall market revenue, analyze the segmental share along with industry capacity, competitive landscape, and market structure.
Validation & Evaluation
Data triangulation is a validation technique that uses multiple methods, sources, or perspectives to examine the same research question, thereby increasing the credibility and reliability of research findings. In market research, triangulation serves as a quality assurance mechanism that helps identify and minimize bias, validate assumptions, and ensure accuracy in market estimates.
- Data Source Triangulation – Using multiple data sources to examine the same phenomenon
- Methodological Triangulation – Using multiple research methods to study the same research question
- Investigator Triangulation – Using multiple researchers or analysts to examine the same data
- Theoretical Triangulation – Using multiple theoretical perspectives to interpret the same data

Custom Market Research Services
We will customise the research for you, in case the report listed above does not meet your requirements.
Get 10% Free Customisation