Intimate Care pH-Balanced Products Market Size, Share & Trends Analysis Report by Product Type (Intimate Washes, Intimate Wipes, Intimate Moisturizers, Intimate Deodorants, Intimate Masks, Intimate Oils, Others), pH Level Range, Formulation, Ingredient Base, Consumer Demographics, Packaging Type, Distribution Channel, End-users, and Geography (North America, Europe, Asia Pacific, Middle East, Africa, and South America) – Global Industry Data, Trends, and Forecasts, 2026–2035
|
|
|
Segmental Data Insights |
|
|
Demand Trends |
|
|
Competitive Landscape |
|
|
Strategic Development |
|
|
Future Outlook & Opportunities |
|
Intimate Care-pH Balanced Products Market Size, Share, and Growth
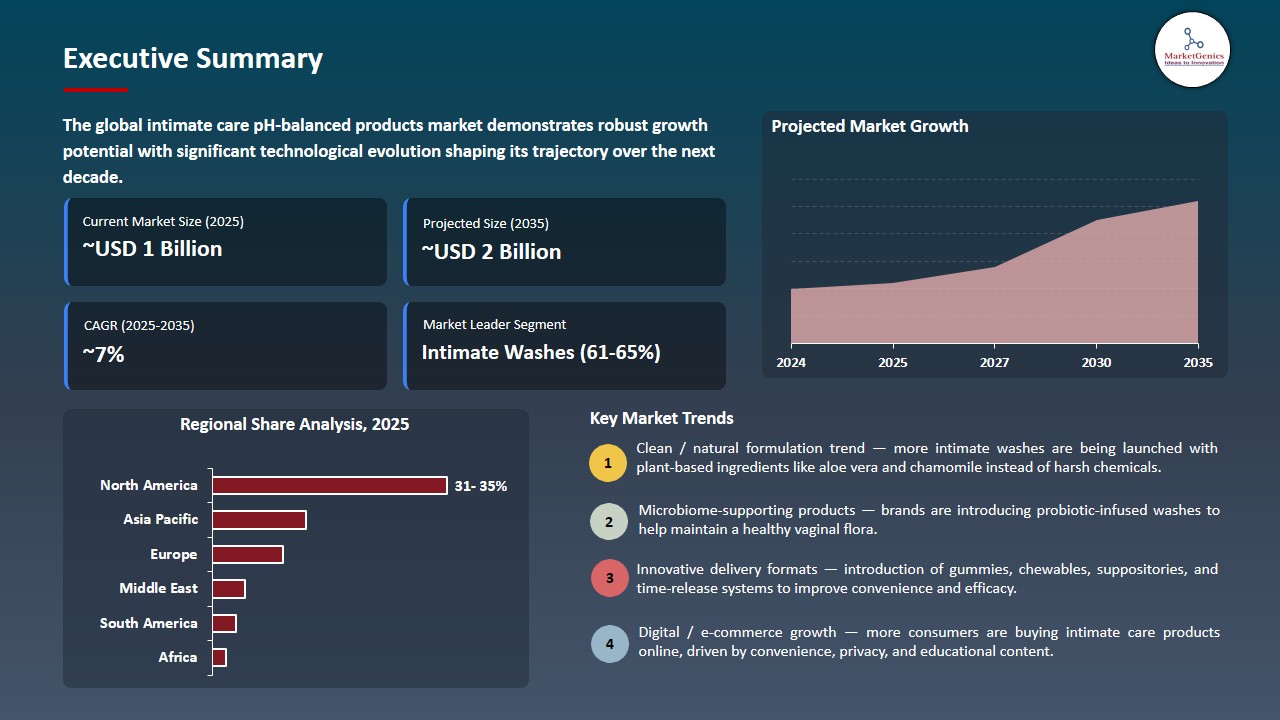
The global intimate care ph-balanced products market is experiencing robust growth, with its estimated value of USD 1.2 billion in the year 2025 and USD 2.5 billion by the period 2035, registering a CAGR of 7.4%, during the forecast period. The growing consumer interest in intimate wellness, skin sensitivity and general hygiene has continued to increase the global intimate care ph-balanced products market. Customers are now demanding products that are mild, moisturizing, safe on sensitive skin and that are dermatologically tested hence the demand on high quality, clinically proven formulations.
Brianna Bitton, co-founder of O Positiv, said, we created URO pH-Balanced Wash because women deserve more than outdated routines and one-size-fits-all products. Most body washes aren't made for your vulva, and are often doing more harm than good. This wash is refreshing, gentle, smells incredible, and is formulated to meet women where they are just like every product we make.
The global intimate care pH-balanced products market is seeing a strong growth due to changing consumer demands, scientific development, and the growing concern with holistic health and sustainability. The desire of consumers to purchase products that are safe, suggested by dermatologists, microbiome-friendly, and ethically produced indicates a return to wellness-driven buying patterns and eco-friendly buying patterns.
The market leaders are reacting by re-designing products that cater to sensitive and diverse skin types, the use of biodegradable and recycled packages and the digital platform that enables personal interaction. Clinical validation, influence marketing, and educational campaigns are investments that add credibility and generate trust in the consumer and can thus be used to differentiate in highly competitive markets. For instance, in 2023, Victoria Secret introduced its intimate care wipes and increased its range of products to accommodate changing consumer habits of convenient and safe intimate hygiene products with microbiome-friendly and gentle formulations.
The adjacent opportunities are subscriptions, product recommendations that are telehealth-enabled, and incorporating them into other wellness specialties, including probiotics and microbiome-supportive formulations. The strategies enable companies to branch out revenue, enhance customer lifetime worth, and develop entire ecosystems to focus on intimate care, personal wellness and lifestyle demands.
Intimate Care-pH Balanced Products Dynamics and Trends
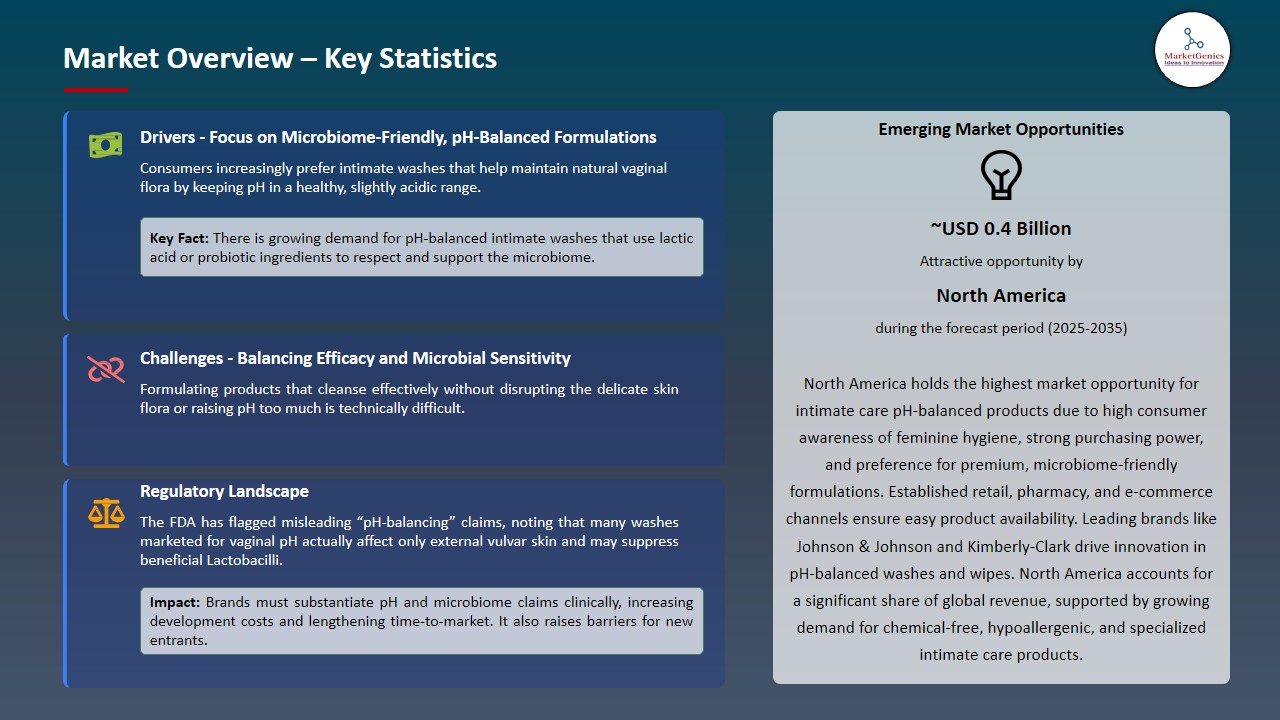
Driver: Growing Awareness of Intimate Health and Microbiome Science
-
The intimate care ph balanced products market is changing with the growing consumer awareness of intimate health, microbiome balance, and the use of mild pH-balanced hygiene. The younger demographics especially millennials and GenZ consumers are turning out to be more demanding in terms of authenticity, transparency, and alignment with personal wellness ideas when choosing intimate care products.
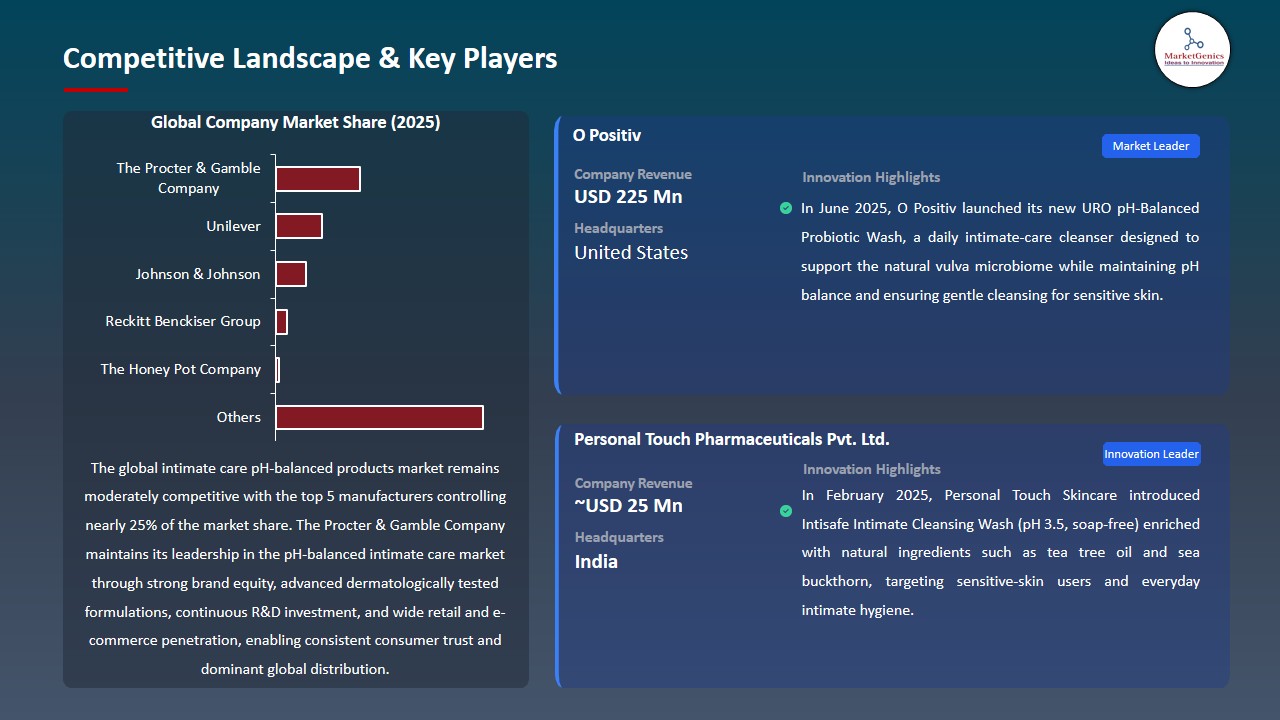
- Manufacturers are retaliating through product reformulations, third-party certifications and open sourcing. For instance, in February 2025, Personal Touch Skincare the company released its Intisafe Intimate Cleansing Wash, a pH 3.5, soap-free wash made of natural ingredients such as tea tree oil, quinoa protein and sea buckthorn that help to sustain the natural vaginal pH, maintain the health of the microbiome, and prevent irritation.
- The popularity of microbiome-friendly intimate care has led to increased demand for safe, effective, and wellness-oriented hygiene products. This has led to a desire to extend the target market and redesign products accordingly.
Restraint: Cultural Taboos and Marketing Restrictions
-
The development and market share penetration of intimate care products of pH-balance is the cultural taboos and regulatory constraints. Reduction in awareness, economic limitations, and marketing inhibitors will all interfere with expansion and place obstacles on companies that look to expand their operations across multinational regions and become profitable.
- To overcome these issues, organizations use the strategies of educational campaigns, influencer organizations, clinical validation, pricing optimisation and diverse distribution channels. It takes long-term investment, cultural awareness, and strategic adjustment to the regional consumer preference and competition.
- The economic impact of these limitations varies by segment. Premium products are more resilient due to high brand loyalty and value difference, whereas mass market categories are under pressure, necessitating operational efficiency, marketing innovation, and an emphasis on engineering value to retain a competitive stance.
Opportunity: Expansion in Men's Intimate Care Segment
-
The men intimate care segment provides a huge growth opportunity to the pH-balanced intimate care products suppliers that provide differentiated consumer-centric solutions. Proactive businesses are investing in product development, distribution network development, strategic alliance development and capability development to take advantage of the new market trends to capture the increasing consumer expectations.
- Some of the growth opportunities are: geographical expansion to new markets, venture into other related grooming segments, high end products development, and direct-to-consumer strategies that help in making experiences personalized. It takes profound consumer insights, digital savvy, swift implementation and continuous innovation to succeed. For instance, in September 2024 , Menkair introduced a men-specific line of intimate hygiene products, such as washes, sprays, and creams with clean formulas compatible with the sensitive skin and daily routine, to encourage more men to adopt intimate care aimed at men.
- Strategic branding, compelling distribution and product differentiation can also be used to promote growth of above the market and enhance competitive positioning.
Key Trend: Integration of Probiotic and Prebiotic Formulations
-
A shift is being observed in intimate care pH based products market with a tendency toward probiotic and prebiotic based products due to consumer demand of a more proactive support of microbiome health and long term intimate wellness. This trend demonstrates the place of scientific innovation, scientific proof of its effectiveness, and an increase in consumer awareness of preventive care and solutions friendly to the skin. The first-movers are enjoying competitive advantage in terms of increased product differentiation, brand credibility and improved positioning in the high-end markets.
- The benefits of companies that integrate probiotics and prebiotics are showing themselves in the form of the improved performance of the products, the increased satisfaction by the consumers, and the increased brand loyalty. For instance, in June 2025, O Positiv will launch its URO Probiotic Wash, a daily pH -balanced wash that helps maintain the natural microbiome of the vulva and cleans the skin effectively. Markets that have high-level consumers and strong inclination to functional, health oriented products are proving to be picking them up at a faster rate than others, which motivate the investment in R&D, clinical validation, and specific consumer education.
- Microbiome-friendly formulations are becoming more common, allowing for individualized solutions and subscription programs that enhance consumer contact and drive long-term growth.
Intimate-Care-pH-Balanced-Products-Market Analysis and Segmental Data
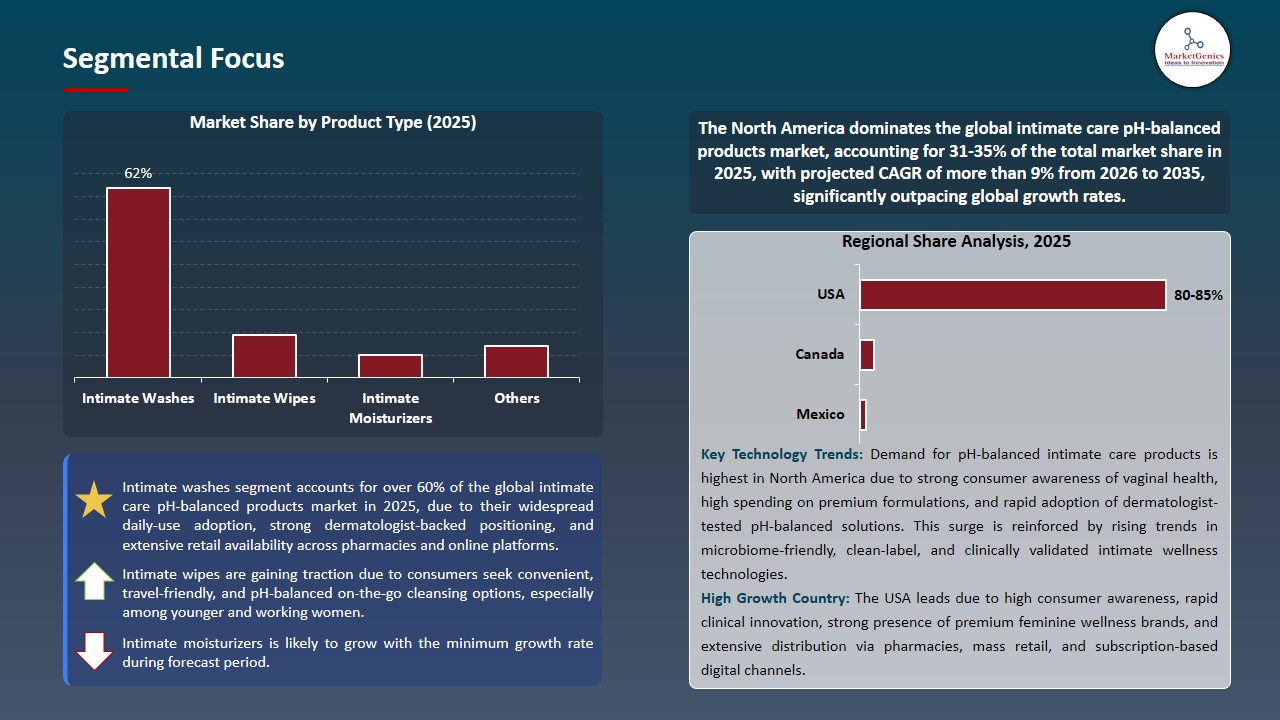
Intimate Washes Dominate Global Intimate Care pH-Balanced Products Market
-
The intimate washes segment dominate the global intimate care products market in the pH-balanced category, as the inclination of the consumers towards the gel-based formulations, chemical-free compositions and unisex products increases. Its market supremacy is also enforced in markets where differentiation of products, dermatological and positioning of natural ingredients lead to brand loyalty and high repeating buyer habits.
- Recent introductions were devoted to sensitive-skin appropriateness, moisturizing qualities, and plant-based products to address the emerging consumer demands in relation to wellness. For instance, in October 2025, Natural Nine has declared the introduction of its Leoclean feminine cleanser, which was designed to keep the skin at neutral pH, reduce any potential skin irritation, and utilize natural products to treat sensitive skin and the Y-zone.
- The segment's competitive advantage stems from its strong supply network, regulatory expertise, and consumer knowledge, enabling growth through geographical expansion, line extensions, and high-end variants.
North America Leads Global Intimate Care pH-Balanced Products Market Demand
-
North America leads intimate care PH-balanced products market with good integration of dermatological science, high consumer concern on ingredient safety, and early utilization of condition specific intimate solutions. Higher regulatory systems compromise safety with expedited product approvals and allow firms to expedite time-to-market with clinically tested formulations.
- The competitive advantage of the region is strengthened by the fact that it has a highly developed omnichannel system, with direct-to-consumer systems, pharmacy chains, specialty beauty stores, and subscription business models running simultaneously. For instance, in November 2024, The Honey Pot Company rolled out its Witch Hazel Intimate Wash and Wipes in major retail outlets in the U.S., following an increasing demand among consumers to use plant-based products, pH-balanced and dermatologist-informed intimate care products. Trial adoption and premiumization have been driven to high levels through high involvement in digital wellness contents, gynecologist-approved education, and campaigns led by an influencer.
- North America is a crucial commercialization region for next-generation intimate hygiene products that prioritize eco-friendliness, clinical validity, and premium formulations.
Intimate-Care-pH-Balanced-Products-Market Ecosystem
The global intimate care ph-balanced products market is moderately fragmented, with multinational corporations, specialty wellness brands, and digital-native start-ups operating on both a mass and a high-end level. The Procter & Gamble Company, Unilever, Johnson and Johnson, and Reckitt Benckiser Group are tier-1 companies that dominate mass-market segments by virtue of scale efficiencies, high brand equity, abundance of R&D and global retail distribution.
Simultaneously, The Honey Pot Company and other specialty brands are also strong players in the high-end segment when it comes to clean-label positioning, natural formulations, and community-based brand experience. There are suppliers of raw materials, formulation developers, contract manufacturing, packaging, and logistics partners, digital and omnichannel retailers in the market value chain.
The major brands are enhancing vertical integration, building direct-to-consumer models and investing in digital marketing and personalization based on data. These plans will yield greater control over the margin, faster product development, and more profound relations with consumers, preparing the ecosystem to be competitive in the long-term.
Recent Development and Strategic Overview
-
In June 2024, Waphyto released a limited-edition Fresh Mint intimate-care wash, the Intimate Foaming Wash Fresh Mint, based on Japanese peppermint and plant extracts to cool, clean and balance pH of sensitive intimate skin in warm, humid seasons.
- In April 2025, Niches & Nooks launched a new intimate-care line of pH-balanced products with microbiome-friendly scents, including a gentle cleanser, refreshing wipes, chafing-barrier spray and fragrance mist, all designed to cleanse and care for intimate areas safely and gently.
Report Scope
|
Detail |
|
|
Market Size in 2025 |
USD 1.2 Bn |
|
Market Forecast Value in 2035 |
USD 2.5 Bn |
|
Growth Rate (CAGR) |
7.4% |
|
Forecast Period |
2026 – 2035 |
|
Historical Data Available for |
2021 – 2024 |
|
Market Size Units |
US$ Billion for Value |
|
Report Format |
Electronic (PDF) + Excel |
|
North America |
Europe |
Asia Pacific |
Middle East |
Africa |
South America |
|
|
|
|
|
|
|
Companies Covered |
|||||
|
|
|
|
|
|
Intimate-Care-pH-Balanced-Products-Market Segmentation and Highlights
|
Segment |
Sub-segment |
|
Intimate Care pH-Balanced Products Market, By Product Type |
|
|
Intimate Care pH-Balanced Products Market, By pH Level Range |
|
|
Intimate Care pH-Balanced Products Market, By Formulation |
|
|
Intimate Care pH-Balanced Products Market, By Ingredient Base |
|
|
Intimate Care pH-Balanced Products Market, By Consumer Demographics |
|
|
Intimate Care pH-Balanced Products Market, By Packaging Type |
|
|
Intimate Care pH-Balanced Products Market, By Distribution Channel |
|
|
Intimate Care pH-Balanced Products Market, By End-users |
|
Frequently Asked Questions
Table of Contents
- 1. Research Methodology and Assumptions
- 1.1. Definitions
- 1.2. Research Design and Approach
- 1.3. Data Collection Methods
- 1.4. Base Estimates and Calculations
- 1.5. Forecasting Models
- 1.5.1. Key Forecast Factors & Impact Analysis
- 1.6. Secondary Research
- 1.6.1. Open Sources
- 1.6.2. Paid Databases
- 1.6.3. Associations
- 1.7. Primary Research
- 1.7.1. Primary Sources
- 1.7.2. Primary Interviews with Stakeholders across Ecosystem
- 2. Executive Summary
- 2.1. Global Intimate Care pH-Balanced Products Market Outlook
- 2.1.1. Intimate Care pH-Balanced Products Market Size (Value - US$ Bn), and Forecasts, 2021-2035
- 2.1.2. Compounded Annual Growth Rate Analysis
- 2.1.3. Growth Opportunity Analysis
- 2.1.4. Segmental Share Analysis
- 2.1.5. Geographical Share Analysis
- 2.2. Market Analysis and Facts
- 2.3. Supply-Demand Analysis
- 2.4. Competitive Benchmarking
- 2.5. Go-to- Market Strategy
- 2.5.1. Customer/ End-use Industry Assessment
- 2.5.2. Growth Opportunity Data, 2026-2035
- 2.5.2.1. Regional Data
- 2.5.2.2. Country Data
- 2.5.2.3. Segmental Data
- 2.5.3. Identification of Potential Market Spaces
- 2.5.4. GAP Analysis
- 2.5.5. Potential Attractive Price Points
- 2.5.6. Prevailing Market Risks & Challenges
- 2.5.7. Preferred Sales & Marketing Strategies
- 2.5.8. Key Recommendations and Analysis
- 2.5.9. A Way Forward
- 2.1. Global Intimate Care pH-Balanced Products Market Outlook
- 3. Industry Data and Premium Insights
- 3.1. Global Consumer Goods & Services Industry Overview, 2025
- 3.1.1. Consumer Goods & Services Industry Ecosystem Analysis
- 3.1.2. Key Trends for Consumer Goods & Services Industry
- 3.1.3. Regional Distribution for Consumer Goods & Services Industry
- 3.2. Supplier Customer Data
- 3.3. Technology Roadmap and Developments
- 3.4. Trade Analysis
- 3.4.1. Import & Export Analysis, 2025
- 3.4.2. Top Importing Countries
- 3.4.3. Top Exporting Countries
- 3.5. Trump Tariff Impact Analysis
- 3.5.1. Manufacturer
- 3.5.1.1. Based on the component & Raw material
- 3.5.2. Supply Chain
- 3.5.3. End Consumer
- 3.5.1. Manufacturer
- 3.6. Raw Material Analysis
- 3.1. Global Consumer Goods & Services Industry Overview, 2025
- 4. Market Overview
- 4.1. Market Dynamics
- 4.1.1. Drivers
- 4.1.1.1. Increasing awareness of intimate hygiene and women’s health.
- 4.1.1.2. Rising demand for natural, organic, and pH‑balanced formulations.
- 4.1.1.3. Prevention of infections via maintenance of natural pH / microflora.
- 4.1.2. Restraints
- 4.1.2.1. Cultural stigma and social taboos around intimate care.
- 4.1.2.2. Regulatory challenges and safety concerns (e.g., ingredient safety, irritation risk).
- 4.1.1. Drivers
- 4.2. Key Trend Analysis
- 4.3. Regulatory Framework
- 4.3.1. Key Regulations, Norms, and Subsidies, by Key Countries
- 4.3.2. Tariffs and Standards
- 4.3.3. Impact Analysis of Regulations on the Market
- 4.4. Value Chain Analysis
- 4.4.1. Raw Material Suppliers
- 4.4.2. Manufacturers
- 4.4.3. Dealers/ Distributors
- 4.4.4. End-Users/ Customers
- 4.5. Porter’s Five Forces Analysis
- 4.6. PESTEL Analysis
- 4.7. Global Intimate Care pH-Balanced Products Market Demand
- 4.7.1. Historical Market Size – Value (US$ Bn), 2020-2024
- 4.7.2. Current and Future Market Size – Value (US$ Bn), 2026–2035
- 4.7.2.1. Y-o-Y Growth Trends
- 4.7.2.2. Absolute $ Opportunity Assessment
- 4.1. Market Dynamics
- 5. Competition Landscape
- 5.1. Competition structure
- 5.1.1. Fragmented v/s consolidated
- 5.2. Company Share Analysis, 2025
- 5.2.1. Global Company Market Share
- 5.2.2. By Region
- 5.2.2.1. North America
- 5.2.2.2. Europe
- 5.2.2.3. Asia Pacific
- 5.2.2.4. Middle East
- 5.2.2.5. Africa
- 5.2.2.6. South America
- 5.3. Product Comparison Matrix
- 5.3.1. Specifications
- 5.3.2. Market Positioning
- 5.3.3. Pricing
- 5.1. Competition structure
- 6. Global Intimate Care pH-Balanced Products Market Analysis, by Product Type
- 6.1. Key Segment Analysis
- 6.2. Intimate Care pH-Balanced Products Market Size (Value - US$ Bn), Analysis, and Forecasts, by Product Type, 2021-2035
- 6.2.1. Intimate Washes
- 6.2.1.1. Liquid Wash
- 6.2.1.2. Foam Wash
- 6.2.1.3. Gel Wash
- 6.2.2. Intimate Wipes
- 6.2.2.1. Flushable Wipes
- 6.2.2.2. Non-Flushable Wipes
- 6.2.3. Intimate Moisturizers
- 6.2.3.1. Creams
- 6.2.3.2. Gels
- 6.2.3.3. Serums
- 6.2.4. Intimate Deodorants
- 6.2.4.1. Spray
- 6.2.4.2. Roll-On
- 6.2.4.3. Powder
- 6.2.4.4. Cleansing Bars
- 6.2.5. Intimate Masks
- 6.2.6. Intimate Oils
- 6.2.7. Others
- 6.2.1. Intimate Washes
- 7. Global Intimate Care pH-Balanced Products Market Analysis, by pH Level Range
- 7.1. Key Segment Analysis
- 7.2. Intimate Care pH-Balanced Products Market Size (Value - US$ Bn), Analysis, and Forecasts, by pH Level Range, 2021-2035
- 7.2.1. pH 3.5 - 4.0
- 7.2.2. pH 4.0 - 4.5
- 7.2.3. pH 4.5 - 5.0
- 7.2.4. pH 5.0 - 5.5
- 8. Global Intimate Care pH-Balanced Products Market Analysis, by Formulation
- 8.1. Key Segment Analysis
- 8.2. Intimate Care pH-Balanced Products Market Size (Value - US$ Bn), Analysis, and Forecasts, by Formulation, 2021-2035
- 8.2.1. Organic/Natural
- 8.2.2. Synthetic
- 8.2.3. Hybrid (Natural-Synthetic Blend)
- 9. Global Intimate Care pH-Balanced Products Market Analysis, by Ingredient Base
- 9.1. Key Segment Analysis
- 9.2. Intimate Care pH-Balanced Products Market Size (Value - US$ Bn), Analysis, and Forecasts, by Ingredient Base, 2021-2035
- 9.2.1. Aloe Vera Based
- 9.2.2. Lactic Acid Based
- 9.2.3. Tea Tree Oil Based
- 9.2.4. Chamomile Based
- 9.2.5. Calendula Based
- 9.2.6. Hyaluronic Acid Based
- 9.2.7. Glycerin Based
- 9.2.8. Multi-Ingredient Complex
- 10. Global Intimate Care pH-Balanced Products Market Analysis, by Consumer Demographics
- 10.1. Key Segment Analysis
- 10.2. Intimate Care pH-Balanced Products Market Size (Value - US$ Bn), Analysis, and Forecasts, by Consumer Demographics, 2021-2035
- 10.2.1. Gender
- 10.2.1.1. Male
- 10.2.1.2. Female
- 10.2.2. Age Group
- 10.2.2.1. Teenagers (13-19 years)
- 10.2.2.2. Young Adults (20-35 years)
- 10.2.2.3. Middle-Aged Adults (36-50 years)
- 10.2.2.4. Seniors (50+ years)
- 10.2.1. Gender
- 11. Global Intimate Care pH-Balanced Products Market Analysis, by Packaging Type
- 11.1. Key Segment Analysis
- 11.2. Intimate Care pH-Balanced Products Market Size (Value - US$ Bn), Analysis, and Forecasts, by Packaging Type, 2021-2035
- 11.2.1. Bottles
- 11.2.1.1. Pump Bottles
- 11.2.1.2. Squeeze Bottles
- 11.2.1.3. Flip-Top Bottles
- 11.2.2. Tubes
- 11.2.3. Sachets/Single-Use Packets
- 11.2.4. Pouches
- 11.2.5. Containers/Jars
- 11.2.6. Travel-Size Packaging
- 11.2.7. Refillable Packaging
- 11.2.1. Bottles
- 12. Global Intimate Care pH-Balanced Products Market Analysis, by Distribution Channel
- 12.1. Key Segment Analysis
- 12.2. Intimate Care pH-Balanced Products Market Size (Value - US$ Bn), Analysis, and Forecasts, by Distribution Channel, 2021-2035
- 12.2.1. Online
- 12.2.1.1. E-commerce Platforms
- 12.2.1.2. Brand Websites
- 12.2.1.3. Online Pharmacies
- 12.2.1.4. Others
- 12.2.2. Offline
- 12.2.2.1. Supermarkets/Hypermarkets
- 12.2.2.2. Pharmacies/Drugstores
- 12.2.2.3. Specialty Stores
- 12.2.2.4. Beauty & Personal Care Stores
- 12.2.2.5. Departmental Stores
- 12.2.2.6. Convenience Stores
- 12.2.2.7. Others
- 12.2.1. Online
- 13. Global Intimate Care pH-Balanced Products Market Analysis, by End-users
- 13.1. Key Segment Analysis
- 13.2. Intimate Care pH-Balanced Products Market Size (Value - US$ Bn), Analysis, and Forecasts, by End-users, 2021-2035
- 13.2.1. Personal Care & Hygiene
- 13.2.1.1. Daily Intimate Hygiene
- 13.2.1.2. Menstrual Hygiene Management
- 13.2.1.3. Post-Workout Freshness
- 13.2.1.4. Post-Intercourse Cleansing
- 13.2.1.5. Odor Control
- 13.2.1.6. Infection Prevention
- 13.2.1.7. Others
- 13.2.2. Healthcare & Medical
- 13.2.2.1. Post-Surgical Care
- 13.2.2.2. Postpartum Care
- 13.2.2.3. Menopause Management
- 13.2.2.4. Vaginal Dryness Treatment
- 13.2.2.5. pH Balance Restoration
- 13.2.2.6. Infection Treatment Support
- 13.2.2.7. Others
- 13.2.3. Wellness & Spa
- 13.2.3.1. Spa Treatment Protocols
- 13.2.3.2. Wellness Regimens
- 13.2.3.3. Professional Intimate Care Services
- 13.2.3.4. Pre/Post-Treatment Care
- 13.2.3.5. Others
- 13.2.4. Hospitality
- 13.2.4.1. Hotel Amenities
- 13.2.4.2. Resort Spa Services
- 13.2.4.3. Guest Personal Care Kits
- 13.2.4.4. Others
- 13.2.5. Sports & Fitness
- 13.2.5.1. Gym/Fitness Center Facilities
- 13.2.5.2. Athletic Performance Support
- 13.2.5.3. Post-Exercise Hygiene
- 13.2.5.4. Locker Room Supplies
- 13.2.5.5. Others
- 13.2.1. Personal Care & Hygiene
- 14. Global Intimate Care pH-Balanced Products Market Analysis and Forecasts, by Region
- 14.1. Key Findings
- 14.2. Intimate Care pH-Balanced Products Market Size (Value - US$ Bn), Analysis, and Forecasts, by Region, 2021-2035
- 14.2.1. North America
- 14.2.2. Europe
- 14.2.3. Asia Pacific
- 14.2.4. Middle East
- 14.2.5. Africa
- 14.2.6. South America
- 15. North America Intimate Care pH-Balanced Products Market Analysis
- 15.1. Key Segment Analysis
- 15.2. Regional Snapshot
- 15.3. North America Intimate Care pH-Balanced Products Market Size (Value - US$ Bn), Analysis, and Forecasts, 2021-2035
- 15.3.1. Product Type
- 15.3.2. pH Level Range
- 15.3.3. Formulation
- 15.3.4. Ingredient Base
- 15.3.5. Consumer Demographics
- 15.3.6. Packaging Type
- 15.3.7. Distribution Channel
- 15.3.8. End-users
- 15.3.9. Country
- 15.3.9.1. USA
- 15.3.9.2. Canada
- 15.3.9.3. Mexico
- 15.4. USA Intimate Care pH-Balanced Products Market
- 15.4.1. Country Segmental Analysis
- 15.4.2. Product Type
- 15.4.3. pH Level Range
- 15.4.4. Formulation
- 15.4.5. Ingredient Base
- 15.4.6. Consumer Demographics
- 15.4.7. Packaging Type
- 15.4.8. Distribution Channel
- 15.4.9. End-users
- 15.5. Canada Intimate Care pH-Balanced Products Market
- 15.5.1. Country Segmental Analysis
- 15.5.2. Product Type
- 15.5.3. pH Level Range
- 15.5.4. Formulation
- 15.5.5. Ingredient Base
- 15.5.6. Consumer Demographics
- 15.5.7. Packaging Type
- 15.5.8. Distribution Channel
- 15.5.9. End-users
- 15.6. Mexico Intimate Care pH-Balanced Products Market
- 15.6.1. Country Segmental Analysis
- 15.6.2. Product Type
- 15.6.3. pH Level Range
- 15.6.4. Formulation
- 15.6.5. Ingredient Base
- 15.6.6. Consumer Demographics
- 15.6.7. Packaging Type
- 15.6.8. Distribution Channel
- 15.6.9. End-users
- 16. Europe Intimate Care pH-Balanced Products Market Analysis
- 16.1. Key Segment Analysis
- 16.2. Regional Snapshot
- 16.3. Europe Intimate Care pH-Balanced Products Market Size (Value - US$ Bn), Analysis, and Forecasts, 2021-2035
- 16.3.1. Product Type
- 16.3.2. pH Level Range
- 16.3.3. Formulation
- 16.3.4. Ingredient Base
- 16.3.5. Consumer Demographics
- 16.3.6. Packaging Type
- 16.3.7. Distribution Channel
- 16.3.8. End-users
- 16.3.9. Country
- 16.3.9.1. Germany
- 16.3.9.2. United Kingdom
- 16.3.9.3. France
- 16.3.9.4. Italy
- 16.3.9.5. Spain
- 16.3.9.6. Netherlands
- 16.3.9.7. Nordic Countries
- 16.3.9.8. Poland
- 16.3.9.9. Russia & CIS
- 16.3.9.10. Rest of Europe
- 16.4. Germany Intimate Care pH-Balanced Products Market
- 16.4.1. Country Segmental Analysis
- 16.4.2. Product Type
- 16.4.3. pH Level Range
- 16.4.4. Formulation
- 16.4.5. Ingredient Base
- 16.4.6. Consumer Demographics
- 16.4.7. Packaging Type
- 16.4.8. Distribution Channel
- 16.4.9. End-users
- 16.5. United Kingdom Intimate Care pH-Balanced Products Market
- 16.5.1. Country Segmental Analysis
- 16.5.2. Product Type
- 16.5.3. pH Level Range
- 16.5.4. Formulation
- 16.5.5. Ingredient Base
- 16.5.6. Consumer Demographics
- 16.5.7. Packaging Type
- 16.5.8. Distribution Channel
- 16.5.9. End-users
- 16.6. France Intimate Care pH-Balanced Products Market
- 16.6.1. Country Segmental Analysis
- 16.6.2. Product Type
- 16.6.3. pH Level Range
- 16.6.4. Formulation
- 16.6.5. Ingredient Base
- 16.6.6. Consumer Demographics
- 16.6.7. Packaging Type
- 16.6.8. Distribution Channel
- 16.6.9. End-users
- 16.7. Italy Intimate Care pH-Balanced Products Market
- 16.7.1. Country Segmental Analysis
- 16.7.2. Product Type
- 16.7.3. pH Level Range
- 16.7.4. Formulation
- 16.7.5. Ingredient Base
- 16.7.6. Consumer Demographics
- 16.7.7. Packaging Type
- 16.7.8. Distribution Channel
- 16.7.9. End-users
- 16.8. Spain Intimate Care pH-Balanced Products Market
- 16.8.1. Country Segmental Analysis
- 16.8.2. Product Type
- 16.8.3. pH Level Range
- 16.8.4. Formulation
- 16.8.5. Ingredient Base
- 16.8.6. Consumer Demographics
- 16.8.7. Packaging Type
- 16.8.8. Distribution Channel
- 16.8.9. End-users
- 16.9. Netherlands Intimate Care pH-Balanced Products Market
- 16.9.1. Country Segmental Analysis
- 16.9.2. Product Type
- 16.9.3. pH Level Range
- 16.9.4. Formulation
- 16.9.5. Ingredient Base
- 16.9.6. Consumer Demographics
- 16.9.7. Packaging Type
- 16.9.8. Distribution Channel
- 16.9.9. End-users
- 16.10. Nordic Countries Intimate Care pH-Balanced Products Market
- 16.10.1. Country Segmental Analysis
- 16.10.2. Product Type
- 16.10.3. pH Level Range
- 16.10.4. Formulation
- 16.10.5. Ingredient Base
- 16.10.6. Consumer Demographics
- 16.10.7. Packaging Type
- 16.10.8. Distribution Channel
- 16.10.9. End-users
- 16.11. Poland Intimate Care pH-Balanced Products Market
- 16.11.1. Country Segmental Analysis
- 16.11.2. Product Type
- 16.11.3. pH Level Range
- 16.11.4. Formulation
- 16.11.5. Ingredient Base
- 16.11.6. Consumer Demographics
- 16.11.7. Packaging Type
- 16.11.8. Distribution Channel
- 16.11.9. End-users
- 16.12. Russia & CIS Intimate Care pH-Balanced Products Market
- 16.12.1. Country Segmental Analysis
- 16.12.2. Product Type
- 16.12.3. pH Level Range
- 16.12.4. Formulation
- 16.12.5. Ingredient Base
- 16.12.6. Consumer Demographics
- 16.12.7. Packaging Type
- 16.12.8. Distribution Channel
- 16.12.9. End-users
- 16.13. Rest of Europe Intimate Care pH-Balanced Products Market
- 16.13.1. Country Segmental Analysis
- 16.13.2. Product Type
- 16.13.3. pH Level Range
- 16.13.4. Formulation
- 16.13.5. Ingredient Base
- 16.13.6. Consumer Demographics
- 16.13.7. Packaging Type
- 16.13.8. Distribution Channel
- 16.13.9. End-users
- 17. Asia Pacific Intimate Care pH-Balanced Products Market Analysis
- 17.1. Key Segment Analysis
- 17.2. Regional Snapshot
- 17.3. Asia Pacific Intimate Care pH-Balanced Products Market Size (Value - US$ Bn), Analysis, and Forecasts, 2021-2035
- 17.3.1. Product Type
- 17.3.2. pH Level Range
- 17.3.3. Formulation
- 17.3.4. Ingredient Base
- 17.3.5. Consumer Demographics
- 17.3.6. Packaging Type
- 17.3.7. Distribution Channel
- 17.3.8. End-users
- 17.3.9. Country
- 17.3.9.1. China
- 17.3.9.2. India
- 17.3.9.3. Japan
- 17.3.9.4. South Korea
- 17.3.9.5. Australia and New Zealand
- 17.3.9.6. Indonesia
- 17.3.9.7. Malaysia
- 17.3.9.8. Thailand
- 17.3.9.9. Vietnam
- 17.3.9.10. Rest of Asia Pacific
- 17.4. China Intimate Care pH-Balanced Products Market
- 17.4.1. Country Segmental Analysis
- 17.4.2. Product Type
- 17.4.3. pH Level Range
- 17.4.4. Formulation
- 17.4.5. Ingredient Base
- 17.4.6. Consumer Demographics
- 17.4.7. Packaging Type
- 17.4.8. Distribution Channel
- 17.4.9. End-users
- 17.5. India Intimate Care pH-Balanced Products Market
- 17.5.1. Country Segmental Analysis
- 17.5.2. Product Type
- 17.5.3. pH Level Range
- 17.5.4. Formulation
- 17.5.5. Ingredient Base
- 17.5.6. Consumer Demographics
- 17.5.7. Packaging Type
- 17.5.8. Distribution Channel
- 17.5.9. End-users
- 17.6. Japan Intimate Care pH-Balanced Products Market
- 17.6.1. Country Segmental Analysis
- 17.6.2. Product Type
- 17.6.3. pH Level Range
- 17.6.4. Formulation
- 17.6.5. Ingredient Base
- 17.6.6. Consumer Demographics
- 17.6.7. Packaging Type
- 17.6.8. Distribution Channel
- 17.6.9. End-users
- 17.7. South Korea Intimate Care pH-Balanced Products Market
- 17.7.1. Country Segmental Analysis
- 17.7.2. Product Type
- 17.7.3. pH Level Range
- 17.7.4. Formulation
- 17.7.5. Ingredient Base
- 17.7.6. Consumer Demographics
- 17.7.7. Packaging Type
- 17.7.8. Distribution Channel
- 17.7.9. End-users
- 17.8. Australia and New Zealand Intimate Care pH-Balanced Products Market
- 17.8.1. Country Segmental Analysis
- 17.8.2. Product Type
- 17.8.3. pH Level Range
- 17.8.4. Formulation
- 17.8.5. Ingredient Base
- 17.8.6. Consumer Demographics
- 17.8.7. Packaging Type
- 17.8.8. Distribution Channel
- 17.8.9. End-users
- 17.9. Indonesia Intimate Care pH-Balanced Products Market
- 17.9.1. Country Segmental Analysis
- 17.9.2. Product Type
- 17.9.3. pH Level Range
- 17.9.4. Formulation
- 17.9.5. Ingredient Base
- 17.9.6. Consumer Demographics
- 17.9.7. Packaging Type
- 17.9.8. Distribution Channel
- 17.9.9. End-users
- 17.10. Malaysia Intimate Care pH-Balanced Products Market
- 17.10.1. Country Segmental Analysis
- 17.10.2. Product Type
- 17.10.3. pH Level Range
- 17.10.4. Formulation
- 17.10.5. Ingredient Base
- 17.10.6. Consumer Demographics
- 17.10.7. Packaging Type
- 17.10.8. Distribution Channel
- 17.10.9. End-users
- 17.11. Thailand Intimate Care pH-Balanced Products Market
- 17.11.1. Country Segmental Analysis
- 17.11.2. Product Type
- 17.11.3. pH Level Range
- 17.11.4. Formulation
- 17.11.5. Ingredient Base
- 17.11.6. Consumer Demographics
- 17.11.7. Packaging Type
- 17.11.8. Distribution Channel
- 17.11.9. End-users
- 17.12. Vietnam Intimate Care pH-Balanced Products Market
- 17.12.1. Country Segmental Analysis
- 17.12.2. Product Type
- 17.12.3. pH Level Range
- 17.12.4. Formulation
- 17.12.5. Ingredient Base
- 17.12.6. Consumer Demographics
- 17.12.7. Packaging Type
- 17.12.8. Distribution Channel
- 17.12.9. End-users
- 17.13. Rest of Asia Pacific Intimate Care pH-Balanced Products Market
- 17.13.1. Country Segmental Analysis
- 17.13.2. Product Type
- 17.13.3. pH Level Range
- 17.13.4. Formulation
- 17.13.5. Ingredient Base
- 17.13.6. Consumer Demographics
- 17.13.7. Packaging Type
- 17.13.8. Distribution Channel
- 17.13.9. End-users
- 18. Middle East Intimate Care pH-Balanced Products Market Analysis
- 18.1. Key Segment Analysis
- 18.2. Regional Snapshot
- 18.3. Middle East Intimate Care pH-Balanced Products Market Size (Value - US$ Bn), Analysis, and Forecasts, 2021-2035
- 18.3.1. Product Type
- 18.3.2. pH Level Range
- 18.3.3. Formulation
- 18.3.4. Ingredient Base
- 18.3.5. Consumer Demographics
- 18.3.6. Packaging Type
- 18.3.7. Distribution Channel
- 18.3.8. End-users
- 18.3.9. Country
- 18.3.9.1. Turkey
- 18.3.9.2. UAE
- 18.3.9.3. Saudi Arabia
- 18.3.9.4. Israel
- 18.3.9.5. Rest of Middle East
- 18.4. Turkey Intimate Care pH-Balanced Products Market
- 18.4.1. Country Segmental Analysis
- 18.4.2. Product Type
- 18.4.3. pH Level Range
- 18.4.4. Formulation
- 18.4.5. Ingredient Base
- 18.4.6. Consumer Demographics
- 18.4.7. Packaging Type
- 18.4.8. Distribution Channel
- 18.4.9. End-users
- 18.5. UAE Intimate Care pH-Balanced Products Market
- 18.5.1. Country Segmental Analysis
- 18.5.2. Product Type
- 18.5.3. pH Level Range
- 18.5.4. Formulation
- 18.5.5. Ingredient Base
- 18.5.6. Consumer Demographics
- 18.5.7. Packaging Type
- 18.5.8. Distribution Channel
- 18.5.9. End-users
- 18.6. Saudi Arabia Intimate Care pH-Balanced Products Market
- 18.6.1. Country Segmental Analysis
- 18.6.2. Product Type
- 18.6.3. pH Level Range
- 18.6.4. Formulation
- 18.6.5. Ingredient Base
- 18.6.6. Consumer Demographics
- 18.6.7. Packaging Type
- 18.6.8. Distribution Channel
- 18.6.9. End-users
- 18.7. Israel Intimate Care pH-Balanced Products Market
- 18.7.1. Country Segmental Analysis
- 18.7.2. Product Type
- 18.7.3. pH Level Range
- 18.7.4. Formulation
- 18.7.5. Ingredient Base
- 18.7.6. Consumer Demographics
- 18.7.7. Packaging Type
- 18.7.8. Distribution Channel
- 18.7.9. End-users
- 18.8. Rest of Middle East Intimate Care pH-Balanced Products Market
- 18.8.1. Country Segmental Analysis
- 18.8.2. Product Type
- 18.8.3. pH Level Range
- 18.8.4. Formulation
- 18.8.5. Ingredient Base
- 18.8.6. Consumer Demographics
- 18.8.7. Packaging Type
- 18.8.8. Distribution Channel
- 18.8.9. End-users
- 19. Africa Intimate Care pH-Balanced Products Market Analysis
- 19.1. Key Segment Analysis
- 19.2. Regional Snapshot
- 19.3. Africa Intimate Care pH-Balanced Products Market Size (Value - US$ Bn), Analysis, and Forecasts, 2021-2035
- 19.3.1. Product Type
- 19.3.2. pH Level Range
- 19.3.3. Formulation
- 19.3.4. Ingredient Base
- 19.3.5. Consumer Demographics
- 19.3.6. Packaging Type
- 19.3.7. Distribution Channel
- 19.3.8. End-users
- 19.3.9. Country
- 19.3.9.1. South Africa
- 19.3.9.2. Egypt
- 19.3.9.3. Nigeria
- 19.3.9.4. Algeria
- 19.3.9.5. Rest of Africa
- 19.4. South Africa Intimate Care pH-Balanced Products Market
- 19.4.1. Country Segmental Analysis
- 19.4.2. Product Type
- 19.4.3. pH Level Range
- 19.4.4. Formulation
- 19.4.5. Ingredient Base
- 19.4.6. Consumer Demographics
- 19.4.7. Packaging Type
- 19.4.8. Distribution Channel
- 19.4.9. End-users
- 19.5. Egypt Intimate Care pH-Balanced Products Market
- 19.5.1. Country Segmental Analysis
- 19.5.2. Product Type
- 19.5.3. pH Level Range
- 19.5.4. Formulation
- 19.5.5. Ingredient Base
- 19.5.6. Consumer Demographics
- 19.5.7. Packaging Type
- 19.5.8. Distribution Channel
- 19.5.9. End-users
- 19.6. Nigeria Intimate Care pH-Balanced Products Market
- 19.6.1. Country Segmental Analysis
- 19.6.2. Product Type
- 19.6.3. pH Level Range
- 19.6.4. Formulation
- 19.6.5. Ingredient Base
- 19.6.6. Consumer Demographics
- 19.6.7. Packaging Type
- 19.6.8. Distribution Channel
- 19.6.9. End-users
- 19.7. Algeria Intimate Care pH-Balanced Products Market
- 19.7.1. Country Segmental Analysis
- 19.7.2. Product Type
- 19.7.3. pH Level Range
- 19.7.4. Formulation
- 19.7.5. Ingredient Base
- 19.7.6. Consumer Demographics
- 19.7.7. Packaging Type
- 19.7.8. Distribution Channel
- 19.7.9. End-users
- 19.8. Rest of Africa Intimate Care pH-Balanced Products Market
- 19.8.1. Country Segmental Analysis
- 19.8.2. Product Type
- 19.8.3. pH Level Range
- 19.8.4. Formulation
- 19.8.5. Ingredient Base
- 19.8.6. Consumer Demographics
- 19.8.7. Packaging Type
- 19.8.8. Distribution Channel
- 19.8.9. End-users
- 20. South America Intimate Care pH-Balanced Products Market Analysis
- 20.1. Key Segment Analysis
- 20.2. Regional Snapshot
- 20.3. South America Intimate Care pH-Balanced Products Market Size (Value - US$ Bn), Analysis, and Forecasts, 2021-2035
- 20.3.1. Product Type
- 20.3.2. pH Level Range
- 20.3.3. Formulation
- 20.3.4. Ingredient Base
- 20.3.5. Consumer Demographics
- 20.3.6. Packaging Type
- 20.3.7. Distribution Channel
- 20.3.8. End-users
- 20.3.9. Country
- 20.3.9.1. Brazil
- 20.3.9.2. Argentina
- 20.3.9.3. Rest of South America
- 20.4. Brazil Intimate Care pH-Balanced Products Market
- 20.4.1. Country Segmental Analysis
- 20.4.2. Product Type
- 20.4.3. pH Level Range
- 20.4.4. Formulation
- 20.4.5. Ingredient Base
- 20.4.6. Consumer Demographics
- 20.4.7. Packaging Type
- 20.4.8. Distribution Channel
- 20.4.9. End-users
- 20.5. Argentina Intimate Care pH-Balanced Products Market
- 20.5.1. Country Segmental Analysis
- 20.5.2. Product Type
- 20.5.3. pH Level Range
- 20.5.4. Formulation
- 20.5.5. Ingredient Base
- 20.5.6. Consumer Demographics
- 20.5.7. Packaging Type
- 20.5.8. Distribution Channel
- 20.5.9. End-users
- 20.6. Rest of South America Intimate Care pH-Balanced Products Market
- 20.6.1. Country Segmental Analysis
- 20.6.2. Product Type
- 20.6.3. pH Level Range
- 20.6.4. Formulation
- 20.6.5. Ingredient Base
- 20.6.6. Consumer Demographics
- 20.6.7. Packaging Type
- 20.6.8. Distribution Channel
- 20.6.9. End-users
- 21. Key Players/ Company Profile
- 21.1. Combe Incorporated
- 21.1.1. Company Details/ Overview
- 21.1.2. Company Financials
- 21.1.3. Key Customers and Competitors
- 21.1.4. Business/ Industry Portfolio
- 21.1.5. Product Portfolio/ Specification Details
- 21.1.6. Pricing Data
- 21.1.7. Strategic Overview
- 21.1.8. Recent Developments
- 21.2. Emerita
- 21.3. Femfresh (Church & Dwight)
- 21.4. Good Clean Love
- 21.5. Healthy Hoohoo
- 21.6. Johnson & Johnson
- 21.7. Lactacyd (Sanofi)
- 21.8. Love Wellness
- 21.9. Luvena
- 21.10. pH-D Feminine Health
- 21.11. Queen V
- 21.12. Reckitt Benckiser Group
- 21.13. RepHresh (Church & Dwight)
- 21.14. Sliquid
- 21.15. Summer's Eve (C.B. Fleet Company)
- 21.16. The Honey Pot Company
- 21.17. The Procter & Gamble Company
- 21.18. Unilever
- 21.19. Vagisil (Combe)
- 21.20. Woo More Play
- 21.21. Other Key Players
- 21.1. Combe Incorporated
Note* - This is just tentative list of players. While providing the report, we will cover more number of players based on their revenue and share for each geography
Research Design
Our research design integrates both demand-side and supply-side analysis through a balanced combination of primary and secondary research methodologies. By utilizing both bottom-up and top-down approaches alongside rigorous data triangulation methods, we deliver robust market intelligence that supports strategic decision-making.
MarketGenics' comprehensive research design framework ensures the delivery of accurate, reliable, and actionable market intelligence. Through the integration of multiple research approaches, rigorous validation processes, and expert analysis, we provide our clients with the insights needed to make informed strategic decisions and capitalize on market opportunities.

MarketGenics leverages a dedicated industry panel of experts and a comprehensive suite of paid databases to effectively collect, consolidate, and analyze market intelligence.
Our approach has consistently proven to be reliable and effective in generating accurate market insights, identifying key industry trends, and uncovering emerging business opportunities.
Through both primary and secondary research, we capture and analyze critical company-level data such as manufacturing footprints, including technical centers, R&D facilities, sales offices, and headquarters.
Our expert panel further enhances our ability to estimate market size for specific brands based on validated field-level intelligence.
Our data mining techniques incorporate both parametric and non-parametric methods, allowing for structured data collection, sorting, processing, and cleaning.
Demand projections are derived from large-scale data sets analyzed through proprietary algorithms, culminating in robust and reliable market sizing.
Research Approach
The bottom-up approach builds market estimates by starting with the smallest addressable market units and systematically aggregating them to create comprehensive market size projections.
This method begins with specific, granular data points and builds upward to create the complete market landscape.
Customer Analysis → Segmental Analysis → Geographical Analysis
The top-down approach starts with the broadest possible market data and systematically narrows it down through a series of filters and assumptions to arrive at specific market segments or opportunities.
This method begins with the big picture and works downward to increasingly specific market slices.
TAM → SAM → SOM


Research Methods
Desk / Secondary Research
While analysing the market, we extensively study secondary sources, directories, and databases to identify and collect information useful for this technical, market-oriented, and commercial report. Secondary sources that we utilize are not only the public sources, but it is a combination of Open Source, Associations, Paid Databases, MG Repository & Knowledgebase, and others.
- Company websites, annual reports, financial reports, broker reports, and investor presentations
- National government documents, statistical databases and reports
- News articles, press releases and web-casts specific to the companies operating in the market, Magazines, reports, and others
- We gather information from commercial data sources for deriving company specific data such as segmental revenue, share for geography, product revenue, and others
- Internal and external proprietary databases (industry-specific), relevant patent, and regulatory databases
- Governing Bodies, Government Organizations
- Relevant Authorities, Country-specific Associations for Industries
We also employ the model mapping approach to estimate the product level market data through the players' product portfolio
Primary Research
Primary research/ interviews is vital in analyzing the market. Most of the cases involves paid primary interviews. Primary sources include primary interviews through e-mail interactions, telephonic interviews, surveys as well as face-to-face interviews with the different stakeholders across the value chain including several industry experts.
| Type of Respondents | Number of Primaries |
|---|---|
| Tier 2/3 Suppliers | ~20 |
| Tier 1 Suppliers | ~25 |
| End-users | ~25 |
| Industry Expert/ Panel/ Consultant | ~30 |
| Total | ~100 |
MG Knowledgebase
• Repository of industry blog, newsletter and case studies
• Online platform covering detailed market reports, and company profiles
Forecasting Factors and Models
Forecasting Factors
- Historical Trends – Past market patterns, cycles, and major events that shaped how markets behave over time. Understanding past trends helps predict future behavior.
- Industry Factors – Specific characteristics of the industry like structure, regulations, and innovation cycles that affect market dynamics.
- Macroeconomic Factors – Economic conditions like GDP growth, inflation, and employment rates that affect how much money people have to spend.
- Demographic Factors – Population characteristics like age, income, and location that determine who can buy your product.
- Technology Factors – How quickly people adopt new technology and how much technology infrastructure exists.
- Regulatory Factors – Government rules, laws, and policies that can help or restrict market growth.
- Competitive Factors – Analyzing competition structure such as degree of competition and bargaining power of buyers and suppliers.
Forecasting Models / Techniques
Multiple Regression Analysis
- Identify and quantify factors that drive market changes
- Statistical modeling to establish relationships between market drivers and outcomes
Time Series Analysis – Seasonal Patterns
- Understand regular cyclical patterns in market demand
- Advanced statistical techniques to separate trend, seasonal, and irregular components
Time Series Analysis – Trend Analysis
- Identify underlying market growth patterns and momentum
- Statistical analysis of historical data to project future trends
Expert Opinion – Expert Interviews
- Gather deep industry insights and contextual understanding
- In-depth interviews with key industry stakeholders
Multi-Scenario Development
- Prepare for uncertainty by modeling different possible futures
- Creating optimistic, pessimistic, and most likely scenarios
Time Series Analysis – Moving Averages
- Sophisticated forecasting for complex time series data
- Auto-regressive integrated moving average models with seasonal components
Econometric Models
- Apply economic theory to market forecasting
- Sophisticated economic models that account for market interactions
Expert Opinion – Delphi Method
- Harness collective wisdom of industry experts
- Structured, multi-round expert consultation process
Monte Carlo Simulation
- Quantify uncertainty and probability distributions
- Thousands of simulations with varying input parameters
Research Analysis
Our research framework is built upon the fundamental principle of validating market intelligence from both demand and supply perspectives. This dual-sided approach ensures comprehensive market understanding and reduces the risk of single-source bias.
Demand-Side Analysis: We understand end-user/application behavior, preferences, and market needs along with the penetration of the product for specific application.
Supply-Side Analysis: We estimate overall market revenue, analyze the segmental share along with industry capacity, competitive landscape, and market structure.
Validation & Evaluation
Data triangulation is a validation technique that uses multiple methods, sources, or perspectives to examine the same research question, thereby increasing the credibility and reliability of research findings. In market research, triangulation serves as a quality assurance mechanism that helps identify and minimize bias, validate assumptions, and ensure accuracy in market estimates.
- Data Source Triangulation – Using multiple data sources to examine the same phenomenon
- Methodological Triangulation – Using multiple research methods to study the same research question
- Investigator Triangulation – Using multiple researchers or analysts to examine the same data
- Theoretical Triangulation – Using multiple theoretical perspectives to interpret the same data

Custom Market Research Services
We will customise the research for you, in case the report listed above does not meet your requirements.
Get 10% Free Customisation