Lecithin Market Size, Share & Trends Analysis Report by Source (Soy Lecithin, Sunflower Lecithin, Rapeseed/Canola Lecithin, Egg Lecithin, Marine Lecithin, Corn Lecithin, Rice Lecithin, Other Sources), Form, Nature, Phospholipid Content, Processing Method, Distribution Channel, End-use Industry, and Geography (North America, Europe, Asia Pacific, Middle East, Africa, and South America) – Global Industry Data, Trends, and Forecasts, 2026–2035
|
|
|
Segmental Data Insights |
|
|
Demand Trends |
|
|
Competitive Landscape |
|
|
Strategic Development |
|
|
Future Outlook & Opportunities |
|
Lecithin Market Size, Share, and Growth
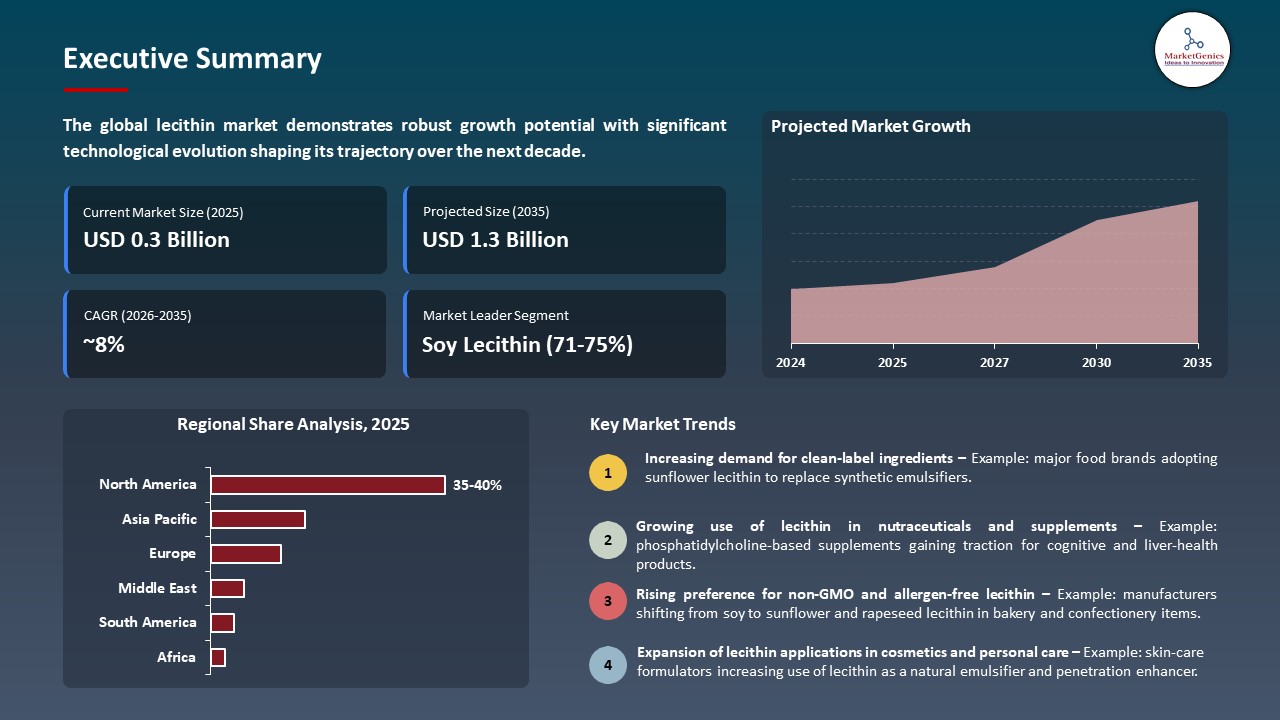
The global lecithin market is experiencing robust growth, with its estimated value of USD 0.6 billion in the year 2025 and USD 1.3 billion by the period 2035, registering a CAGR of 7.8%, during the forecast period. The global lecithin market is driven by its growing use in food, pharmaceuticals, and cosmetics as an emulsifier and stabilizer, rising preference for clean-label and plant-based ingredients, and expanding applications in bakery, confectionery, and nutraceutical products.
Ian Pinner, president of ADM’s Nutrition business, said, “Optimizing our soy protein production network is an example of how we’re strengthening our asset platform, combining capital discipline with smart organic innovation and operational improvements to increase cash flows and returns. These decisive actions will help ensure we can continue delivering industry-leading innovative products to our customers while sharpening our competitive advantage. With our Decatur plant resuming operations, we expect operating profit to improve over time as we achieve manufacturing efficiencies and build back our Specialty Ingredients business.”
The global lecithin market is experiencing growth due to the rising demand of clean label and plant-based ingredients in food, cosmetics and nutraceutical industries. For instance, in May 2025, Louis Dreyfus Company (LDC) opened a new, automated production line of specialty feed lecithin at its Tianjin oil seeds crushing facility to increase their production of soy-based lecithin in response to the growing demand of plant derived ingredients. This growth enhances the supply of the plant-based lecithin globally, raising the availability and assisting to satisfy the demand of the food, feed, and nutraceutical food producers.
Additionally, the global lecithin market is the expanding use of high purity lecithin in functional foods and drug preparations due to its emulsifying, stabilizing and health promoting qualities. For example, in 2025 Lipoid GmbH introduced a high-end phospholipid product range, based on natural, non-GMO soy and sunflower lecithin, to be used in dietary supplements, cosmetics and nutraceutical products. This introduction will boost supply of high quality, clean label lecithin to health, cosmetic, and nutraceutical markets.
Key opportunities adjacent to the global lecithin market include plant-based protein ingredients, functional food additives, nutraceutical formulations, clean-label emulsifiers for cosmetics, and pharmaceutical excipients. These industries provide synergies in expanding the use of lecithin by allowing products manufacturers to diversify the product line and capitalize on production capacity. The adjacent markets offer growth opportunities and promote lecithin product demand in various high-value markets.
Lecithin Market Dynamics and Trends
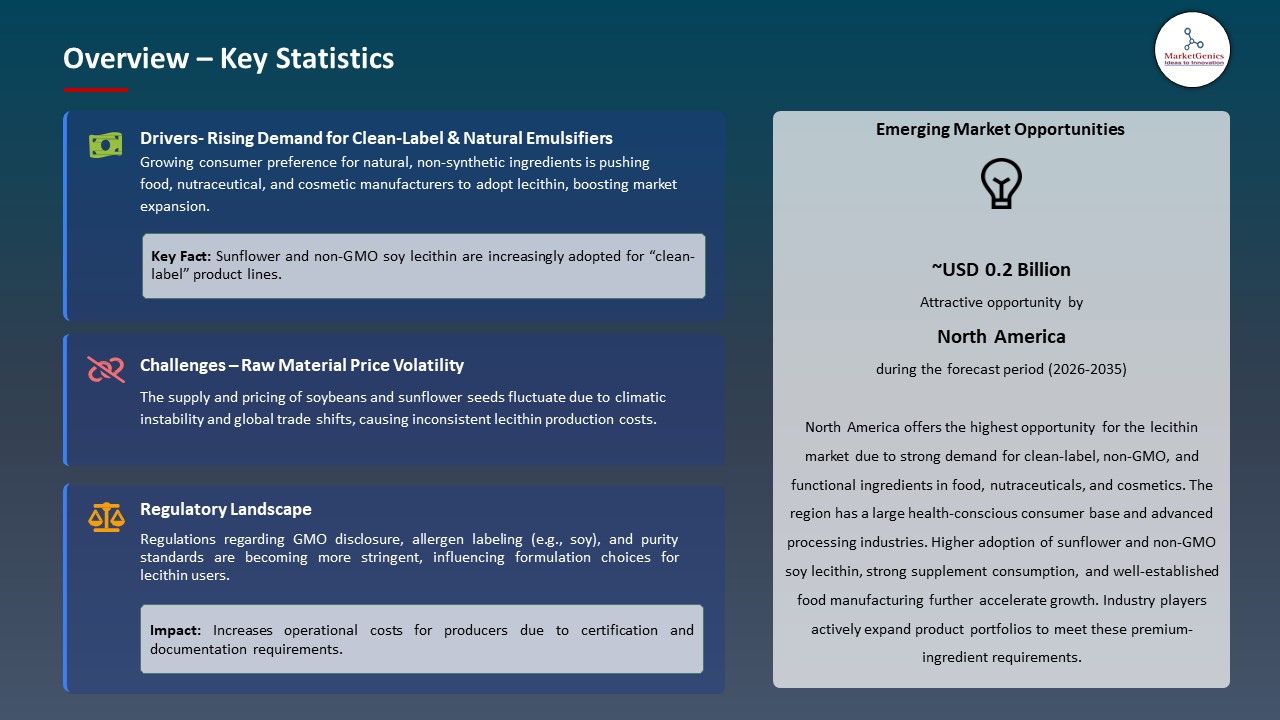
Driver: Expansion of Processed & Convenience Food Industries Globally
-
The lecithin market expansion substantially aided by the pronounced growth of the processed and convenience-food industry in the world. The demand of baked goods, confectioneries, dairy-alternatives, and instant foods are on the increase due to increased urbanization and change in the lifestyle of consumers toward fast, ready-to-eat food.
- These food products are highly dependent on lecithin as a functional ingredient, such as its capacity to emulsify, improve texture, and extend shelf-life, and thus it is a vital ingredient in the current food production.
- For instance, in August 2024, Bunge Limited announced that it was expanding its lecithin range in North America to comprise de-oiled soybean lecithin in powdered and granulated forms targeting the beverages, bakery, snacks, supplement and pet food manufacturing sectors in response to the escalating demand of processed and convenient foods.
- The additional supply of high-performance lecithin provides food manufacturers with greater ability to produce processed and convenience food, and retain optimal texture and shelves life stability.
- This growth increases the lecithin availability in the world, which aids the growth of processed and convenience-food production.
Restraint: Raw Material Price Volatility and Supply Instability from Agricultural Inputs
-
The lecithin market considerably influenced by the volatility of raw material prices, instability of supply, which is one of the main challenges of manufacturers. The production of lecithin depends on the agricultural products including soybean, sunflower, and rapeseed, which are susceptible to seasonal changes, poor climate, and political influences.
- The unpredictability concerning crop yield related to droughts, floods or any other environmental circumstances may result in conspicuous supply shortage, which constrains producers to look after scarce raw materials at inflated costs. Moreover, the supply chain disruption may be enhanced by the global trade restrictions or tariffs, which adds more procurement costs and uncertainties to operations.
- These variables may affect the planning of production, decrease profitability, and the cost of lecithin in the end-use market, including food, nutraceuticals, and cosmetics. Manufacturers might be forced to bear additional expenses to the customers or find other raw materials which might compromise the quality of their products and competitiveness in the market.
- Constant supply and price volatility have the potential to limit market expansion and restrict mass application in price-sensitive markets.
Opportunity: Rising Demand for Non‑GMO and Allergen‑Free Sunflower/Clean‑Label Lecithin
-
The lecithin market is also witnessing significant expansion, owing to the escalating demand of non-GMO, allergens-free as well as clean-label ingredient, especially of sunflower and other plant-based lecithin. High expectations of consumers on the levels of transparency, natural sourcing, and health have made manufacturers turn to plant-based, safer emulsifiers instead of soy-based or synthetic emulsifiers.
- This shift is especially evident in sectors such as functional foods, beverages, nutraceuticals, and personal-care products, where the quality of the ingredients and consumer perception are of paramount importance in the purchase decisions.
- For instance, in 2025, Austrade Inc. introduced a non-GMO hydrolyzed sunflower lecithin powder for functional beverages, which is indicative of how major ingredient suppliers have been reacting to the increasing demand in clean-label functional emulsifier-free items. The trend also allows companies to create allergen-free, health-conscious, and vegan products based on the emerging consumer demands.
- The increasing demand of non-GMO and clean-label lecithin is a source of market expansion and increasing penetration into a range of diverse, health-conscious, and regulation-sensitive markets.
Key Trend: Increasing Development of Modified and Specialty Lecithin Products for Advanced Applications
-
The lecithin market is experiencing significant growth, owing to the proliferation of modified and specialty lecithin products, which are aimed at advanced purposes. Manufacturers are increasingly working on production of lecithin forms that provide greater functionality, such as superior emulsification, better solubility, better stability, and performance specific to the application, allowing more accurate formulation across a wide variety of industries.
- For instace, in 2025, Fismer Lecithin launched CosmiFis, a specialised brand of lecithin designed to be used in cosmetics and personal-care products. The introduction underscores the fact that the industry has become more of a high-function, application-specific lecithin solution which not only provides the traditional food applications, but also addresses the finer needs of high-end formulations.
- These innovations enable lecithin to work across numerous industries, such as the food industry, nutraceutical, pharmaceutical, and the cosmetic industry to give each industry a tailored performance.
- The expansion of modified and specialty lecithin increases market access, and contributes to the development of premium products and increased usage in various and high-value applications.
Lecithin-Market Analysis and Segmental Data
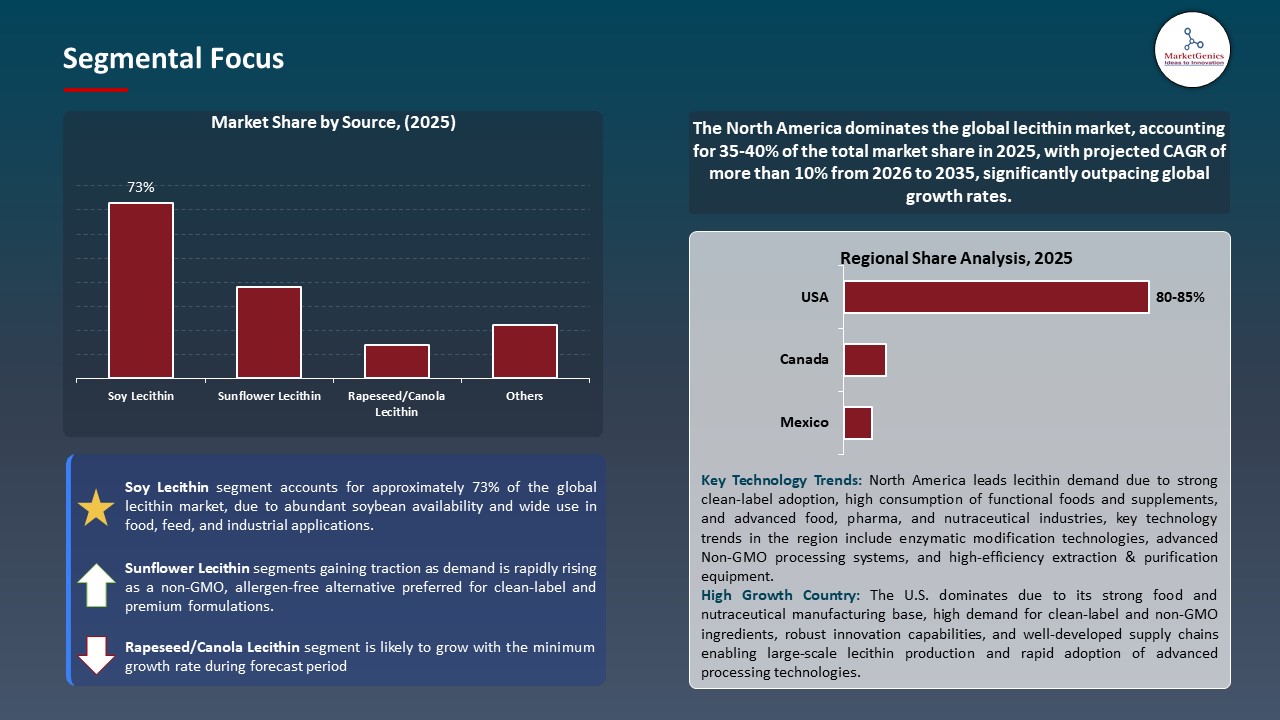
Soy Lecithin Dominate Global Lecithin Market
-
The soy lecithin segment dominates the global lecithin market, due to its prevalence, affordability and adequate processing facilities. Soy lecithin has multifunctional properties like emulsification, stabilizing and dispersing, which predisposes it to a broad application in food, nutraceuticals, cosmetics and industrial products.
- It is also flexible to other formulations such as bakery, confectionery, dairy substitutes, and beverages, another strength that enhances its position in the market. For instance, key players like Cargill and Bunge have invested in the increased production of soy lecithin to keep up with the rising demand especially in North America and Europe. These expansions improve the reliability of supply and provide the uniformity of quality to large food and ingredients producers.
- Soy lecithin dominance offers manufacturers a cost-effective, easily sourced, and multifunctional ingredient that consolidates the dominance of soy lecithin in global lecithin application and reflects on the market stability and growth.
North America Leads Global Lecithin Market Demand
-
North America leads the lecithin market, due to the high demand of the region in clean label and non-GMO products. The consumers are increasingly partial to naturally obtained emulsifiers in processed foods, nutraceuticals, and beverages thus compelling manufacturers to use soy and sunflower lecithin to comply with the regulatory standards and consumer demands.
- For instance, in 2025, Austrade Inc., a North American supplier of ingredients, which has established itself as a regional expert in naturally non-GMO and organic sunflower lecithin, offering one of the largest product lines of sunflower lecithin as clean-label emulsifier to food and beverage manufacturers. The expanded sunflower lecithin portfolio will consolidate clean-label product offerings and aid the increased demand in the North American region.
- Additionally, North America has a well-developed food processing and soybean-crushing network which guarantees the supply of good quality lecithin. This strong production chain promotes mass adoption in bakery, confectionery, dairy substitutes and dietary supplements markets to sustain market growth and competitive edge.
- The clean-label trend coupled with the excellent production infrastructure would guarantee sustained demand on lecithin in North America, a dominant market growth, production, and application in food, beverage, and nutraceutical industries.
Lecithin-Market Ecosystem
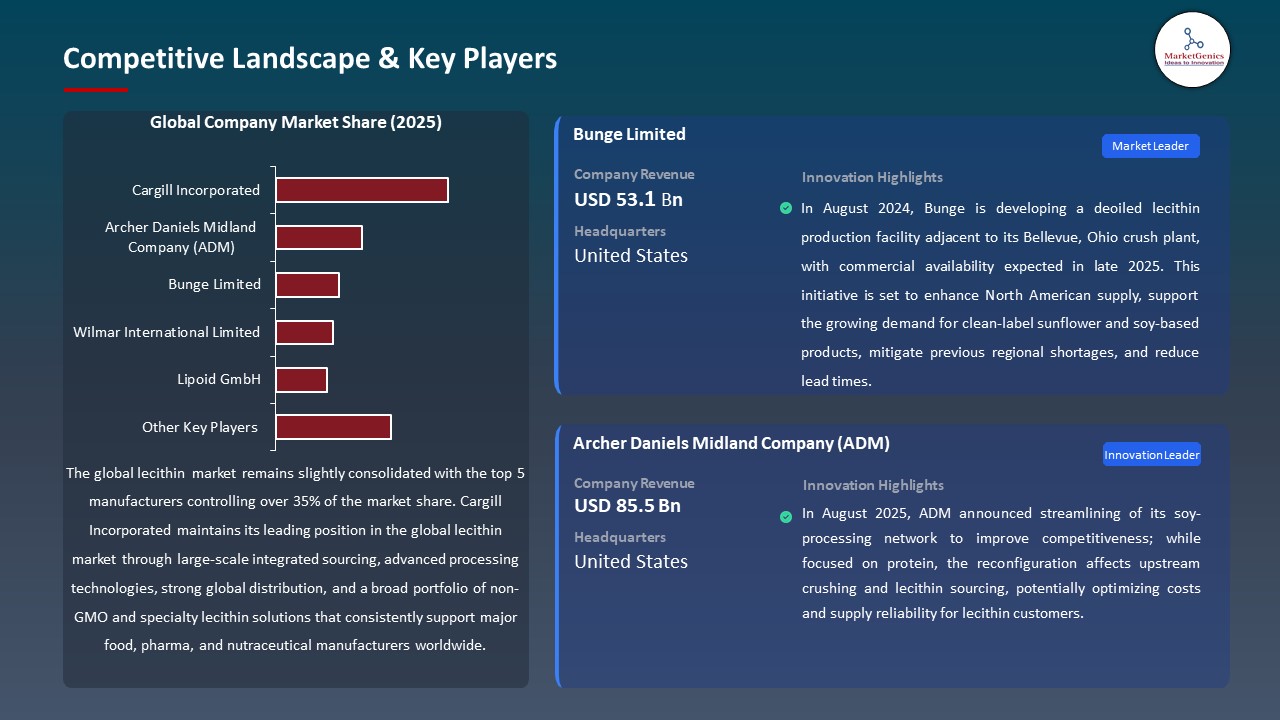
The global lecithin market is slightly consolidated, with high concentration among key players such as Cargill Incorporated, Archer Daniels Midland Company (ADM), Bunge Limited, Wilmar International Limited, and Lipoid GmbH, who dominate through strategic initiatives including large-scale manufacturing capacities, acquisitions, product expansions, technological innovations, and global distribution channels, which allow these players to secure a large portion of the market, control prices, quality standards and supply chain stability across the industry.
The consolidation of the market by major players increases the efficiency of operation, reliability of supply and spurs innovation, and imposes barriers to entry by minor players.
Recent Development and Strategic Overview:
-
In August 2025, Bunge entered into a purchase deal with IFF to obtain its soy protein, lecithin and crush businesses which would enhance its ingredient portfolio and vertical integration driving its market share growth in the food-grade lecithin and complementary plant-protein solutions.
- In August 2025, ADM announced streamlining of its soy-processing network to improve competitiveness; while focused on protein, the reconfiguration affects upstream crushing and lecithin sourcing, potentially optimizing costs and supply reliability for lecithin customers.
Report Scope
|
Detail |
|
|
Market Size in 2025 |
USD 0.6 Bn |
|
Market Forecast Value in 2035 |
USD 1.3 Bn |
|
Growth Rate (CAGR) |
7.8% |
|
Forecast Period |
2026 – 2035 |
|
Historical Data Available for |
2021 – 2024 |
|
Market Size Units |
US$ Billion for Value Tons for Volume |
|
Report Format |
Electronic (PDF) + Excel |
|
North America |
Europe |
Asia Pacific |
Middle East |
Africa |
South America |
|
|
|
|
|
|
|
Companies Covered |
|||||
|
|
|
|
|
|
Lecithin-Market Segmentation and Highlights
|
Segment |
Sub-segment |
|
Lecithin Market, By Source |
|
|
Lecithin Market, By Form |
|
|
Lecithin Market, By Nature |
|
|
Lecithin Market, By Phospholipid Content |
|
|
Lecithin Market, By Processing Method
|
|
|
Lecithin Market, By Distribution Channel
|
|
|
Lecithin Market, By End-use Industry |
|
Frequently Asked Questions
Table of Contents
- 1. Research Methodology and Assumptions
- 1.1. Definitions
- 1.2. Research Design and Approach
- 1.3. Data Collection Methods
- 1.4. Base Estimates and Calculations
- 1.5. Forecasting Models
- 1.5.1. Key Forecast Factors & Impact Analysis
- 1.6. Secondary Research
- 1.6.1. Open Sources
- 1.6.2. Paid Databases
- 1.6.3. Associations
- 1.7. Primary Research
- 1.7.1. Primary Sources
- 1.7.2. Primary Interviews with Stakeholders across Ecosystem
- 2. Executive Summary
- 2.1. Global Lecithin Market Outlook
- 2.1.1. Lecithin Market Size (Volume - Tons and Value - US$ Bn), and Forecasts, 2021-2035
- 2.1.2. Compounded Annual Growth Rate Analysis
- 2.1.3. Growth Opportunity Analysis
- 2.1.4. Segmental Share Analysis
- 2.1.5. Geographical Share Analysis
- 2.2. Market Analysis and Facts
- 2.3. Supply-Demand Analysis
- 2.4. Competitive Benchmarking
- 2.5. Go-to- Market Strategy
- 2.5.1. Customer/ End-use Industry Assessment
- 2.5.2. Growth Opportunity Data, 2026-2035
- 2.5.2.1. Regional Data
- 2.5.2.2. Country Data
- 2.5.2.3. Segmental Data
- 2.5.3. Identification of Potential Market Spaces
- 2.5.4. GAP Analysis
- 2.5.5. Potential Attractive Price Points
- 2.5.6. Prevailing Market Risks & Challenges
- 2.5.7. Preferred Sales & Marketing Strategies
- 2.5.8. Key Recommendations and Analysis
- 2.5.9. A Way Forward
- 2.1. Global Lecithin Market Outlook
- 3. Industry Data and Premium Insights
- 3.1. Global Food & Beverages Industry Overview, 2025
- 3.1.1. Food & Beverages Industry Ecosystem Analysis
- 3.1.2. Key Trends for Food & Beverages Industry
- 3.1.3. Regional Distribution for Food & Beverages Industry
- 3.2. Supplier Customer Data
- 3.3. Technology Roadmap and Developments
- 3.4. Trade Analysis
- 3.4.1. Import & Export Analysis, 2025
- 3.4.2. Top Importing Countries
- 3.4.3. Top Exporting Countries
- 3.5. Trump Tariff Impact Analysis
- 3.5.1. Manufacturer
- 3.5.1.1. Based on the component & Raw material
- 3.5.2. Supply Chain
- 3.5.3. End Consumer
- 3.5.1. Manufacturer
- 3.6. Raw Material Analysis
- 3.1. Global Food & Beverages Industry Overview, 2025
- 4. Market Overview
- 4.1. Market Dynamics
- 4.1.1. Drivers
- 4.1.1.1. Rising demand for natural, clean-label, and plant-based emulsifiers
- 4.1.1.2. Expanding applications in food, pharmaceuticals, nutraceuticals, cosmetics, and animal feed
- 4.1.1.3. Growing health consciousness and demand for functional/vegan food products
- 4.1.2. Restraints
- 4.1.2.1. Volatile raw material prices (soybean, sunflower, etc.)
- 4.1.2.2. Competition from alternative emulsifiers and allergen concerns (especially soy-based)
- 4.1.1. Drivers
- 4.2. Key Trend Analysis
- 4.3. Regulatory Framework
- 4.3.1. Key Regulations, Norms, and Subsidies, by Key Countries
- 4.3.2. Tariffs and Standards
- 4.3.3. Impact Analysis of Regulations on the Market
- 4.4. Value Chain Analysis
- 4.4.1. Raw Material Suppliers
- 4.4.2. Lecithin Manufacturers& Formulation
- 4.4.3. Distribution & Logistics
- 4.4.4. End-Users
- 4.5. Porter’s Five Forces Analysis
- 4.6. PESTEL Analysis
- 4.7. Global Lecithin Market Demand
- 4.7.1. Historical Market Size – Volume (Tons) and Value (US$ Bn), 2020-2024
- 4.7.2. Current and Future Market Size – Volume (Tons) and Value (US$ Bn), 2026–2035
- 4.7.2.1. Y-o-Y Growth Trends
- 4.7.2.2. Absolute $ Opportunity Assessment
- 4.1. Market Dynamics
- 5. Competition Landscape
- 5.1. Competition structure
- 5.1.1. Fragmented v/s consolidated
- 5.2. Company Share Analysis, 2025
- 5.2.1. Global Company Market Share
- 5.2.2. By Region
- 5.2.2.1. North America
- 5.2.2.2. Europe
- 5.2.2.3. Asia Pacific
- 5.2.2.4. Middle East
- 5.2.2.5. Africa
- 5.2.2.6. South America
- 5.3. Product Comparison Matrix
- 5.3.1. Specifications
- 5.3.2. Market Positioning
- 5.3.3. Pricing
- 5.1. Competition structure
- 6. Global Lecithin Market Analysis, by Source
- 6.1. Key Segment Analysis
- 6.2. Lecithin Market Size (Volume - Tons and Value - US$ Bn), Analysis, and Forecasts, by Source, 2021-2035
- 6.2.1. Soy Lecithin
- 6.2.2. Sunflower Lecithin
- 6.2.3. Rapeseed/Canola Lecithin
- 6.2.4. Egg Lecithin
- 6.2.5. Marine Lecithin
- 6.2.6. Corn Lecithin
- 6.2.7. Rice Lecithin
- 6.2.8. Other Sources
- 7. Global Lecithin Market Analysis, by Form
- 7.1. Key Segment Analysis
- 7.2. Lecithin Market Size (Volume - Tons and Value - US$ Bn), Analysis, and Forecasts, by Form, 2021-2035
- 7.2.1. Liquid Lecithin
- 7.2.2. Granulated Lecithin
- 7.2.3. Powder Lecithin
- 7.2.4. De-oiled Lecithin
- 8. Global Lecithin Market Analysis, by Nature
- 8.1. Key Segment Analysis
- 8.2. Lecithin Market Size (Volume - Tons and Value - US$ Bn), Analysis, and Forecasts, by Nature, 2021-2035
- 8.2.1. Organic Lecithin
- 8.2.2. Conventional Lecithin
- 8.2.3. Non-GMO Lecithin
- 8.2.4. GMO Lecithin
- 9. Global Lecithin Market Analysis, by Phospholipid Content
- 9.1. Key Segment Analysis
- 9.2. Lecithin Market Size (Volume - Tons and Value - US$ Bn), Analysis, and Forecasts, by Phospholipid Content, 2021-2035
- 9.2.1. 40-50% phospholipids
- 9.2.2. 50-70% phospholipids
- 9.2.3. 70-90% phospholipids
- 9.2.4. >90% phospholipids
- 10. Global Lecithin Market Analysis, by Processing Method
- 10.1. Key Segment Analysis
- 10.2. Lecithin Market Size (Volume - Tons and Value - US$ Bn), Analysis, and Forecasts, by Processing Method, 2021-2035
- 10.2.1. Mechanical Extraction
- 10.2.2. Solvent Extraction
- 10.2.3. Enzymatic Extraction
- 10.2.4. Cold-Pressed
- 10.2.5. Refined Lecithin
- 10.2.6. Unrefined Lecithin
- 11. Global Lecithin Market Analysis, by Distribution Channel
- 11.1. Key Segment Analysis
- 11.2. Lecithin Market Size (Volume - Tons and Value - US$ Bn), Analysis, and Forecasts, by Distribution Channel, 2021-2035
- 11.2.1. Direct Sales/B2B
- 11.2.2. Distributors
- 11.2.3. Online Retail
- 11.2.4. Specialty Stores
- 11.2.5. Supermarkets/Hypermarkets
- 12. Global Lecithin Market Analysis, by End-use Industry
- 12.1. Key Segment Analysis
- 12.2. Lecithin Market Size (Volume - Tons and Value - US$ Bn), Analysis, and Forecasts, by End-use Industry, 2021-2035
- 12.2.1. Food & Beverages
- 12.2.2. Pharmaceuticals
- 12.2.3. Cosmetics & Personal Care
- 12.2.4. Animal Feed
- 12.2.5. Industrial Applications
- 12.2.5.1. Paints & Coatings
- 12.2.5.2. Printing Inks
- 12.2.5.3. Lubricants
- 12.2.5.4. Leather Treatment
- 12.2.5.5. Textiles
- 12.2.5.6. Others
- 12.2.6. Nutraceuticals
- 12.2.7. Other End-use
- 13. Global Lecithin Market Analysis and Forecasts, by Region
- 13.1. Key Findings
- 13.2. Lecithin Market Size (Volume - Tons and Value - US$ Bn), Analysis, and Forecasts, by Region, 2021-2035
- 13.2.1. North America
- 13.2.2. Europe
- 13.2.3. Asia Pacific
- 13.2.4. Middle East
- 13.2.5. Africa
- 13.2.6. South America
- 14. North America Lecithin Market Analysis
- 14.1. Key Segment Analysis
- 14.2. Regional Snapshot
- 14.3. North America Lecithin Market Size (Volume - Tons and Value - US$ Bn), Analysis, and Forecasts, 2021-2035
- 14.3.1. Source
- 14.3.2. Form
- 14.3.3. Nature
- 14.3.4. Phospholipid Content
- 14.3.5. Processing Method
- 14.3.6. Distribution Channel
- 14.3.7. End-use Industry
- 14.3.8. Country
- 14.3.8.1. USA
- 14.3.8.2. Canada
- 14.3.8.3. Mexico
- 14.4. USA Lecithin Market
- 14.4.1. Country Segmental Analysis
- 14.4.2. Source
- 14.4.3. Form
- 14.4.4. Nature
- 14.4.5. Phospholipid Content
- 14.4.6. Processing Method
- 14.4.7. Distribution Channel
- 14.4.8. End-use Industry
- 14.5. Canada Lecithin Market
- 14.5.1. Country Segmental Analysis
- 14.5.2. Source
- 14.5.3. Form
- 14.5.4. Nature
- 14.5.5. Phospholipid Content
- 14.5.6. Processing Method
- 14.5.7. Distribution Channel
- 14.5.8. End-use Industry
- 14.6. Mexico Lecithin Market
- 14.6.1. Country Segmental Analysis
- 14.6.2. Source
- 14.6.3. Form
- 14.6.4. Nature
- 14.6.5. Phospholipid Content
- 14.6.6. Processing Method
- 14.6.7. Distribution Channel
- 14.6.8. End-use Industry
- 15. Europe Lecithin Market Analysis
- 15.1. Key Segment Analysis
- 15.2. Regional Snapshot
- 15.3. Europe Lecithin Market Size (Volume - Tons and Value - US$ Bn), Analysis, and Forecasts, 2021-2035
- 15.3.1. Source
- 15.3.2. Form
- 15.3.3. Nature
- 15.3.4. Phospholipid Content
- 15.3.5. Processing Method
- 15.3.6. Distribution Channel
- 15.3.7. End-use Industry
- 15.3.8. Country
- 15.3.8.1. Germany
- 15.3.8.2. United Kingdom
- 15.3.8.3. France
- 15.3.8.4. Italy
- 15.3.8.5. Spain
- 15.3.8.6. Netherlands
- 15.3.8.7. Nordic Countries
- 15.3.8.8. Poland
- 15.3.8.9. Russia & CIS
- 15.3.8.10. Rest of Europe
- 15.4. Germany Lecithin Market
- 15.4.1. Country Segmental Analysis
- 15.4.2. Source
- 15.4.3. Form
- 15.4.4. Nature
- 15.4.5. Phospholipid Content
- 15.4.6. Processing Method
- 15.4.7. Distribution Channel
- 15.4.8. End-use Industry
- 15.5. United Kingdom Lecithin Market
- 15.5.1. Country Segmental Analysis
- 15.5.2. Source
- 15.5.3. Form
- 15.5.4. Nature
- 15.5.5. Phospholipid Content
- 15.5.6. Processing Method
- 15.5.7. Distribution Channel
- 15.5.8. End-use Industry
- 15.6. France Lecithin Market
- 15.6.1. Country Segmental Analysis
- 15.6.2. Source
- 15.6.3. Form
- 15.6.4. Nature
- 15.6.5. Phospholipid Content
- 15.6.6. Processing Method
- 15.6.7. Distribution Channel
- 15.6.8. End-use Industry
- 15.7. Italy Lecithin Market
- 15.7.1. Country Segmental Analysis
- 15.7.2. Source
- 15.7.3. Form
- 15.7.4. Nature
- 15.7.5. Phospholipid Content
- 15.7.6. Processing Method
- 15.7.7. Distribution Channel
- 15.7.8. End-use Industry
- 15.8. Spain Lecithin Market
- 15.8.1. Country Segmental Analysis
- 15.8.2. Source
- 15.8.3. Form
- 15.8.4. Nature
- 15.8.5. Phospholipid Content
- 15.8.6. Processing Method
- 15.8.7. Distribution Channel
- 15.8.8. End-use Industry
- 15.9. Netherlands Lecithin Market
- 15.9.1. Country Segmental Analysis
- 15.9.2. Source
- 15.9.3. Form
- 15.9.4. Nature
- 15.9.5. Phospholipid Content
- 15.9.6. Processing Method
- 15.9.7. Distribution Channel
- 15.9.8. End-use Industry
- 15.10. Nordic Countries Lecithin Market
- 15.10.1. Country Segmental Analysis
- 15.10.2. Source
- 15.10.3. Form
- 15.10.4. Nature
- 15.10.5. Phospholipid Content
- 15.10.6. Processing Method
- 15.10.7. Distribution Channel
- 15.10.8. End-use Industry
- 15.11. Poland Lecithin Market
- 15.11.1. Country Segmental Analysis
- 15.11.2. Source
- 15.11.3. Form
- 15.11.4. Nature
- 15.11.5. Phospholipid Content
- 15.11.6. Processing Method
- 15.11.7. Distribution Channel
- 15.11.8. End-use Industry
- 15.12. Russia & CIS Lecithin Market
- 15.12.1. Country Segmental Analysis
- 15.12.2. Source
- 15.12.3. Form
- 15.12.4. Nature
- 15.12.5. Phospholipid Content
- 15.12.6. Processing Method
- 15.12.7. Distribution Channel
- 15.12.8. End-use Industry
- 15.13. Rest of Europe Lecithin Market
- 15.13.1. Country Segmental Analysis
- 15.13.2. Source
- 15.13.3. Form
- 15.13.4. Nature
- 15.13.5. Phospholipid Content
- 15.13.6. Processing Method
- 15.13.7. Distribution Channel
- 15.13.8. End-use Industry
- 16. Asia Pacific Lecithin Market Analysis
- 16.1. Key Segment Analysis
- 16.2. Regional Snapshot
- 16.3. Asia Pacific Lecithin Market Size (Volume - Tons and Value - US$ Bn), Analysis, and Forecasts, 2021-2035
- 16.3.1. Source
- 16.3.2. Form
- 16.3.3. Nature
- 16.3.4. Phospholipid Content
- 16.3.5. Processing Method
- 16.3.6. Distribution Channel
- 16.3.7. End-use Industry
- 16.3.8. Country
- 16.3.8.1. China
- 16.3.8.2. India
- 16.3.8.3. Japan
- 16.3.8.4. South Korea
- 16.3.8.5. Australia and New Zealand
- 16.3.8.6. Indonesia
- 16.3.8.7. Malaysia
- 16.3.8.8. Thailand
- 16.3.8.9. Vietnam
- 16.3.8.10. Rest of Asia Pacific
- 16.4. China Lecithin Market
- 16.4.1. Country Segmental Analysis
- 16.4.2. Source
- 16.4.3. Form
- 16.4.4. Nature
- 16.4.5. Phospholipid Content
- 16.4.6. Processing Method
- 16.4.7. Distribution Channel
- 16.4.8. End-use Industry
- 16.5. India Lecithin Market
- 16.5.1. Country Segmental Analysis
- 16.5.2. Source
- 16.5.3. Form
- 16.5.4. Nature
- 16.5.5. Phospholipid Content
- 16.5.6. Processing Method
- 16.5.7. Distribution Channel
- 16.5.8. End-use Industry
- 16.6. Japan Lecithin Market
- 16.6.1. Country Segmental Analysis
- 16.6.2. Source
- 16.6.3. Form
- 16.6.4. Nature
- 16.6.5. Phospholipid Content
- 16.6.6. Processing Method
- 16.6.7. Distribution Channel
- 16.6.8. End-use Industry
- 16.7. South Korea Lecithin Market
- 16.7.1. Country Segmental Analysis
- 16.7.2. Source
- 16.7.3. Form
- 16.7.4. Nature
- 16.7.5. Phospholipid Content
- 16.7.6. Processing Method
- 16.7.7. Distribution Channel
- 16.7.8. End-use Industry
- 16.8. Australia and New Zealand Lecithin Market
- 16.8.1. Country Segmental Analysis
- 16.8.2. Source
- 16.8.3. Form
- 16.8.4. Nature
- 16.8.5. Phospholipid Content
- 16.8.6. Processing Method
- 16.8.7. Distribution Channel
- 16.8.8. End-use Industry
- 16.9. Indonesia Lecithin Market
- 16.9.1. Country Segmental Analysis
- 16.9.2. Source
- 16.9.3. Form
- 16.9.4. Nature
- 16.9.5. Phospholipid Content
- 16.9.6. Processing Method
- 16.9.7. Distribution Channel
- 16.9.8. End-use Industry
- 16.10. Malaysia Lecithin Market
- 16.10.1. Country Segmental Analysis
- 16.10.2. Source
- 16.10.3. Form
- 16.10.4. Nature
- 16.10.5. Phospholipid Content
- 16.10.6. Processing Method
- 16.10.7. Distribution Channel
- 16.10.8. End-use Industry
- 16.11. Thailand Lecithin Market
- 16.11.1. Country Segmental Analysis
- 16.11.2. Source
- 16.11.3. Form
- 16.11.4. Nature
- 16.11.5. Phospholipid Content
- 16.11.6. Processing Method
- 16.11.7. Distribution Channel
- 16.11.8. End-use Industry
- 16.12. Vietnam Lecithin Market
- 16.12.1. Country Segmental Analysis
- 16.12.2. Source
- 16.12.3. Form
- 16.12.4. Nature
- 16.12.5. Phospholipid Content
- 16.12.6. Processing Method
- 16.12.7. Distribution Channel
- 16.12.8. End-use Industry
- 16.13. Rest of Asia Pacific Lecithin Market
- 16.13.1. Country Segmental Analysis
- 16.13.2. Source
- 16.13.3. Form
- 16.13.4. Nature
- 16.13.5. Phospholipid Content
- 16.13.6. Processing Method
- 16.13.7. Distribution Channel
- 16.13.8. End-use Industry
- 17. Middle East Lecithin Market Analysis
- 17.1. Key Segment Analysis
- 17.2. Regional Snapshot
- 17.3. Middle East Lecithin Market Size (Volume - Tons and Value - US$ Bn), Analysis, and Forecasts, 2021-2035
- 17.3.1. Source
- 17.3.2. Form
- 17.3.3. Nature
- 17.3.4. Phospholipid Content
- 17.3.5. Processing Method
- 17.3.6. Distribution Channel
- 17.3.7. End-use Industry
- 17.3.8. Country
- 17.3.8.1. Turkey
- 17.3.8.2. UAE
- 17.3.8.3. Saudi Arabia
- 17.3.8.4. Israel
- 17.3.8.5. Rest of Middle East
- 17.4. Turkey Lecithin Market
- 17.4.1. Country Segmental Analysis
- 17.4.2. Source
- 17.4.3. Form
- 17.4.4. Nature
- 17.4.5. Phospholipid Content
- 17.4.6. Processing Method
- 17.4.7. Distribution Channel
- 17.4.8. End-use Industry
- 17.5. UAE Lecithin Market
- 17.5.1. Country Segmental Analysis
- 17.5.2. Source
- 17.5.3. Form
- 17.5.4. Nature
- 17.5.5. Phospholipid Content
- 17.5.6. Processing Method
- 17.5.7. Distribution Channel
- 17.5.8. End-use Industry
- 17.6. Saudi Arabia Lecithin Market
- 17.6.1. Country Segmental Analysis
- 17.6.2. Source
- 17.6.3. Form
- 17.6.4. Nature
- 17.6.5. Phospholipid Content
- 17.6.6. Processing Method
- 17.6.7. Distribution Channel
- 17.6.8. End-use Industry
- 17.7. Israel Lecithin Market
- 17.7.1. Country Segmental Analysis
- 17.7.2. Source
- 17.7.3. Form
- 17.7.4. Nature
- 17.7.5. Phospholipid Content
- 17.7.6. Processing Method
- 17.7.7. Distribution Channel
- 17.7.8. End-use Industry
- 17.8. Rest of Middle East Lecithin Market
- 17.8.1. Country Segmental Analysis
- 17.8.2. Source
- 17.8.3. Form
- 17.8.4. Nature
- 17.8.5. Phospholipid Content
- 17.8.6. Processing Method
- 17.8.7. Distribution Channel
- 17.8.8. End-use Industry
- 18. Africa Lecithin Market Analysis
- 18.1. Key Segment Analysis
- 18.2. Regional Snapshot
- 18.3. Africa Lecithin Market Size (Volume - Tons and Value - US$ Bn), Analysis, and Forecasts, 2021-2035
- 18.3.1. Source
- 18.3.2. Form
- 18.3.3. Nature
- 18.3.4. Phospholipid Content
- 18.3.5. Processing Method
- 18.3.6. Distribution Channel
- 18.3.7. End-use Industry
- 18.3.8. Country
- 18.3.8.1. South Africa
- 18.3.8.2. Egypt
- 18.3.8.3. Nigeria
- 18.3.8.4. Algeria
- 18.3.8.5. Rest of Africa
- 18.4. South Africa Lecithin Market
- 18.4.1. Country Segmental Analysis
- 18.4.2. Source
- 18.4.3. Form
- 18.4.4. Nature
- 18.4.5. Phospholipid Content
- 18.4.6. Processing Method
- 18.4.7. Distribution Channel
- 18.4.8. End-use Industry
- 18.5. Egypt Lecithin Market
- 18.5.1. Country Segmental Analysis
- 18.5.2. Source
- 18.5.3. Form
- 18.5.4. Nature
- 18.5.5. Phospholipid Content
- 18.5.6. Processing Method
- 18.5.7. Distribution Channel
- 18.5.8. End-use Industry
- 18.6. Nigeria Lecithin Market
- 18.6.1. Country Segmental Analysis
- 18.6.2. Source
- 18.6.3. Form
- 18.6.4. Nature
- 18.6.5. Phospholipid Content
- 18.6.6. Processing Method
- 18.6.7. Distribution Channel
- 18.6.8. End-use Industry
- 18.7. Algeria Lecithin Market
- 18.7.1. Country Segmental Analysis
- 18.7.2. Source
- 18.7.3. Form
- 18.7.4. Nature
- 18.7.5. Phospholipid Content
- 18.7.6. Processing Method
- 18.7.7. Distribution Channel
- 18.7.8. End-use Industry
- 18.8. Rest of Africa Lecithin Market
- 18.8.1. Country Segmental Analysis
- 18.8.2. Source
- 18.8.3. Form
- 18.8.4. Nature
- 18.8.5. Phospholipid Content
- 18.8.6. Processing Method
- 18.8.7. Distribution Channel
- 18.8.8. End-use Industry
- 19. South America Lecithin Market Analysis
- 19.1. Key Segment Analysis
- 19.2. Regional Snapshot
- 19.3. South America Lecithin Market Size (Volume - Tons and Value - US$ Bn), Analysis, and Forecasts, 2021-2035
- 19.3.1. Source
- 19.3.2. Form
- 19.3.3. Nature
- 19.3.4. Phospholipid Content
- 19.3.5. Processing Method
- 19.3.6. Distribution Channel
- 19.3.7. End-use Industry
- 19.3.8. Country
- 19.3.8.1. Brazil
- 19.3.8.2. Argentina
- 19.3.8.3. Rest of South America
- 19.4. Brazil Lecithin Market
- 19.4.1. Country Segmental Analysis
- 19.4.2. Source
- 19.4.3. Form
- 19.4.4. Nature
- 19.4.5. Phospholipid Content
- 19.4.6. Processing Method
- 19.4.7. Distribution Channel
- 19.4.8. End-use Industry
- 19.5. Argentina Lecithin Market
- 19.5.1. Country Segmental Analysis
- 19.5.2. Source
- 19.5.3. Form
- 19.5.4. Nature
- 19.5.5. Phospholipid Content
- 19.5.6. Processing Method
- 19.5.7. Distribution Channel
- 19.5.8. End-use Industry
- 19.6. Rest of South America Lecithin Market
- 19.6.1. Country Segmental Analysis
- 19.6.2. Source
- 19.6.3. Form
- 19.6.4. Nature
- 19.6.5. Phospholipid Content
- 19.6.6. Processing Method
- 19.6.7. Distribution Channel
- 19.6.8. End-use Industry
- 20. Key Players/ Company Profile
- 20.1. American Lecithin Company
- 20.1.1. Company Details/ Overview
- 20.1.2. Company Financials
- 20.1.3. Key Customers and Competitors
- 20.1.4. Business/ Industry Portfolio
- 20.1.5. Product Portfolio/ Specification Details
- 20.1.6. Pricing Data
- 20.1.7. Strategic Overview
- 20.1.8. Recent Developments
- 20.2. Amitex Agro Product Pvt. Ltd.
- 20.3. Archer Daniels Midland Company (ADM)
- 20.4. Austrade Inc.
- 20.5. Avanti Polar Lipids Inc.
- 20.6. Bunge Limited
- 20.7. Bunge Loders Croklaan
- 20.8. Cargill Incorporated
- 20.9. Clarkson Soy Products
- 20.10. Denofa AS
- 20.11. Lasenor Emul S.L.
- 20.12. Lecico GmbH
- 20.13. Lecital (Avril Group)
- 20.14. Lipoid GmbH
- 20.15. Novastell Essential Ingredients
- 20.16. Ruchi Soya Industries Limited
- 20.17. Shankar Soya Concepts
- 20.18. Sonic Biochem Extractions Pvt. Ltd.
- 20.19. Stern-Wywiol Gruppe
- 20.20. VAV Life Sciences Pvt. Ltd.
- 20.21. Wilmar International Limited
- 20.22. Other Key Players
- 20.1. American Lecithin Company
Note* - This is just tentative list of players. While providing the report, we will cover more number of players based on their revenue and share for each geography
Research Design
Our research design integrates both demand-side and supply-side analysis through a balanced combination of primary and secondary research methodologies. By utilizing both bottom-up and top-down approaches alongside rigorous data triangulation methods, we deliver robust market intelligence that supports strategic decision-making.
MarketGenics' comprehensive research design framework ensures the delivery of accurate, reliable, and actionable market intelligence. Through the integration of multiple research approaches, rigorous validation processes, and expert analysis, we provide our clients with the insights needed to make informed strategic decisions and capitalize on market opportunities.

MarketGenics leverages a dedicated industry panel of experts and a comprehensive suite of paid databases to effectively collect, consolidate, and analyze market intelligence.
Our approach has consistently proven to be reliable and effective in generating accurate market insights, identifying key industry trends, and uncovering emerging business opportunities.
Through both primary and secondary research, we capture and analyze critical company-level data such as manufacturing footprints, including technical centers, R&D facilities, sales offices, and headquarters.
Our expert panel further enhances our ability to estimate market size for specific brands based on validated field-level intelligence.
Our data mining techniques incorporate both parametric and non-parametric methods, allowing for structured data collection, sorting, processing, and cleaning.
Demand projections are derived from large-scale data sets analyzed through proprietary algorithms, culminating in robust and reliable market sizing.
Research Approach
The bottom-up approach builds market estimates by starting with the smallest addressable market units and systematically aggregating them to create comprehensive market size projections.
This method begins with specific, granular data points and builds upward to create the complete market landscape.
Customer Analysis → Segmental Analysis → Geographical Analysis
The top-down approach starts with the broadest possible market data and systematically narrows it down through a series of filters and assumptions to arrive at specific market segments or opportunities.
This method begins with the big picture and works downward to increasingly specific market slices.
TAM → SAM → SOM


Research Methods
Desk / Secondary Research
While analysing the market, we extensively study secondary sources, directories, and databases to identify and collect information useful for this technical, market-oriented, and commercial report. Secondary sources that we utilize are not only the public sources, but it is a combination of Open Source, Associations, Paid Databases, MG Repository & Knowledgebase, and others.
- Company websites, annual reports, financial reports, broker reports, and investor presentations
- National government documents, statistical databases and reports
- News articles, press releases and web-casts specific to the companies operating in the market, Magazines, reports, and others
- We gather information from commercial data sources for deriving company specific data such as segmental revenue, share for geography, product revenue, and others
- Internal and external proprietary databases (industry-specific), relevant patent, and regulatory databases
- Governing Bodies, Government Organizations
- Relevant Authorities, Country-specific Associations for Industries
We also employ the model mapping approach to estimate the product level market data through the players' product portfolio
Primary Research
Primary research/ interviews is vital in analyzing the market. Most of the cases involves paid primary interviews. Primary sources include primary interviews through e-mail interactions, telephonic interviews, surveys as well as face-to-face interviews with the different stakeholders across the value chain including several industry experts.
| Type of Respondents | Number of Primaries |
|---|---|
| Tier 2/3 Suppliers | ~20 |
| Tier 1 Suppliers | ~25 |
| End-users | ~25 |
| Industry Expert/ Panel/ Consultant | ~30 |
| Total | ~100 |
MG Knowledgebase
• Repository of industry blog, newsletter and case studies
• Online platform covering detailed market reports, and company profiles
Forecasting Factors and Models
Forecasting Factors
- Historical Trends – Past market patterns, cycles, and major events that shaped how markets behave over time. Understanding past trends helps predict future behavior.
- Industry Factors – Specific characteristics of the industry like structure, regulations, and innovation cycles that affect market dynamics.
- Macroeconomic Factors – Economic conditions like GDP growth, inflation, and employment rates that affect how much money people have to spend.
- Demographic Factors – Population characteristics like age, income, and location that determine who can buy your product.
- Technology Factors – How quickly people adopt new technology and how much technology infrastructure exists.
- Regulatory Factors – Government rules, laws, and policies that can help or restrict market growth.
- Competitive Factors – Analyzing competition structure such as degree of competition and bargaining power of buyers and suppliers.
Forecasting Models / Techniques
Multiple Regression Analysis
- Identify and quantify factors that drive market changes
- Statistical modeling to establish relationships between market drivers and outcomes
Time Series Analysis – Seasonal Patterns
- Understand regular cyclical patterns in market demand
- Advanced statistical techniques to separate trend, seasonal, and irregular components
Time Series Analysis – Trend Analysis
- Identify underlying market growth patterns and momentum
- Statistical analysis of historical data to project future trends
Expert Opinion – Expert Interviews
- Gather deep industry insights and contextual understanding
- In-depth interviews with key industry stakeholders
Multi-Scenario Development
- Prepare for uncertainty by modeling different possible futures
- Creating optimistic, pessimistic, and most likely scenarios
Time Series Analysis – Moving Averages
- Sophisticated forecasting for complex time series data
- Auto-regressive integrated moving average models with seasonal components
Econometric Models
- Apply economic theory to market forecasting
- Sophisticated economic models that account for market interactions
Expert Opinion – Delphi Method
- Harness collective wisdom of industry experts
- Structured, multi-round expert consultation process
Monte Carlo Simulation
- Quantify uncertainty and probability distributions
- Thousands of simulations with varying input parameters
Research Analysis
Our research framework is built upon the fundamental principle of validating market intelligence from both demand and supply perspectives. This dual-sided approach ensures comprehensive market understanding and reduces the risk of single-source bias.
Demand-Side Analysis: We understand end-user/application behavior, preferences, and market needs along with the penetration of the product for specific application.
Supply-Side Analysis: We estimate overall market revenue, analyze the segmental share along with industry capacity, competitive landscape, and market structure.
Validation & Evaluation
Data triangulation is a validation technique that uses multiple methods, sources, or perspectives to examine the same research question, thereby increasing the credibility and reliability of research findings. In market research, triangulation serves as a quality assurance mechanism that helps identify and minimize bias, validate assumptions, and ensure accuracy in market estimates.
- Data Source Triangulation – Using multiple data sources to examine the same phenomenon
- Methodological Triangulation – Using multiple research methods to study the same research question
- Investigator Triangulation – Using multiple researchers or analysts to examine the same data
- Theoretical Triangulation – Using multiple theoretical perspectives to interpret the same data

Custom Market Research Services
We will customise the research for you, in case the report listed above does not meet your requirements.
Get 10% Free Customisation