Smart Agriculture Market Size, Share & Trends Analysis Report by Component (Hardware, Software, Services), Technology, Farm Type, Connectivity Type, Deployment Mode, Application, End User, and Geography (North America, Europe, Asia Pacific, Middle East, Africa, and South America) – Global Industry Data, Trends, and Forecasts, 2026–2035
Market Overview:
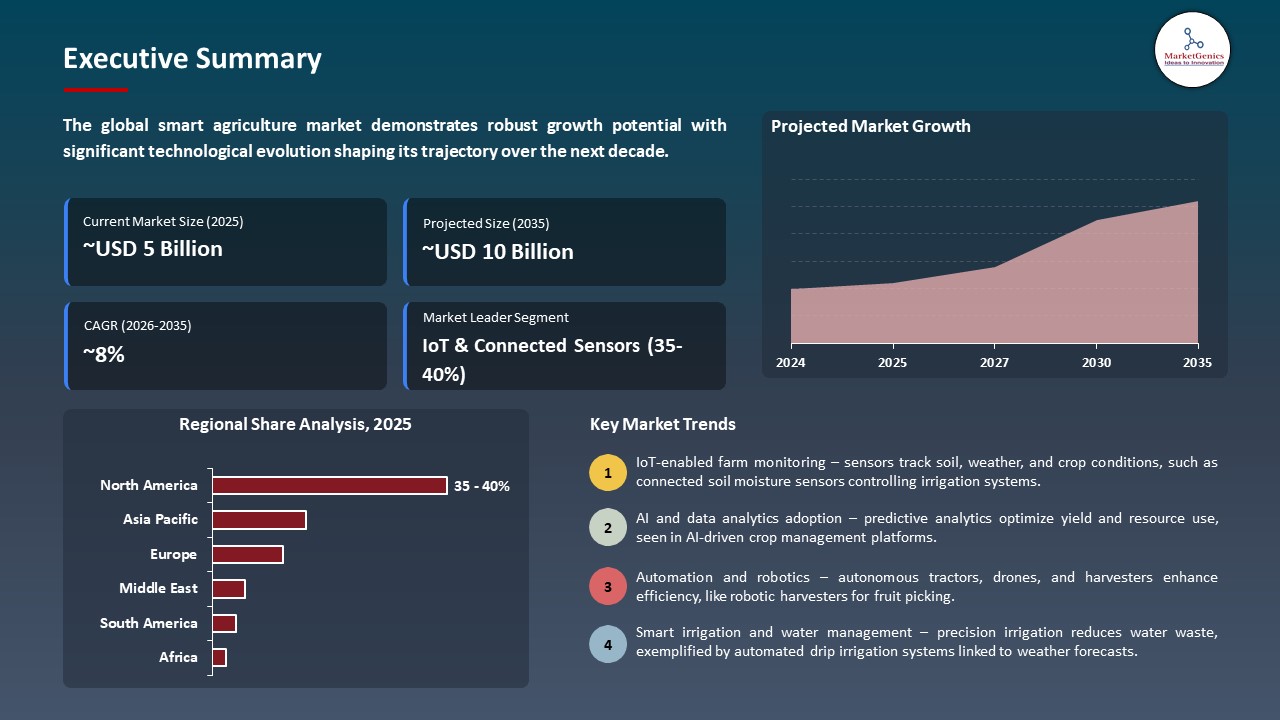
According to MarketGenics analysis only, the global smart agriculture market is witnessing strong growth, with an estimated valuation of USD 4.5 billion in 2025 and projected to reach USD 9.6 billion by 2035, expanding at a CAGR of 7.9% during the forecast period.
|
|
|
Segmental Data Insights |
|
|
Demand Trends |
|
|
Competitive Landscape |
|
|
Strategic Development |
|
|
Future Outlook & Opportunities |
|
Smart Agriculture Market Size, Share, and Growth
Smart-agriculture-market is an autonomous system powered by AI and adaptive sensors and real-time data analytics that enhance monitoring of crops, efficient resource application, and quick adaptation to environmental changes and decrease reliance on labor and risks associated with operations on farms.
Jerred Pauwels, vice president, earthmoving production systems & engineering, John Deere, said, Our mission is to help our customers maximize their productivity and profitability, especially when it comes to incorporating valuable technology solutions into their equipment fleets. Our partnership with Trimble presents a tremendous opportunity for our customers to access Trimble's advanced technology ecosystem. Paired with the power and performance of the John Deere construction equipment line-up with SmartGrade, our customers will be able to make productivity gains, at the jobsite and beyond.
The smart agriculture market is changing fast and connected and autonomous farm technologies are becoming more and more popular to improve productiveness and decrease resource usage as well as to bring about data-driven decisions. Autonomous machines, artificial intelligence-driven crop sensors, and precision farming sites are transforming the management of farms, enabling large-scale agriculture to survey land as well as soil, water, and crop conditions, with minimum human involvement and minimum risk of operational injury.
More sophisticated technology like IoT sensors, edge computing, drone-assisted imaging, and predictive analytics, helps to monitor environmental and crop parameters in real-time. With automated, location-based interventions, yield quality and resource efficiency are enhanced with Smart irrigation, nutrient management, and pest detection systems. Crop performance, agricultural planting jump scheduling, and post-harvest losses are being prognosticated using machine learning models, including high-resolution satellite and drone data.
The adjacent market opportunities are robotic weeding, autonomous harvesting platform, farm to market supply chain integration and AI-based decision support system. These innovations boost operational scalability and lower the input costs and increase the sustainability metrics. Smart Agriculture is evolving into a vital facilitator of sustainable, productive, and accurate agricultural activities on the global scale due to the growth in the implementation of modular, interoperable systems and cloud-based farm management platforms.
 Smart Agriculture Market Dynamics and Trends
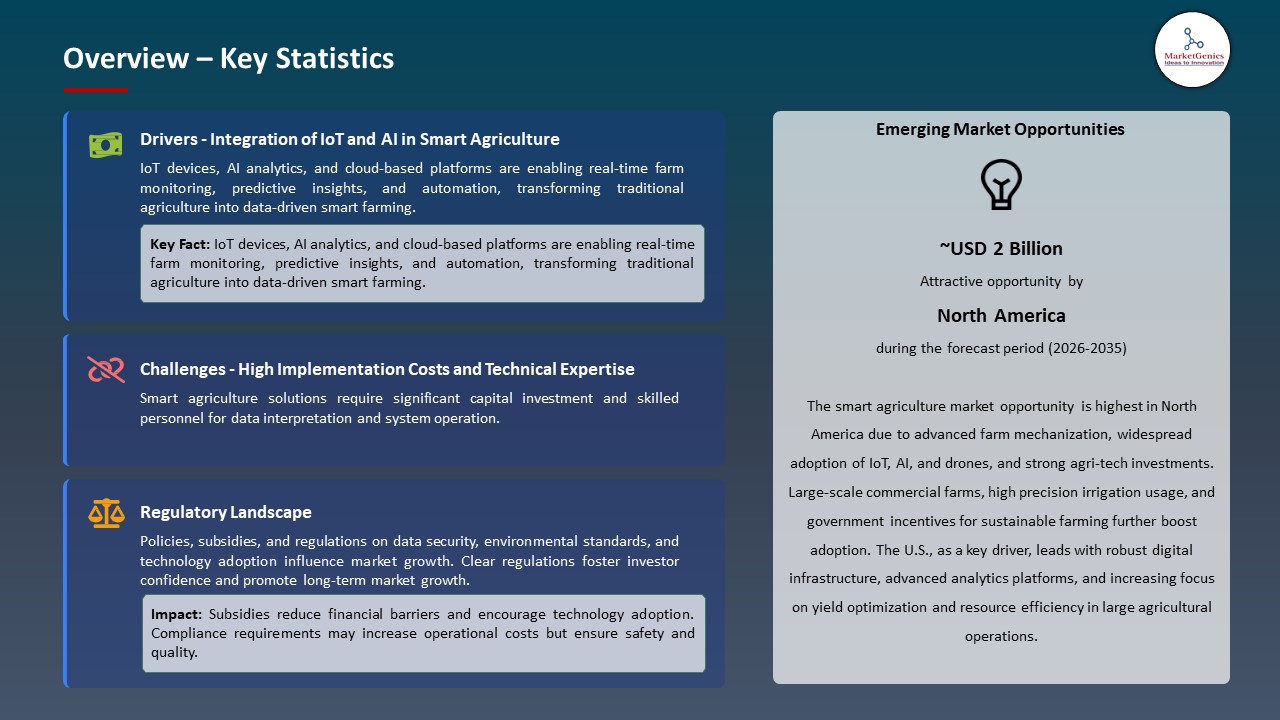
Driver: Rising Global Food Demand & Efficiency Needs
-
The growing populations of the world and the declining arable land volume are compelling the utilization of smart farming technologies as farmers and agribusinesses look into how to achieve maximum crop yields, the optimal utilization of inputs, and how to produce foods sustainably without necessarily increasing land use.
- More sophisticated farming systems are becoming common place, and sophisticated systems are capable of performing complicated farming tasks such as planting on a specific position, applying fertilizer on the specific plant, and harvesting with an autonomous system. For instance, in 2025, AGCO presented its Fendt Xaver autonomous seeding robots, which can navigate autonomously with artificial intelligence and analyze soil in real-time and showed high efficiency in large scales and accurate crop control.
- Smart agriculture technologies are improving the real-time monitoring in the fields, the management of the resources, and efficiency of the operations, which allow farms to satisfy the growing food demand in the shortest possible waste.
Restraint: High Initial Investment and Infrastructure Barriers
-
The prohibitive nature of implementing advanced smart agriculture solutions is also one of the main limitations, because AI-enabled farm equipment, IoT sensor networks, edge computing devices, and integrated software platforms require much higher investment in capital than regular farming equipment.
- Ongoing expenses include data analytics subscriptions, cloud storage, software updates and operator training that contributes to the financial heavy load. Indicatively, autonomous machinery and IoT sensors complete connected on a farm can be costly millions every year, which restricts its use to large agribusinesses.
- Rural broadband is limited, specialized technical skills, and infrastructure are further inhibitory to large-scale deployment, particularly in the emerging markets.
Opportunity: Expansion of AI-Driven Farm Analytics
-
The expansion of AI-driven farm analytics platforms integrating soil sensors, satellite imagery, weather data, and connected farm equipment is creating strong opportunities in the global smart agriculture market by enabling predictive insights for yield optimization, risk management, and resource efficiency.
- Advanced machine-learning analytics enable real-time, field-level decision-making in smart farming. AI-powered farm analytics are enabling faster decisions, scalable adoption across farm sizes, and improved economic outcomes, strengthening their role as a key growth opportunity in smart agriculture globally.
Key Trend: Integration of IoT, AI, and Connected Systems
-
The growth of AI-based farm analytics systems, including soil sensors, satellite imagery, weather, and connected farm machinery, is proving to be a good opportunity in the global smart agriculture market through the ability to provide predictive analytics to optimize yield, reduce risk, and achieve efficiency.
- Machine-learning analytics can be advanced to facilitate decision-making in real-time, down to the field, with smart farming. For instance, Bayer Crop Science upgraded its Climate FieldView platform by including satellite data, in-field sensors and historical yield data to provide predictive data on crop stress, yield variability, and input optimization, which supports the importance of AI-based farm analytics.
- Farm analytics powered by AI are facilitating faster decision-making, scalable to farms of any size, and better financial results, which are empowering its use as a major growth opportunity in the smart agriculture market across the globe.
Smart Agriculture Market Analysis and Segmental Data
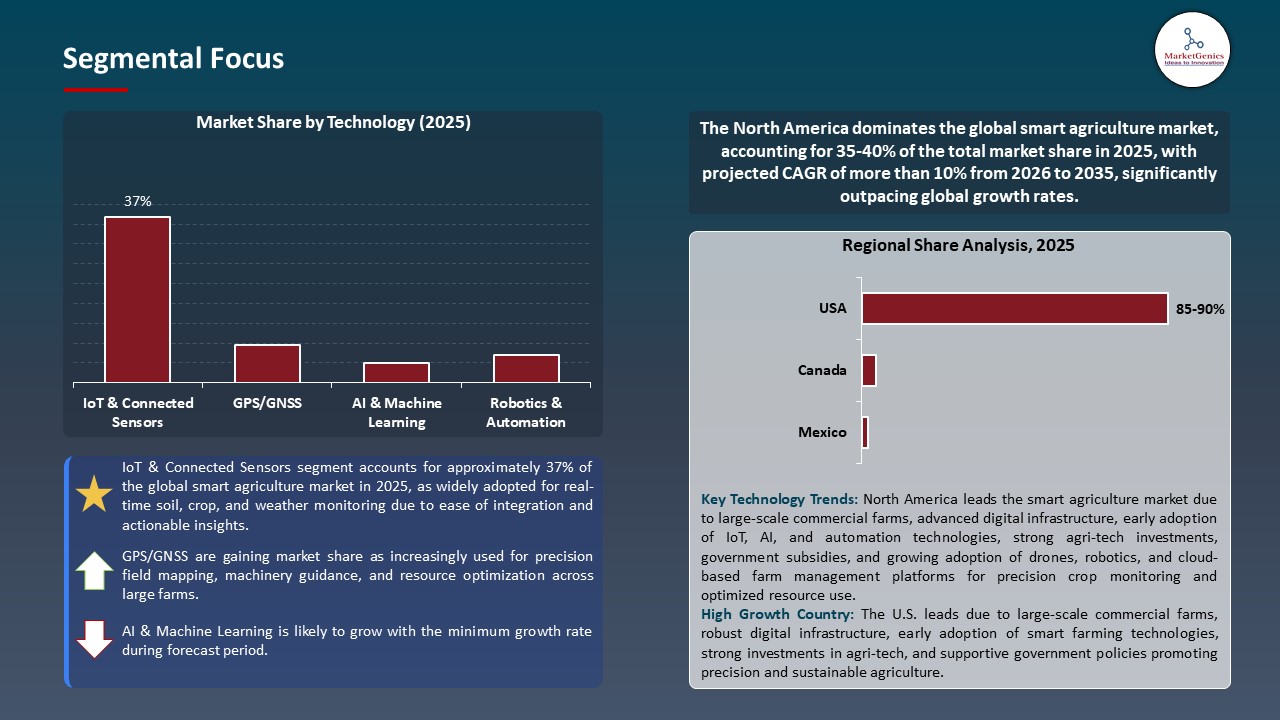
IoT & Connected Sensors Dominate Global Smart Agriculture Market
-
Agritech solution providers, farm equipment manufacturers and digital platform companies are enhancing the smart agriculture market worldwide by investing in IoT ecosystems that are ready to operate with AI and integrate field sensors, autonomous equipment, cloud and decision-support applications in crop and soil management processes.
- Platform interoperability and modular digital architectures are enhancing performance as it enables real-time information exchange and AI-based automation. For instance, in March 2025, ARB IoT Group Limited released a smart agricultural robot that used AI to combine IoT sensors and machine learning to perform precision fertilization, autonomous field operations, and real-time monitoring of soil and crops, and proved to increase efficiency in precision farming.
- The modular systems and standards offer faster upgrades, global deployment, and compatibility of high military robotic systems.
North America Leads Global Smart Agriculture Market Demand
- North America is dominates the globe smart agriculture market, as the governments of the U.S. and Canada, as well as the major agritech corporations are speeding up implementation of AI-powered autonomous tractors, precision drones, and IoT-connected field surveillance systems to streamline crop management and conserve resources, as well as to enhance agricultural production that is climate resilient.
- Autonomous farm technology has developed recently, with high demand in the region. For instance, in September 2025, Deere and Company collaborated with Microsoft and Trimble to launch a cloud-connected autonomous artificial intelligence platform to combine autonomous tractors, field sensors, and aerial imagery to offer real-time crop diagnostics and automated decision support to crops in multi-state commercial farms.
- Intense R&D, agritech partnerships, and digitalization support the fact that the North American market is the biggest smart farming market across the globe.
Smart Agriculture Market Ecosystem
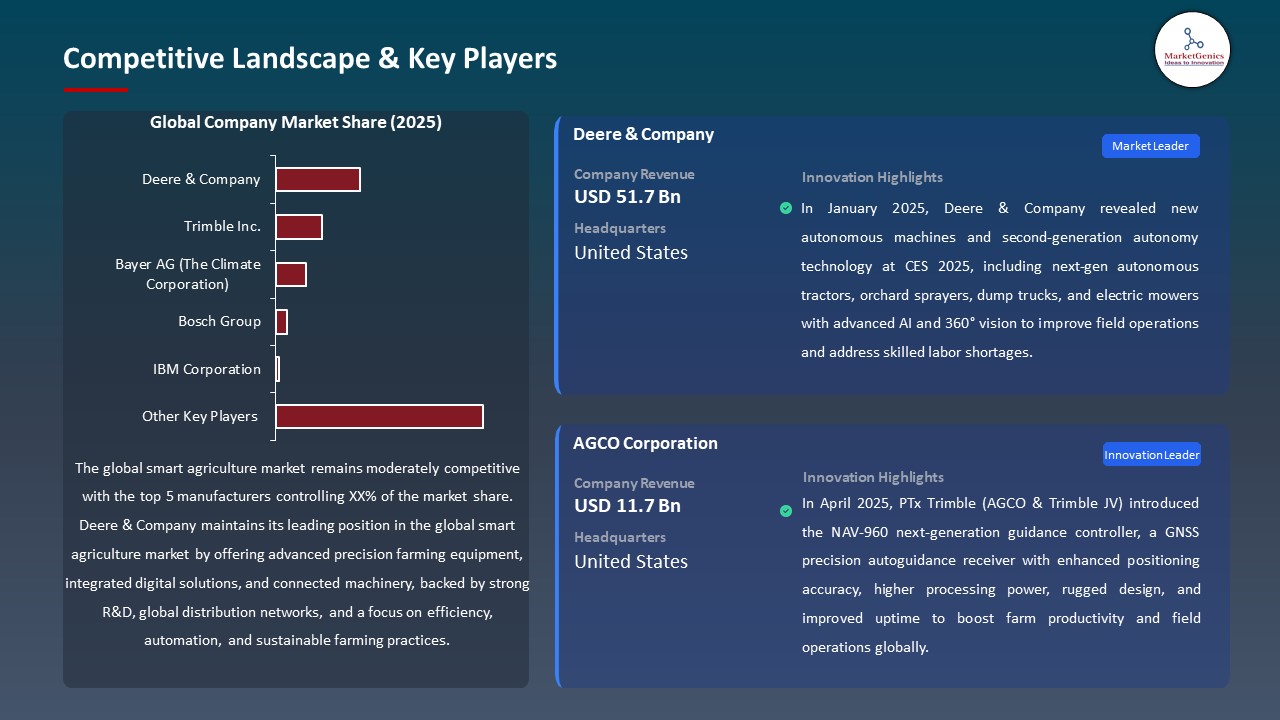
The smart agricultural market is moderately consolidated, and the intensity of rivalry focuses on precision farming platforms, AI-driven analytics, connected machinery, and multi-source agricultural data integration. The presence of Deere & Company, Trimble Inc., Bayer AG (The Climate Corporation), Bosch Group, and IBM Corporation have a substantial market share through the provision of end-to-end digital agriculture ecosystems that include automation with farm machinery, sensors, decision-support software, and crop intelligence guided by information in crop production, livestock management, and supply chain operations.
High-value and specialized smart farming solutions are underlined in these firms in order to ensure technological leadership. Deere & Company are evolving autonomous and semi-autonomous tractors, accurate planting, and AI-enabled equipment insight administration; Trimble Inc. is promoting GPS-directed automation, mapping of fields, and field management programming to make use of operational efficiency; Bayer AG (The Climate Corporation) concentrates on advanced digital agronomy, combining weather analytics, field-level crop programming, and predictive decision support; Bosch Group is adding through IoT sensors, smart irrigation controls, and connected agricultural infrastructure; and IBM Corporation is reinforced as the ecosystem provider by autonomous movement of
Government-backed efforts to digitize agriculture, sustainability-based agriculture policies, and government-business collaborations with research organizations and agri-technology startups have led to an upward acceleration of the process of innovation in the field of precision agriculture, autonomous agricultural systems, predictive analytics, and climate-resilient agricultural practices. Such ecosystems dynamics increase competitive differentiation, scale technological deployment, and fast implementation of smart farming solutions, which place the global smart agriculture market to meet the growing food demand, resource-efficiency and sustainable agricultural production needs.
 Recent Development and Strategic Overview
-
In February 2025, The Thai government and the National Electronics and Computer Technology Centre (NECTEC) introduced the AI- and IoT-based digital farming platform, which can assist farmers in monitoring and controlling farms more effectively. The platform is based on smart sensors, artificial intelligence (AI) and Internet of Things (IoT) to achieve a better production sustainability, lowering of costs, and competitiveness in agriculture.
- In October 2025, SBI Foundation, the CSR arm of the State Bank of India, partnered with the University of Agricultural Sciences (UAS), Raichur, International Crops Research Institute for the Semi-Arid Tropics (ICRISAT), and Agribridge to launch the SMART-CROP (Sustainable Monitoring and Real-time Tracking for Crop Resilience and Optimal Practices) project in Hyderabad.
Report Scope
|
Detail |
|
|
Market Size in 2025 |
USD 4.5 Bn |
|
Market Forecast Value in 2035 |
USD 9.6 Bn |
|
Growth Rate (CAGR) |
7.9% |
|
Forecast Period |
2026 – 2035 |
|
Historical Data Available for |
2021 – 2024 |
|
Market Size Units |
US$ Billion for Value |
|
Report Format |
Electronic (PDF) + Excel |
|
North America |
Europe |
Asia Pacific |
Middle East |
Africa |
South America |
|
|
|
|
|
|
|
Companies Covered |
|||||
|
|
|
|
|
|
|
Smart Agriculture Market Segmentation and Highlights
|
Segment |
Sub-segment |
|
Smart Agriculture Market, By Component |
|
|
Smart Agriculture Market, By Technology |
|
|
Smart Agriculture Market, By Farm Type |
|
|
Smart Agriculture Market, By Connectivity Type |
|
|
Smart Agriculture Market, By Deployment Mode |
|
|
Smart Agriculture Market, By Application |
|
|
Smart Agriculture Market, By End User |
|
Frequently Asked Questions
Table of Contents
- 1. Research Methodology and Assumptions
- 1.1. Definitions
- 1.2. Research Design and Approach
- 1.3. Data Collection Methods
- 1.4. Base Estimates and Calculations
- 1.5. Forecasting Models
- 1.5.1. Key Forecast Factors & Impact Analysis
- 1.6. Secondary Research
- 1.6.1. Open Sources
- 1.6.2. Paid Databases
- 1.6.3. Associations
- 1.7. Primary Research
- 1.7.1. Primary Sources
- 1.7.2. Primary Interviews with Stakeholders across Ecosystem
- 2. Executive Summary
- 2.1. Global Smart Agriculture Market Outlook
- 2.1.1. Smart Agriculture Market Size (Value - US$ Bn), and Forecasts, 2021-2035
- 2.1.2. Compounded Annual Growth Rate Analysis
- 2.1.3. Growth Opportunity Analysis
- 2.1.4. Segmental Share Analysis
- 2.1.5. Geographical Share Analysis
- 2.2. Market Analysis and Facts
- 2.3. Supply-Demand Analysis
- 2.4. Competitive Benchmarking
- 2.5. Go-to- Market Strategy
- 2.5.1. Customer/ End-use Industry Assessment
- 2.5.2. Growth Opportunity Data, 2026-2035
- 2.5.2.1. Regional Data
- 2.5.2.2. Country Data
- 2.5.2.3. Segmental Data
- 2.5.3. Identification of Potential Market Spaces
- 2.5.4. GAP Analysis
- 2.5.5. Potential Attractive Price Points
- 2.5.6. Prevailing Market Risks & Challenges
- 2.5.7. Preferred Sales & Marketing Strategies
- 2.5.8. Key Recommendations and Analysis
- 2.5.9. A Way Forward
- 2.1. Global Smart Agriculture Market Outlook
- 3. Industry Data and Premium Insights
- 3.1. Global Agriculture Industry Overview, 2025
- 3.1.1. Agriculture Industry Ecosystem Analysis
- 3.1.2. Key Trends for Agriculture Industry
- 3.1.3. Regional Distribution for Agriculture Industry
- 3.2. Supplier Customer Data
- 3.3. Technology Roadmap and Developments
- 3.4. Trade Analysis
- 3.4.1. Import & Export Analysis, 2025
- 3.4.2. Top Importing Countries
- 3.4.3. Top Exporting Countries
- 3.5. Trump Tariff Impact Analysis
- 3.5.1. Manufacturer
- 3.5.1.1. Based on the component & Raw material
- 3.5.2. Supply Chain
- 3.5.3. End Consumer
- 3.5.1. Manufacturer
- 3.6. Raw Material Analysis
- 3.1. Global Agriculture Industry Overview, 2025
- 4. Market Overview
- 4.1. Market Dynamics
- 4.1.1. Drivers
- 4.1.1.1. Rising demand for data-driven farming to optimize resource use and improve crop productivity.
- 4.1.1.2. Increased adoption of IoT, AI, and cloud-based platforms for real-time farm monitoring and automation.
- 4.1.1.3. Growing pressure to ensure food security and sustainable agricultural practices under climate variability.
- 4.1.2. Restraints
- 4.1.2.1. High capital expenditure and integration complexity of smart farming technologies.
- 4.1.2.2. Limited connectivity infrastructure and technical skills in rural and developing regions.
- 4.1.1. Drivers
- 4.2. Key Trend Analysis
- 4.3. Regulatory Framework
- 4.3.1. Key Regulations, Norms, and Subsidies, by Key Countries
- 4.3.2. Tariffs and Standards
- 4.3.3. Impact Analysis of Regulations on the Market
- 4.4. Value Chain Analysis
- 4.4.1. Component Suppliers
- 4.4.2. Manufacturers
- 4.4.3. Dealers/ Distributors
- 4.4.4. End-Users/ Customers
- 4.5. Porter’s Five Forces Analysis
- 4.6. PESTEL Analysis
- 4.7. Global Smart Agriculture Market Demand
- 4.7.1. Historical Market Size – Value (US$ Bn), 2020-2024
- 4.7.2. Current and Future Market Size – Value (US$ Bn), 2026–2035
- 4.7.2.1. Y-o-Y Growth Trends
- 4.7.2.2. Absolute $ Opportunity Assessment
- 4.1. Market Dynamics
- 5. Competition Landscape
- 5.1. Competition structure
- 5.1.1. Fragmented v/s consolidated
- 5.2. Company Share Analysis, 2025
- 5.2.1. Global Company Market Share
- 5.2.2. By Region
- 5.2.2.1. North America
- 5.2.2.2. Europe
- 5.2.2.3. Asia Pacific
- 5.2.2.4. Middle East
- 5.2.2.5. Africa
- 5.2.2.6. South America
- 5.3. Product Comparison Matrix
- 5.3.1. Specifications
- 5.3.2. Market Positioning
- 5.3.3. Pricing
- 5.1. Competition structure
- 6. Global Smart Agriculture Market Analysis, by Component
- 6.1. Key Segment Analysis
- 6.2. Smart Agriculture Market Size (Value - US$ Bn), Analysis, and Forecasts, by Component, 2021-2035
- 6.2.1. Hardware
- 6.2.1.1. Sensors (Soil, Crop, Weather)
- 6.2.1.2. GPS/GNSS Devices
- 6.2.1.3. Drones/UAVs
- 6.2.1.4. Robotics & Autonomous Machines
- 6.2.1.5. Cameras & Imaging Systems
- 6.2.1.6. Telematics Devices
- 6.2.1.7. Others
- 6.2.2. Software
- 6.2.2.1. Farm Management Software
- 6.2.2.2. Data Analytics & Decision Support Software
- 6.2.2.3. Weather & Climate Software
- 6.2.2.4. Supply Chain & Traceability Software
- 6.2.2.5. Mobile & Remote Monitoring Apps
- 6.2.2.6. Others
- 6.2.3. Services
- 6.2.3.1. Consulting & Advisory
- 6.2.3.2. System Integration & Deployment
- 6.2.3.3. Support & Maintenance
- 6.2.3.4. Data Management & Analytics Services
- 6.2.3.5. Managed/Subscription Services
- 6.2.3.6. Others
- 6.2.1. Hardware
- 7. Global Smart Agriculture Market Analysis, by Technology
- 7.1. Key Segment Analysis
- 7.2. Smart Agriculture Market Size (Value - US$ Bn), Analysis, and Forecasts, by Technology, 2021-2035
- 7.2.1. IoT & Connected Sensors
- 7.2.2. GPS/GNSS
- 7.2.3. Robotics & Automation
- 7.2.4. AI & Machine Learning
- 7.2.5. Big Data Analytics
- 7.2.6. Cloud Computing
- 7.2.7. Drones/ UAVs
- 7.2.8. Blockchain
- 7.2.9. Others
- 8. Global Smart Agriculture Market Analysis, by Farm Type
- 8.1. Key Segment Analysis
- 8.2. Smart Agriculture Market Size (Value - US$ Bn), Analysis, and Forecasts, by Farm Type, 2021-2035
- 8.2.1. Open Field Farming
- 8.2.2. Greenhouse Farming
- 8.2.3. Indoor Farming
- 8.2.4. Aquaculture
- 8.2.5. Others
- 9. Global Smart Agriculture Market Analysis, by Connectivity Type
- 9.1. Key Segment Analysis
- 9.2. Smart Agriculture Market Size (Value - US$ Bn), Analysis, and Forecasts, by Connectivity Type, 2021-2035
- 9.2.1. Wired Connectivity
- 9.2.2. Wireless Connectivity
- 10. Global Smart Agriculture Market Analysis, by Deployment Mode
- 10.1. Key Segment Analysis
- 10.2. Smart Agriculture Market Size (Value - US$ Bn), Analysis, and Forecasts, by Deployment Mode, 2021-2035
- 10.2.1. On-Premise
- 10.2.2. Cloud
- 11. Global Smart Agriculture Market Analysis, by Application
- 11.1. Key Segment Analysis
- 11.2. Smart Agriculture Market Size (Value - US$ Bn), Analysis, and Forecasts, by Application, 2021-2035
- 11.2.1. Precision Farming
- 11.2.2. Livestock Monitoring & Management
- 11.2.3. Smart Greenhouse Automation
- 11.2.4. Aquaculture Management
- 11.2.5. Supply Chain Traceability
- 11.2.6. Irrigation Management
- 11.2.7. Crop Health Monitoring
- 11.2.8. Weather Forecasting & Alerts
- 11.2.9. Others
- 12. Global Smart Agriculture Market Analysis, by End User
- 12.1. Key Segment Analysis
- 12.2. Smart Agriculture Market Size (Value - US$ Bn), Analysis, and Forecasts, by End User, 2021-2035
- 12.2.1. Individual Farmers
- 12.2.2. Agricultural Enterprises
- 12.2.3. Government & Research Institutions
- 12.2.4. Agribusiness Companies
- 12.2.5. Cooperatives
- 12.2.6. Others
- 13. Global Smart Agriculture Market Analysis and Forecasts, by Region
- 13.1. Key Findings
- 13.2. Smart Agriculture Market Size (Value - US$ Bn), Analysis, and Forecasts, by Region, 2021-2035
- 13.2.1. North America
- 13.2.2. Europe
- 13.2.3. Asia Pacific
- 13.2.4. Middle East
- 13.2.5. Africa
- 13.2.6. South America
- 14. North America Smart Agriculture Market Analysis
- 14.1. Key Segment Analysis
- 14.2. Regional Snapshot
- 14.3. North America Smart Agriculture Market Size (Value - US$ Bn), Analysis, and Forecasts, 2021-2035
- 14.3.1. Component
- 14.3.2. Technology
- 14.3.3. Farm Type
- 14.3.4. Connectivity Type
- 14.3.5. Deployment Mode
- 14.3.6. Application
- 14.3.7. End User
- 14.3.8. Country
- 14.3.8.1. USA
- 14.3.8.2. Canada
- 14.3.8.3. Mexico
- 14.4. USA Smart Agriculture Market
- 14.4.1. Country Segmental Analysis
- 14.4.2. Component
- 14.4.3. Technology
- 14.4.4. Farm Type
- 14.4.5. Connectivity Type
- 14.4.6. Deployment Mode
- 14.4.7. Application
- 14.4.8. End User
- 14.5. Canada Smart Agriculture Market
- 14.5.1. Country Segmental Analysis
- 14.5.2. Component
- 14.5.3. Technology
- 14.5.4. Farm Type
- 14.5.5. Connectivity Type
- 14.5.6. Deployment Mode
- 14.5.7. Application
- 14.5.8. End User
- 14.6. Mexico Smart Agriculture Market
- 14.6.1. Country Segmental Analysis
- 14.6.2. Component
- 14.6.3. Technology
- 14.6.4. Farm Type
- 14.6.5. Connectivity Type
- 14.6.6. Deployment Mode
- 14.6.7. Application
- 14.6.8. End User
- 15. Europe Smart Agriculture Market Analysis
- 15.1. Key Segment Analysis
- 15.2. Regional Snapshot
- 15.3. Europe Smart Agriculture Market Size (Value - US$ Bn), Analysis, and Forecasts, 2021-2035
- 15.3.1. Component
- 15.3.2. Technology
- 15.3.3. Farm Type
- 15.3.4. Connectivity Type
- 15.3.5. Deployment Mode
- 15.3.6. Application
- 15.3.7. End User
- 15.3.8. Country
- 15.3.8.1. Germany
- 15.3.8.2. United Kingdom
- 15.3.8.3. France
- 15.3.8.4. Italy
- 15.3.8.5. Spain
- 15.3.8.6. Netherlands
- 15.3.8.7. Nordic Countries
- 15.3.8.8. Poland
- 15.3.8.9. Russia & CIS
- 15.3.8.10. Rest of Europe
- 15.4. Germany Smart Agriculture Market
- 15.4.1. Country Segmental Analysis
- 15.4.2. Component
- 15.4.3. Technology
- 15.4.4. Farm Type
- 15.4.5. Connectivity Type
- 15.4.6. Deployment Mode
- 15.4.7. Application
- 15.4.8. End User
- 15.5. United Kingdom Smart Agriculture Market
- 15.5.1. Country Segmental Analysis
- 15.5.2. Component
- 15.5.3. Technology
- 15.5.4. Farm Type
- 15.5.5. Connectivity Type
- 15.5.6. Deployment Mode
- 15.5.7. Application
- 15.5.8. End User
- 15.6. France Smart Agriculture Market
- 15.6.1. Country Segmental Analysis
- 15.6.2. Component
- 15.6.3. Technology
- 15.6.4. Farm Type
- 15.6.5. Connectivity Type
- 15.6.6. Deployment Mode
- 15.6.7. Application
- 15.6.8. End User
- 15.7. Italy Smart Agriculture Market
- 15.7.1. Country Segmental Analysis
- 15.7.2. Component
- 15.7.3. Technology
- 15.7.4. Farm Type
- 15.7.5. Connectivity Type
- 15.7.6. Deployment Mode
- 15.7.7. Application
- 15.7.8. End User
- 15.8. Spain Smart Agriculture Market
- 15.8.1. Country Segmental Analysis
- 15.8.2. Component
- 15.8.3. Technology
- 15.8.4. Farm Type
- 15.8.5. Connectivity Type
- 15.8.6. Deployment Mode
- 15.8.7. Application
- 15.8.8. End User
- 15.9. Netherlands Smart Agriculture Market
- 15.9.1. Country Segmental Analysis
- 15.9.2. Component
- 15.9.3. Technology
- 15.9.4. Farm Type
- 15.9.5. Connectivity Type
- 15.9.6. Deployment Mode
- 15.9.7. Application
- 15.9.8. End User
- 15.10. Nordic Countries Smart Agriculture Market
- 15.10.1. Country Segmental Analysis
- 15.10.2. Component
- 15.10.3. Technology
- 15.10.4. Farm Type
- 15.10.5. Connectivity Type
- 15.10.6. Deployment Mode
- 15.10.7. Application
- 15.10.8. End User
- 15.11. Poland Smart Agriculture Market
- 15.11.1. Country Segmental Analysis
- 15.11.2. Component
- 15.11.3. Technology
- 15.11.4. Farm Type
- 15.11.5. Connectivity Type
- 15.11.6. Deployment Mode
- 15.11.7. Application
- 15.11.8. End User
- 15.12. Russia & CIS Smart Agriculture Market
- 15.12.1. Country Segmental Analysis
- 15.12.2. Component
- 15.12.3. Technology
- 15.12.4. Farm Type
- 15.12.5. Connectivity Type
- 15.12.6. Deployment Mode
- 15.12.7. Application
- 15.12.8. End User
- 15.13. Rest of Europe Smart Agriculture Market
- 15.13.1. Country Segmental Analysis
- 15.13.2. Component
- 15.13.3. Technology
- 15.13.4. Farm Type
- 15.13.5. Connectivity Type
- 15.13.6. Deployment Mode
- 15.13.7. Application
- 15.13.8. End User
- 16. Asia Pacific Smart Agriculture Market Analysis
- 16.1. Key Segment Analysis
- 16.2. Regional Snapshot
- 16.3. Asia Pacific Smart Agriculture Market Size (Value - US$ Bn), Analysis, and Forecasts, 2021-2035
- 16.3.1. Component
- 16.3.2. Technology
- 16.3.3. Farm Type
- 16.3.4. Connectivity Type
- 16.3.5. Deployment Mode
- 16.3.6. Application
- 16.3.7. End User
- 16.3.8. Country
- 16.3.8.1. China
- 16.3.8.2. India
- 16.3.8.3. Japan
- 16.3.8.4. South Korea
- 16.3.8.5. Australia and New Zealand
- 16.3.8.6. Indonesia
- 16.3.8.7. Malaysia
- 16.3.8.8. Thailand
- 16.3.8.9. Vietnam
- 16.3.8.10. Rest of Asia Pacific
- 16.4. China Smart Agriculture Market
- 16.4.1. Country Segmental Analysis
- 16.4.2. Component
- 16.4.3. Technology
- 16.4.4. Farm Type
- 16.4.5. Connectivity Type
- 16.4.6. Deployment Mode
- 16.4.7. Application
- 16.4.8. End User
- 16.5. India Smart Agriculture Market
- 16.5.1. Country Segmental Analysis
- 16.5.2. Component
- 16.5.3. Technology
- 16.5.4. Farm Type
- 16.5.5. Connectivity Type
- 16.5.6. Deployment Mode
- 16.5.7. Application
- 16.5.8. End User
- 16.6. Japan Smart Agriculture Market
- 16.6.1. Country Segmental Analysis
- 16.6.2. Component
- 16.6.3. Technology
- 16.6.4. Farm Type
- 16.6.5. Connectivity Type
- 16.6.6. Deployment Mode
- 16.6.7. Application
- 16.6.8. End User
- 16.7. South Korea Smart Agriculture Market
- 16.7.1. Country Segmental Analysis
- 16.7.2. Component
- 16.7.3. Technology
- 16.7.4. Farm Type
- 16.7.5. Connectivity Type
- 16.7.6. Deployment Mode
- 16.7.7. Application
- 16.7.8. End User
- 16.8. Australia and New Zealand Smart Agriculture Market
- 16.8.1. Country Segmental Analysis
- 16.8.2. Component
- 16.8.3. Technology
- 16.8.4. Farm Type
- 16.8.5. Connectivity Type
- 16.8.6. Deployment Mode
- 16.8.7. Application
- 16.8.8. End User
- 16.9. Indonesia Smart Agriculture Market
- 16.9.1. Country Segmental Analysis
- 16.9.2. Component
- 16.9.3. Technology
- 16.9.4. Farm Type
- 16.9.5. Connectivity Type
- 16.9.6. Deployment Mode
- 16.9.7. Application
- 16.9.8. End User
- 16.10. Malaysia Smart Agriculture Market
- 16.10.1. Country Segmental Analysis
- 16.10.2. Component
- 16.10.3. Technology
- 16.10.4. Farm Type
- 16.10.5. Connectivity Type
- 16.10.6. Deployment Mode
- 16.10.7. Application
- 16.10.8. End User
- 16.11. Thailand Smart Agriculture Market
- 16.11.1. Country Segmental Analysis
- 16.11.2. Component
- 16.11.3. Technology
- 16.11.4. Farm Type
- 16.11.5. Connectivity Type
- 16.11.6. Deployment Mode
- 16.11.7. Application
- 16.11.8. End User
- 16.12. Vietnam Smart Agriculture Market
- 16.12.1. Country Segmental Analysis
- 16.12.2. Component
- 16.12.3. Technology
- 16.12.4. Farm Type
- 16.12.5. Connectivity Type
- 16.12.6. Deployment Mode
- 16.12.7. Application
- 16.12.8. End User
- 16.13. Rest of Asia Pacific Smart Agriculture Market
- 16.13.1. Country Segmental Analysis
- 16.13.2. Component
- 16.13.3. Technology
- 16.13.4. Farm Type
- 16.13.5. Connectivity Type
- 16.13.6. Deployment Mode
- 16.13.7. Application
- 16.13.8. End User
- 17. Middle East Smart Agriculture Market Analysis
- 17.1. Key Segment Analysis
- 17.2. Regional Snapshot
- 17.3. Middle East Smart Agriculture Market Size (Value - US$ Bn), Analysis, and Forecasts, 2021-2035
- 17.3.1. Component
- 17.3.2. Technology
- 17.3.3. Farm Type
- 17.3.4. Connectivity Type
- 17.3.5. Deployment Mode
- 17.3.6. Application
- 17.3.7. End User
- 17.3.8. Country
- 17.3.8.1. Turkey
- 17.3.8.2. UAE
- 17.3.8.3. Saudi Arabia
- 17.3.8.4. Israel
- 17.3.8.5. Rest of Middle East
- 17.4. Turkey Smart Agriculture Market
- 17.4.1. Country Segmental Analysis
- 17.4.2. Component
- 17.4.3. Technology
- 17.4.4. Farm Type
- 17.4.5. Connectivity Type
- 17.4.6. Deployment Mode
- 17.4.7. Application
- 17.4.8. End User
- 17.5. UAE Smart Agriculture Market
- 17.5.1. Country Segmental Analysis
- 17.5.2. Component
- 17.5.3. Technology
- 17.5.4. Farm Type
- 17.5.5. Connectivity Type
- 17.5.6. Deployment Mode
- 17.5.7. Application
- 17.5.8. End User
- 17.6. Saudi Arabia Smart Agriculture Market
- 17.6.1. Country Segmental Analysis
- 17.6.2. Component
- 17.6.3. Technology
- 17.6.4. Farm Type
- 17.6.5. Connectivity Type
- 17.6.6. Deployment Mode
- 17.6.7. Application
- 17.6.8. End User
- 17.7. Israel Smart Agriculture Market
- 17.7.1. Country Segmental Analysis
- 17.7.2. Component
- 17.7.3. Technology
- 17.7.4. Farm Type
- 17.7.5. Connectivity Type
- 17.7.6. Deployment Mode
- 17.7.7. Application
- 17.7.8. End User
- 17.8. Rest of Middle East Smart Agriculture Market
- 17.8.1. Country Segmental Analysis
- 17.8.2. Component
- 17.8.3. Technology
- 17.8.4. Farm Type
- 17.8.5. Connectivity Type
- 17.8.6. Deployment Mode
- 17.8.7. Application
- 17.8.8. End User
- 18. Africa Smart Agriculture Market Analysis
- 18.1. Key Segment Analysis
- 18.2. Regional Snapshot
- 18.3. Africa Smart Agriculture Market Size (Value - US$ Bn), Analysis, and Forecasts, 2021-2035
- 18.3.1. Component
- 18.3.2. Technology
- 18.3.3. Farm Type
- 18.3.4. Connectivity Type
- 18.3.5. Deployment Mode
- 18.3.6. Application
- 18.3.7. End User
- 18.3.8. Country
- 18.3.8.1. South Africa
- 18.3.8.2. Egypt
- 18.3.8.3. Nigeria
- 18.3.8.4. Algeria
- 18.3.8.5. Rest of Africa
- 18.4. South Africa Smart Agriculture Market
- 18.4.1. Country Segmental Analysis
- 18.4.2. Component
- 18.4.3. Technology
- 18.4.4. Farm Type
- 18.4.5. Connectivity Type
- 18.4.6. Deployment Mode
- 18.4.7. Application
- 18.4.8. End User
- 18.5. Egypt Smart Agriculture Market
- 18.5.1. Country Segmental Analysis
- 18.5.2. Component
- 18.5.3. Technology
- 18.5.4. Farm Type
- 18.5.5. Connectivity Type
- 18.5.6. Deployment Mode
- 18.5.7. Application
- 18.5.8. End User
- 18.6. Nigeria Smart Agriculture Market
- 18.6.1. Country Segmental Analysis
- 18.6.2. Component
- 18.6.3. Technology
- 18.6.4. Farm Type
- 18.6.5. Connectivity Type
- 18.6.6. Deployment Mode
- 18.6.7. Application
- 18.6.8. End User
- 18.7. Algeria Smart Agriculture Market
- 18.7.1. Country Segmental Analysis
- 18.7.2. Component
- 18.7.3. Technology
- 18.7.4. Farm Type
- 18.7.5. Connectivity Type
- 18.7.6. Deployment Mode
- 18.7.7. Application
- 18.7.8. End User
- 18.8. Rest of Africa Smart Agriculture Market
- 18.8.1. Country Segmental Analysis
- 18.8.2. Component
- 18.8.3. Technology
- 18.8.4. Farm Type
- 18.8.5. Connectivity Type
- 18.8.6. Deployment Mode
- 18.8.7. Application
- 18.8.8. End User
- 19. South America Smart Agriculture Market Analysis
- 19.1. Key Segment Analysis
- 19.2. Regional Snapshot
- 19.3. South America Smart Agriculture Market Size (Value - US$ Bn), Analysis, and Forecasts, 2021-2035
- 19.3.1. Component
- 19.3.2. Technology
- 19.3.3. Farm Type
- 19.3.4. Connectivity Type
- 19.3.5. Deployment Mode
- 19.3.6. Application
- 19.3.7. End User
- 19.3.8. Country
- 19.3.8.1. Brazil
- 19.3.8.2. Argentina
- 19.3.8.3. Rest of South America
- 19.4. Brazil Smart Agriculture Market
- 19.4.1. Country Segmental Analysis
- 19.4.2. Component
- 19.4.3. Technology
- 19.4.4. Farm Type
- 19.4.5. Connectivity Type
- 19.4.6. Deployment Mode
- 19.4.7. Application
- 19.4.8. End User
- 19.5. Argentina Smart Agriculture Market
- 19.5.1. Country Segmental Analysis
- 19.5.2. Component
- 19.5.3. Technology
- 19.5.4. Farm Type
- 19.5.5. Connectivity Type
- 19.5.6. Deployment Mode
- 19.5.7. Application
- 19.5.8. End User
- 19.6. Rest of South America Smart Agriculture Market
- 19.6.1. Country Segmental Analysis
- 19.6.2. Component
- 19.6.3. Technology
- 19.6.4. Farm Type
- 19.6.5. Connectivity Type
- 19.6.6. Deployment Mode
- 19.6.7. Application
- 19.6.8. End User
- 20. Key Players/ Company Profile
- 20.1. AGCO Corporation.
- 20.1.1. Company Details/ Overview
- 20.1.2. Company Financials
- 20.1.3. Key Customers and Competitors
- 20.1.4. Business/ Industry Portfolio
- 20.1.5. Product Portfolio/ Specification Details
- 20.1.6. Pricing Data
- 20.1.7. Strategic Overview
- 20.1.8. Recent Developments
- 20.2. BASF SE
- 20.3. Bayer AG (The Climate Corporation)
- 20.4. Bosch Group
- 20.5. Cisco Systems, Inc.
- 20.6. CNH Industrial
- 20.7. Corteva Agriscience
- 20.8. Deere & Company
- 20.9. DJI Technology Co., Ltd.
- 20.10. Farmers Edge Inc.
- 20.11. Hexagon AB
- 20.12. Hitachi Ltd.
- 20.13. IBM Corporation
- 20.14. Kubota Corporation
- 20.15. Microsoft Corporation
- 20.16. SAP SE
- 20.17. Siemens AG
- 20.18. Topcon Positioning Systems
- 20.19. Trimble Inc.
- 20.20. Yara International
- 20.21. Other Key Players
- 20.1. AGCO Corporation.
Note* - This is just tentative list of players. While providing the report, we will cover more number of players based on their revenue and share for each geography
Research Design
Our research design integrates both demand-side and supply-side analysis through a balanced combination of primary and secondary research methodologies. By utilizing both bottom-up and top-down approaches alongside rigorous data triangulation methods, we deliver robust market intelligence that supports strategic decision-making.
MarketGenics' comprehensive research design framework ensures the delivery of accurate, reliable, and actionable market intelligence. Through the integration of multiple research approaches, rigorous validation processes, and expert analysis, we provide our clients with the insights needed to make informed strategic decisions and capitalize on market opportunities.

MarketGenics leverages a dedicated industry panel of experts and a comprehensive suite of paid databases to effectively collect, consolidate, and analyze market intelligence.
Our approach has consistently proven to be reliable and effective in generating accurate market insights, identifying key industry trends, and uncovering emerging business opportunities.
Through both primary and secondary research, we capture and analyze critical company-level data such as manufacturing footprints, including technical centers, R&D facilities, sales offices, and headquarters.
Our expert panel further enhances our ability to estimate market size for specific brands based on validated field-level intelligence.
Our data mining techniques incorporate both parametric and non-parametric methods, allowing for structured data collection, sorting, processing, and cleaning.
Demand projections are derived from large-scale data sets analyzed through proprietary algorithms, culminating in robust and reliable market sizing.
Research Approach
The bottom-up approach builds market estimates by starting with the smallest addressable market units and systematically aggregating them to create comprehensive market size projections.
This method begins with specific, granular data points and builds upward to create the complete market landscape.
Customer Analysis → Segmental Analysis → Geographical Analysis
The top-down approach starts with the broadest possible market data and systematically narrows it down through a series of filters and assumptions to arrive at specific market segments or opportunities.
This method begins with the big picture and works downward to increasingly specific market slices.
TAM → SAM → SOM


Research Methods
Desk / Secondary Research
While analysing the market, we extensively study secondary sources, directories, and databases to identify and collect information useful for this technical, market-oriented, and commercial report. Secondary sources that we utilize are not only the public sources, but it is a combination of Open Source, Associations, Paid Databases, MG Repository & Knowledgebase, and others.
- Company websites, annual reports, financial reports, broker reports, and investor presentations
- National government documents, statistical databases and reports
- News articles, press releases and web-casts specific to the companies operating in the market, Magazines, reports, and others
- We gather information from commercial data sources for deriving company specific data such as segmental revenue, share for geography, product revenue, and others
- Internal and external proprietary databases (industry-specific), relevant patent, and regulatory databases
- Governing Bodies, Government Organizations
- Relevant Authorities, Country-specific Associations for Industries
We also employ the model mapping approach to estimate the product level market data through the players' product portfolio
Primary Research
Primary research/ interviews is vital in analyzing the market. Most of the cases involves paid primary interviews. Primary sources include primary interviews through e-mail interactions, telephonic interviews, surveys as well as face-to-face interviews with the different stakeholders across the value chain including several industry experts.
| Type of Respondents | Number of Primaries |
|---|---|
| Tier 2/3 Suppliers | ~20 |
| Tier 1 Suppliers | ~25 |
| End-users | ~25 |
| Industry Expert/ Panel/ Consultant | ~30 |
| Total | ~100 |
MG Knowledgebase
• Repository of industry blog, newsletter and case studies
• Online platform covering detailed market reports, and company profiles
Forecasting Factors and Models
Forecasting Factors
- Historical Trends – Past market patterns, cycles, and major events that shaped how markets behave over time. Understanding past trends helps predict future behavior.
- Industry Factors – Specific characteristics of the industry like structure, regulations, and innovation cycles that affect market dynamics.
- Macroeconomic Factors – Economic conditions like GDP growth, inflation, and employment rates that affect how much money people have to spend.
- Demographic Factors – Population characteristics like age, income, and location that determine who can buy your product.
- Technology Factors – How quickly people adopt new technology and how much technology infrastructure exists.
- Regulatory Factors – Government rules, laws, and policies that can help or restrict market growth.
- Competitive Factors – Analyzing competition structure such as degree of competition and bargaining power of buyers and suppliers.
Forecasting Models / Techniques
Multiple Regression Analysis
- Identify and quantify factors that drive market changes
- Statistical modeling to establish relationships between market drivers and outcomes
Time Series Analysis – Seasonal Patterns
- Understand regular cyclical patterns in market demand
- Advanced statistical techniques to separate trend, seasonal, and irregular components
Time Series Analysis – Trend Analysis
- Identify underlying market growth patterns and momentum
- Statistical analysis of historical data to project future trends
Expert Opinion – Expert Interviews
- Gather deep industry insights and contextual understanding
- In-depth interviews with key industry stakeholders
Multi-Scenario Development
- Prepare for uncertainty by modeling different possible futures
- Creating optimistic, pessimistic, and most likely scenarios
Time Series Analysis – Moving Averages
- Sophisticated forecasting for complex time series data
- Auto-regressive integrated moving average models with seasonal components
Econometric Models
- Apply economic theory to market forecasting
- Sophisticated economic models that account for market interactions
Expert Opinion – Delphi Method
- Harness collective wisdom of industry experts
- Structured, multi-round expert consultation process
Monte Carlo Simulation
- Quantify uncertainty and probability distributions
- Thousands of simulations with varying input parameters
Research Analysis
Our research framework is built upon the fundamental principle of validating market intelligence from both demand and supply perspectives. This dual-sided approach ensures comprehensive market understanding and reduces the risk of single-source bias.
Demand-Side Analysis: We understand end-user/application behavior, preferences, and market needs along with the penetration of the product for specific application.
Supply-Side Analysis: We estimate overall market revenue, analyze the segmental share along with industry capacity, competitive landscape, and market structure.
Validation & Evaluation
Data triangulation is a validation technique that uses multiple methods, sources, or perspectives to examine the same research question, thereby increasing the credibility and reliability of research findings. In market research, triangulation serves as a quality assurance mechanism that helps identify and minimize bias, validate assumptions, and ensure accuracy in market estimates.
- Data Source Triangulation – Using multiple data sources to examine the same phenomenon
- Methodological Triangulation – Using multiple research methods to study the same research question
- Investigator Triangulation – Using multiple researchers or analysts to examine the same data
- Theoretical Triangulation – Using multiple theoretical perspectives to interpret the same data

Custom Market Research Services
We will customise the research for you, in case the report listed above does not meet your requirements.
Get 10% Free Customisation