Bio-based Pigments Market Size, Share & Trends Analysis Report by Source (Microbial-derived, Plant-derived, Animal-derived, Fermentation-derived), Pigment Type, Form, Solubility, End-use Industry, Distribution Channel, and Geography (North America, Europe, Asia Pacific, Middle East, Africa, and South America) – Global Industry Data, Trends, and Forecasts, 2026–2035
|
|
|
Segmental Data Insights |
|
|
Demand Trends |
|
|
Competitive Landscape |
|
|
Strategic Development |
|
|
Future Outlook & Opportunities |
|
Bio-based-Pigments-Market Size, Share, and Growth
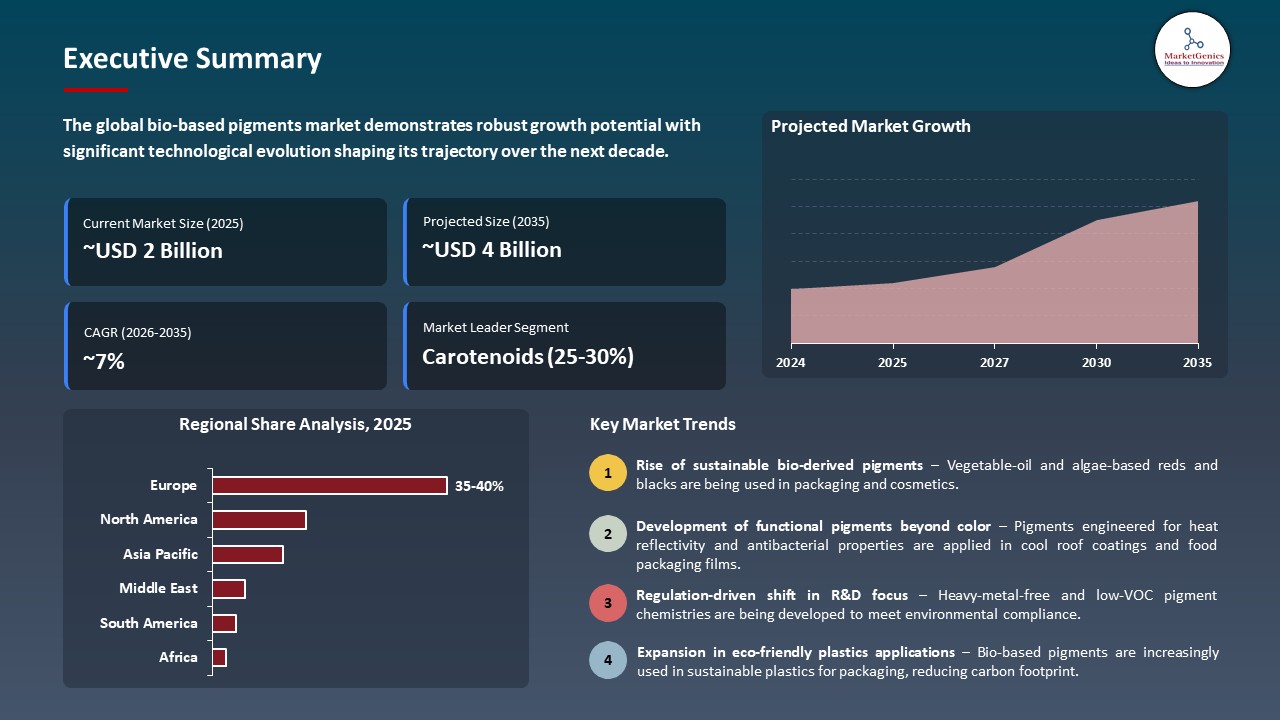
The global bio-based pigments market is exhibiting strong growth, with an estimated value of USD 1.8 billion in 2025 and USD 3.6 billion by 2035, achieving a CAGR of 7.2%, during the forecast period. The global bio-based pigments market is primarily driven by increasing consumer preference for clean-label and natural products, stringent regulations limiting synthetic dyes, growing awareness of environmental sustainability, rising applications in food, beverages, cosmetics, and pharmaceuticals, and advancements in eco-friendly extraction and stabilization technologies that enhance product performance.
Anne van der Meijde said: “At GNT, we pride ourselves on offering a wide range of plant-based colouring solutions to meet different application requirements. Our experts will work with manufacturers to select the best colouring solution for their project needs and help them achieve the results they need.”
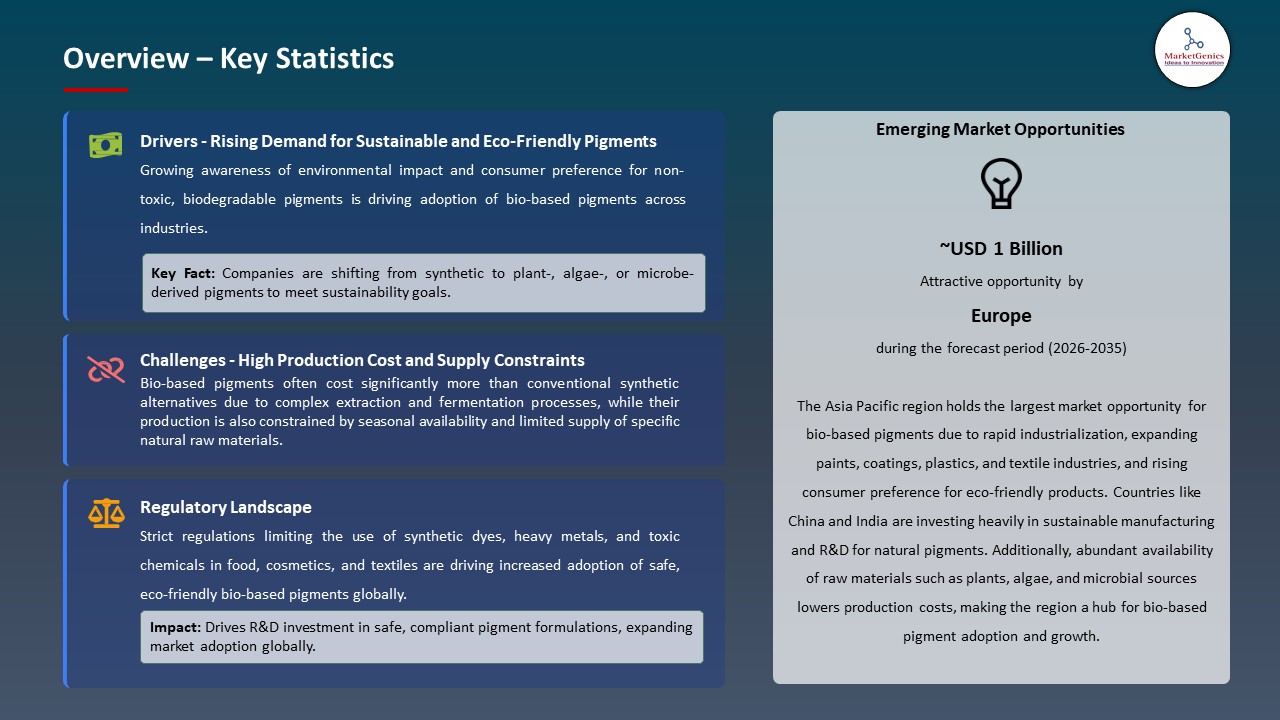
Rising demand for sustainable and renewable alternatives to conventional synthetic colorants is driving the global bio-based pigments market, as industries and consumers increasingly prioritize eco-friendly and environmentally responsible products. For instance, BASF SE encourages bio-based solutions using renewable raw materials, such as dispersions and binders which reduce the use of fossil fuels and carbon footprint. The trend is boosting market growth and encouraging more environment-friendly production in the global market.
Further, strategic collaborations and technological advancements in microbial fermentation and synthetic biology for scalable bio‑based color production are driving growth in the global bio‑based pigments market, as companies pursue efficient and diverse pigment synthesis technologies. For instance, Ginkgo Bioworks partnered with Octarine Bio to develop sustainable bio‑based dyes via engineered microbial strains that enable scale‑up of pigment production for the fashion and textile industry, showcasing industry efforts to commercialize eco‑friendly pigments with broader color ranges and performance attributes.
Key adjacent opportunities for the global bio‑based pigments market include natural food colorants, eco‑friendly cosmetics, sustainable textile dyes, biodegradable packaging inks, and bio‑based coatings. These sectors increasingly demand safe, non-toxic, and environmentally sustainable solutions, offering pigment manufacturers avenues for product diversification, innovation, and strategic partnerships. This expansion into adjacent markets is expected to broaden revenue streams and accelerate adoption of bio‑based pigments across industries.
Bio-based Pigments Market Dynamics and Trends
Driver: Adoption of Advanced Renewable Production Technologies by Key Manufacturers
- Technological innovations that enable the scalable production of renewable pigment feedstocks are driving growth in the bio‑based pigments market, as they reduce reliance on petrochemical inputs while enhancing cost efficiency and sustainability. Key industry players are expanding their bio‑based pigment portfolios through process innovations and strategic collaborations.
- For instance, Pili, a bio-based color firm, uses both industrial fermentation and organic chemistry to make textile, ink, polymer and coating colorants that are sustainable and high-performing, made of renewable biomass, showing progress toward commercially viable bio-derived pigments. Investment in proprietary production technologies expedites commercialization of high-performance, sustainable pigments and competitive positioning of manufacturers in major end-use markets.
- This strategic direction facilitates market growth through the combination of ecological advantages and industrial expandability, supplier differentiation, and revenue growth over time.
Restraint: High Production Costs and Price Sensitivity in Bio‑Based Pigment Manufacturing
- High cost of production and feedstock still limits the expansion of the bio-based pigment market in the world. Complex processes of manufacturing, enzymatic routes and dependence on renewable raw materials may attract high unit costs in contrast to traditional synthetic pigments.
- Premium pricing of bio-based pigments could limit uptake in cost-sensitive markets, such as commodity finishes and low-margin plastics. Major players in the industry, including BASF SE and Clariant AG, have recognized that the cost pressure of inflation of raw materials and specialized production needs pose a challenge on the short-term profitability in the process of transitioning to environmentally compliant operation.
- The issues with these costs could hinder the time to make procurement decisions of price-sensitive buyers and limit market penetration in the lower-end applications. This restraint therefore curbs the short-term market growth until economies of scale, process efficiencies and cost optimization strategies are achieved.
Opportunity: Rising Demand for Bio‑Based Pigments in Personal Care and Cosmetics
- The increasing clean beauty and personal care markets provide the bio-based pigments market with a substantial opportunity as cosmetic formulators are now focusing on sustainable and plant-based colorants that capture the more stringent ingredients regulations and consumer preferences demanding natural, non-toxic formulations.
- Bio‑based effect pigments sourced from plants, microbes, or algae are increasingly adopted in eye makeup, facial colorants, and other decorative cosmetics, delivering both aesthetic quality and environmental benefits. The major industry actors, such as BASF SE, Clariant AG and specialty pigments suppliers, are actively diversifying their sustainable pigments into clean beauty use, in line with the rapid growth trend in the sector.
- This market enables manufacturers to utilize R&D and supply chains and capture higher-margin, sustainability-driven revenues that are not used in industry.
Key Trend: Integration of Multifunctional and Performance‑Oriented Sustainable Pigment Solutions
- The bio-based pigments market is rapidly moving towards multifunctional performance-based solutions and this shift in pigments is away towards the simple coloration to the multifunctional performance-based pigments. To satisfy the need of high-quality applications in coatings, textiles, packaging, and specialty inks, manufacturers are creating bio-based pigments that have superior qualities, such as better color fastness, biodegradation, ability to be recycled, and specific dispersion characteristics.
- For instance, UPM Circular Renewable Black by UPM Biochemicals, a bio-based, near infrared (NIR) detectable, non-carbon pigment, recyclable packaging. It delivers both premium black aesthetics and superior sustainability credentials, demonstrating the market’s shift toward high-performance, multifunctional pigments.
- The trend fosters market maturity through the expansion of application versatility, circular economy efforts, and the reinforcement of the use of environmentally-friendly pigment solutions.
 Bio-based Pigments Market Analysis and Segmental Data
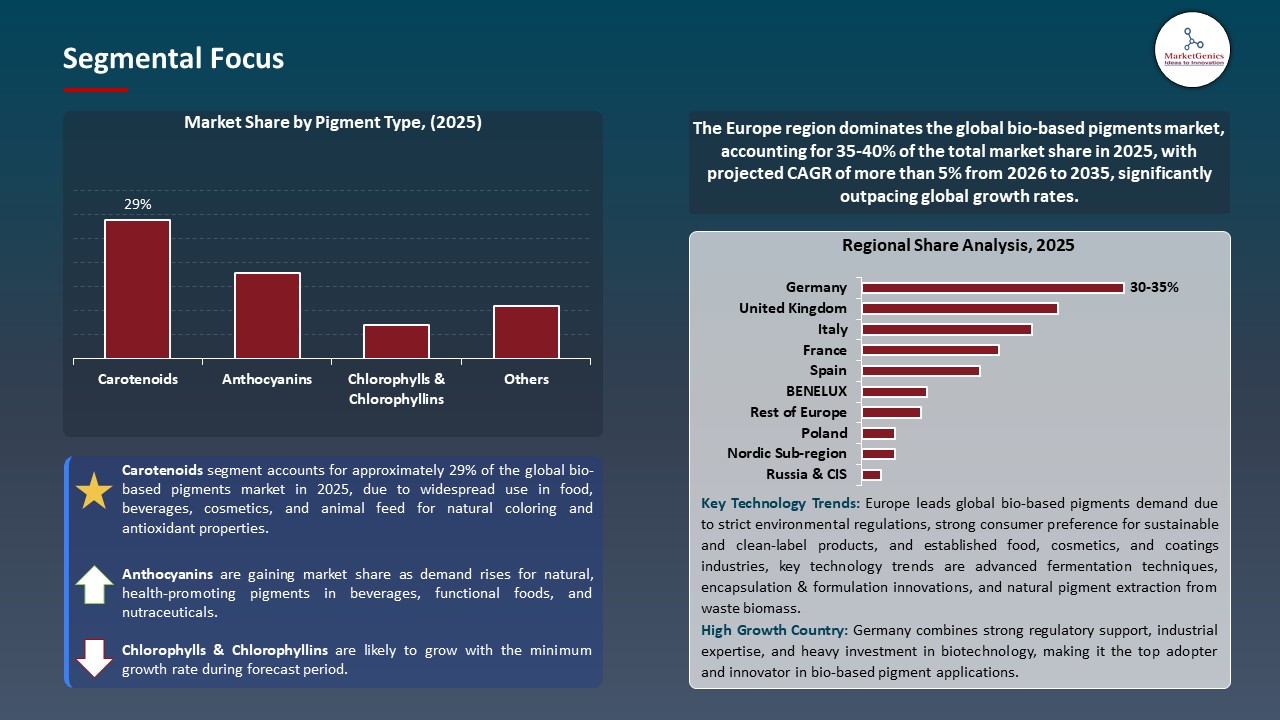
Carotenoids Dominate Global Bio-based Pigments Market
- The carotenoids segment dominates the global bio-based pigments market because of their dual role as natural colorants and health-promoting compounds. Their wide usage cuts across food and beverages, nutraceuticals, cosmetics and animal feed due to the increasing demands of clean-label, naturally sourced, and functional ingredients.
- For instance, Lycored, which has recently introduced ResilientRed BF, a tomato-derived lycopene-based colorant aimed at use in food and beverages. The company has been innovative and sustainable in that this product provides greater stability, clean-label, and high-end formulations.
- The preeminence of carotenoids highlights their strategic importance to the growing use of bio-based pigments as a means to provide both decorative use and functional health properties, as well as to facilitate the sustainable and consumer-favored product development.
Europe Leads Global Bio-based Pigments Market Demand
- Europe leads the bio-based pigments market, due to the high standards of sustainability and regulation which are making bio-based pigment solutions more important driving companies to shift their product portfolios to meet the demands of environmentally-friendly standards. European manufacturers of chemicals are offering certified and low-carbon pigments as a way of meeting compliance and performance requirements. For instance, BASF SE increased its biomass-balanced portfolio by 250+ coating products using renewable materials instead of fossil feedstock and decreasing CO2 emissions because of the high demand of the European market on sustainable solutions.
- Moreover, growth in the European automotive, construction and specialty coatings industries is increasing the use of bio-based pigments, with manufacturers seeking high performance, more sustainable, colorants and the innovation and sustainability efforts of leading producers. For instance, Clariant AG focuses on its contribution to sustainable chemistry by creating bio-economy-oriented solutions and bio-based raw materials innovations to address the future industrial need of greener pigment solutions.
- This strong regional focus on sustainability and industrial innovation positions Europe as a key growth hub, accelerating bio‑based pigment adoption and setting benchmarks for environmentally responsible manufacturing globally.
Bio-based Pigments Market Ecosystem
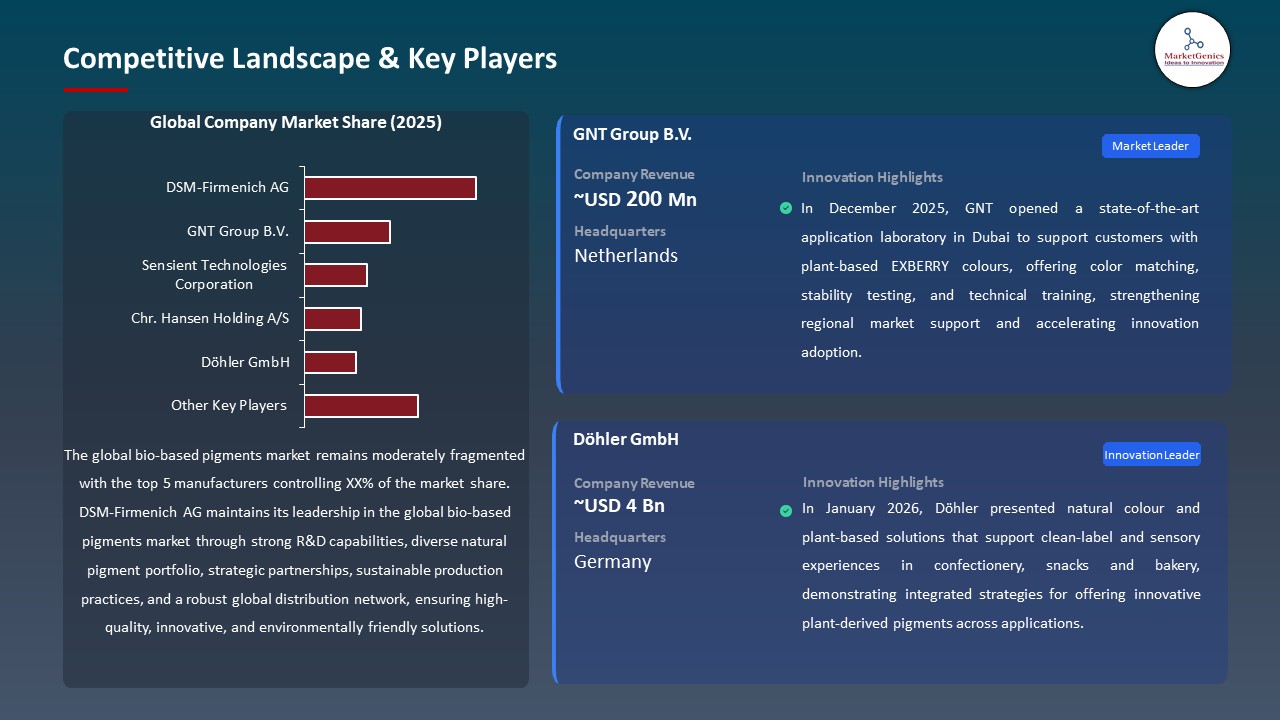
The global bio-based pigments market is slightly consolidated, with major players such as DSM‑Firmenich AG, GNT Group B.V., Sensient Technologies Corporation, Chr. Hansen Holding A/S, and Döhler GmbH dominating through advanced biotechnology, scalable extraction processes, and vertically integrated capabilities to meet sustainable colour demand across food, cosmetics, and industrial applications. Consumer preference for natural and sustainable solutions continues to elevate their market share.
Government bodies and research institutions are also advancing bio‑based pigment technologies. In February 2026, scientists at Saarland University partnered with industry to develop microbial production systems for bio‑based pigments under Germany’s BioChroma project, funded by the Federal Ministry of Education and Research. This project uses metabolic engineering to generate biodegradable pigments with purified functionality and optimized purity, and could revolutionize the manufacture of pigments in the industry.
The innovation is important because it makes it possible to produce eco-friendly pigments on a large scale, at a cost-effective level, to avoid using synthetic dyes and help achieve sustainability objectives and improve the performance of products in various industries.
 Recent Development and Strategic Overview:
- In January 2026, Döhler emphasized emerging natural colour trends, including Cloud Dancer, and introduced solutions such as White Diamond a plant-based alternative to titanium dioxide and Cloud Emulsions for beverages. These offerings support manufacturers in delivering premium, clean-label visual experiences while aligning with evolving consumer preferences and regulatory requirements.
- In June 2025, GNT Group B.V. announced the expansion of its EXBERRY Organics portfolio with the introduction of a vibrant Brilliant Pink plant-based color, derived from purple sweet potatoes. The product is engineered for heat-stable, low-pH applications in food and beverages, reinforcing GNT’s commitment to clean-label, certified organic, and high-quality natural pigment solutions.
Report Scope
|
Detail |
|
|
Market Size in 2025 |
USD 1.8 Bn |
|
Market Forecast Value in 2035 |
USD 3.6 Bn |
|
Growth Rate (CAGR) |
7.2% |
|
Forecast Period |
2026 – 2035 |
|
Historical Data Available for |
2021 – 2024 |
|
Market Size Units |
US$ Billion for Value Tons for Volume |
|
Report Format |
Electronic (PDF) + Excel |
|
North America |
Europe |
Asia Pacific |
Middle East |
Africa |
South America |
|
|
|
|
|
|
|
Companies Covered |
|||||
|
|
|
|
|
|
Bio-based Pigments Market Segmentation and Highlights
|
Segment |
Sub-segment |
|
Bio-based Pigments Market, By Source |
|
|
Bio-based Pigments Market, By Pigment Type |
|
|
Bio-based Pigments Market, By Form |
|
|
Bio-based Pigments Market, By Solubility |
|
|
Bio-based Pigments Market, By End-use Industry |
|
|
Bio-based Pigments Market, By Distribution Channel |
|
Frequently Asked Questions
Table of Contents
- 1. Research Methodology and Assumptions
- 1.1. Definitions
- 1.2. Research Design and Approach
- 1.3. Data Collection Methods
- 1.4. Base Estimates and Calculations
- 1.5. Forecasting Models
- 1.5.1. Key Forecast Factors & Impact Analysis
- 1.6. Secondary Research
- 1.6.1. Open Sources
- 1.6.2. Paid Databases
- 1.6.3. Associations
- 1.7. Primary Research
- 1.7.1. Primary Sources
- 1.7.2. Primary Interviews with Stakeholders across Ecosystem
- 2. Executive Summary
- 2.1. Global Bio-based Pigments Market Outlook
- 2.1.1. Bio-based Pigments Market Size (Volume - Tons and Value - US$ Bn), and Forecasts, 2021-2035
- 2.1.2. Compounded Annual Growth Rate Analysis
- 2.1.3. Growth Opportunity Analysis
- 2.1.4. Segmental Share Analysis
- 2.1.5. Geographical Share Analysis
- 2.2. Market Analysis and Facts
- 2.3. Supply-Demand Analysis
- 2.4. Competitive Benchmarking
- 2.5. Go-to- Market Strategy
- 2.5.1. Customer/ End-use Industry Assessment
- 2.5.2. Growth Opportunity Data, 2026-2035
- 2.5.2.1. Regional Data
- 2.5.2.2. Country Data
- 2.5.2.3. Segmental Data
- 2.5.3. Identification of Potential Market Spaces
- 2.5.4. GAP Analysis
- 2.5.5. Potential Attractive Price Points
- 2.5.6. Prevailing Market Risks & Challenges
- 2.5.7. Preferred Sales & Marketing Strategies
- 2.5.8. Key Recommendations and Analysis
- 2.5.9. A Way Forward
- 2.1. Global Bio-based Pigments Market Outlook
- 3. Industry Data and Premium Insights
- 3.1. Global Chemicals & Materials Industry Overview, 2025
- 3.1.1. Chemicals & Materials Ecosystem Analysis
- 3.1.2. Key Trends for Chemicals & Materials Industry
- 3.1.3. Regional Distribution for Chemicals & Materials Industry
- 3.2. Supplier Customer Data
- 3.3. Technology Roadmap and Developments
- 3.1. Global Chemicals & Materials Industry Overview, 2025
- 4. Market Overview
- 4.1. Market Dynamics
- 4.1.1. Drivers
- 4.1.1.1. Rising demand for sustainable and eco-friendly pigments as alternatives to synthetic colorants
- 4.1.1.2. Stringent environmental regulations limiting the use of harmful synthetic dyes
- 4.1.1.3. Advancements in biotechnology and fermentation improving bio-based pigment production
- 4.1.2. Restraints
- 4.1.2.1. Higher production costs compared to synthetic pigments
- 4.1.2.2. Supply chain challenges and limited awareness among manufacturers and end-users
- 4.1.1. Drivers
- 4.2. Key Trend Analysis
- 4.3. Regulatory Framework
- 4.3.1. Key Regulations, Norms, and Subsidies, by Key Countries
- 4.3.2. Tariffs and Standards
- 4.3.3. Impact Analysis of Regulations on the Market
- 4.4. Value Chain Analysis
- 4.4.1. Raw Material Suppliers
- 4.4.2. Bio-based Pigment Producers
- 4.4.3. Distributors
- 4.4.4. End Users
- 4.5. Cost Structure Analysis
- 4.5.1. Parameter’s Share for Cost Associated
- 4.5.2. COGP vs COGS
- 4.5.3. Profit Margin Analysis
- 4.6. Pricing Analysis
- 4.6.1. Regional Pricing Analysis
- 4.6.2. Segmental Pricing Trends
- 4.6.3. Factors Influencing Pricing
- 4.7. Porter’s Five Forces Analysis
- 4.8. PESTEL Analysis
- 4.9. Global Bio-based Pigments Market Demand
- 4.9.1. Historical Market Size – in Volume (Tons) and Value (US$ Bn), 2020-2024
- 4.9.2. Current and Future Market Size – in Volume (Tons) and Value (US$ Bn), 2026–2035
- 4.9.2.1. Y-o-Y Growth Trends
- 4.9.2.2. Absolute $ Opportunity Assessment
- 4.1. Market Dynamics
- 5. Competition Landscape
- 5.1. Competition structure
- 5.1.1. Fragmented v/s consolidated
- 5.2. Company Share Analysis, 2025
- 5.2.1. Global Company Market Share
- 5.2.2. By Region
- 5.2.2.1. North America
- 5.2.2.2. Europe
- 5.2.2.3. Asia Pacific
- 5.2.2.4. Middle East
- 5.2.2.5. Africa
- 5.2.2.6. South America
- 5.3. Product Comparison Matrix
- 5.3.1. Specifications
- 5.3.2. Market Positioning
- 5.3.3. Pricing
- 5.1. Competition structure
- 6. Global Bio-based Pigments Market Analysis, by Source
- 6.1. Key Segment Analysis
- 6.2. Bio-based Pigments Market Size (Volume - Tons and Value - US$ Bn), Analysis, and Forecasts, by Source, 2021-2035
- 6.2.1. Microbial-derived
- 6.2.1.1. Bacterial pigments
- 6.2.1.2. Fungal pigments
- 6.2.1.3. Algal/Microalgae pigments
- 6.2.1.4. Yeast-derived pigments
- 6.2.1.5. Others
- 6.2.2. Plant-derived
- 6.2.2.1. Fruit & vegetable extracts
- 6.2.2.2. Flower & petal extracts
- 6.2.2.3. Seed & bark extracts
- 6.2.2.4. Leaf extracts
- 6.2.2.5. Others
- 6.2.3. Animal-derived
- 6.2.3.1. Insect-based (e.g., Carmine from Cochineal)
- 6.2.3.2. Marine animal-based
- 6.2.3.3. Others
- 6.2.4. Fermentation-derived
- 6.2.1. Microbial-derived
- 7. Global Bio-based Pigments Market Analysis, by Pigment Type
- 7.1. Key Segment Analysis
- 7.2. Bio-based Pigments Market Size (Volume - Tons and Value - US$ Bn), Analysis, and Forecasts, by Pigment Type, 2021-2035
- 7.2.1. Carotenoids
- 7.2.1.1. Beta-carotene
- 7.2.1.2. Lycopene
- 7.2.1.3. Astaxanthin
- 7.2.1.4. Lutein
- 7.2.1.5. Zeaxanthin
- 7.2.1.6. Others
- 7.2.2. Anthocyanins
- 7.2.3. Chlorophylls & Chlorophyllins
- 7.2.4. Phycobiliproteins
- 7.2.5. Curcuminoids
- 7.2.6. Betalains
- 7.2.7. Flavonoids & Tannins
- 7.2.8. Indigo & Indigoid pigments
- 7.2.9. Riboflavin (Vitamin B2-based)
- 7.2.10. Monascus pigments
- 7.2.11. Others
- 7.2.1. Carotenoids
- 8. Global Bio-based Pigments Market Analysis, by Form
- 8.1. Key Segment Analysis
- 8.2. Bio-based Pigments Market Size (Volume - Tons and Value - US$ Bn), Analysis, and Forecasts, by Form, 2021-2035
- 8.2.1. Powder
- 8.2.2. Liquid
- 8.2.3. Paste
- 8.2.4. Granules
- 8.2.5. Others
- 9. Global Bio-based Pigments Market Analysis, by Solubility
- 9.1. Key Segment Analysis
- 9.2. Bio-based Pigments Market Size (Volume - Tons and Value - US$ Bn), Analysis, and Forecasts, by Solubility, 2021-2035
- 9.2.1. Water-soluble pigments
- 9.2.2. Oil/Fat-soluble pigments
- 9.2.3. Alcohol-soluble pigments
- 10. Global Bio-based Pigments Market Analysis, by End-use Industry
- 10.1. Key Segment Analysis
- 10.2. Bio-based Pigments Market Size (Volume - Tons and Value - US$ Bn), Analysis, and Forecasts, by End-use Industry, 2021-2035
- 10.2.1. Food & Beverage
- 10.2.2. Cosmetics & Personal Care
- 10.2.3. Pharmaceutical & Nutraceutical
- 10.2.4. Textile & Apparel
- 10.2.5. Paints, Coatings & Inks
- 10.2.6. Plastics & Packaging
- 10.2.7. Animal Feed & Aquaculture
- 10.2.8. Agriculture & Horticulture
- 10.2.9. Paper & Stationery
- 10.2.10. Healthcare & Medical Devices
- 10.2.11. Others
- 11. Global Bio-based Pigments Market Analysis, by Distribution Channel
- 11.1. Key Segment Analysis
- 11.2. Bio-based Pigments Market Size (Volume - Tons and Value - US$ Bn), Analysis, and Forecasts, by Distribution Channel, 2021-2035
- 11.2.1. Direct sales / B2B
- 11.2.2. Specialty distributors
- 11.2.3. Online platforms / e-commerce
- 11.2.4. Retail
- 12. Global Bio-based Pigments Market Analysis, by Region
- 12.1. Key Findings
- 12.2. Bio-based Pigments Market Size (Value - US$ Mn), Analysis, and Forecasts, by Region, 2021-2035
- 12.2.1. North America
- 12.2.2. Europe
- 12.2.3. Asia Pacific
- 12.2.4. Middle East
- 12.2.5. Africa
- 12.2.6. South America
- 13. North America Bio-based Pigments Market Analysis
- 13.1. Key Segment Analysis
- 13.2. Regional Snapshot
- 13.3. North America Bio-based Pigments Market Size Volume - TONS and Value - US$ Bn), Analysis, and Forecasts, 2021-2035
- 13.3.1. Source
- 13.3.2. Pigment Type
- 13.3.3. Form
- 13.3.4. Solubility
- 13.3.5. End-use Industry
- 13.3.6. Distribution Channel
- 13.3.7. Country
- 13.3.7.1. USA
- 13.3.7.2. Canada
- 13.3.7.3. Mexico
- 13.4. USA Bio-based Pigments Market
- 13.4.1. Country Segmental Analysis
- 13.4.2. Source
- 13.4.3. Pigment Type
- 13.4.4. Form
- 13.4.5. Solubility
- 13.4.6. End-use Industry
- 13.4.7. Distribution Channel
- 13.5. Canada Bio-based Pigments Market
- 13.5.1. Country Segmental Analysis
- 13.5.2. Source
- 13.5.3. Pigment Type
- 13.5.4. Form
- 13.5.5. Solubility
- 13.5.6. End-use Industry
- 13.5.7. Distribution Channel
- 13.6. Mexico Bio-based Pigments Market
- 13.6.1. Country Segmental Analysis
- 13.6.2. Source
- 13.6.3. Pigment Type
- 13.6.4. Form
- 13.6.5. Solubility
- 13.6.6. End-use Industry
- 13.6.7. Distribution Channel
- 14. Europe Bio-based Pigments Market Analysis
- 14.1. Key Segment Analysis
- 14.2. Regional Snapshot
- 14.3. Europe Bio-based Pigments Market Size (Volume - TONS and Value - US$ Bn), Analysis, and Forecasts, 2021-2035
- 14.3.1. Source
- 14.3.2. Pigment Type
- 14.3.3. Form
- 14.3.4. Solubility
- 14.3.5. End-use Industry
- 14.3.6. Distribution Channel
- 14.3.7. Country
- 14.3.7.1. Germany
- 14.3.7.2. United Kingdom
- 14.3.7.3. France
- 14.3.7.4. Italy
- 14.3.7.5. Spain
- 14.3.7.6. Netherlands
- 14.3.7.7. Nordic Countries
- 14.3.7.8. Poland
- 14.3.7.9. Russia & CIS
- 14.3.7.10. Rest of Europe
- 14.4. Germany Bio-based Pigments Market
- 14.4.1. Country Segmental Analysis
- 14.4.2. Source
- 14.4.3. Pigment Type
- 14.4.4. Form
- 14.4.5. Solubility
- 14.4.6. End-use Industry
- 14.4.7. Distribution Channel
- 14.5. United Kingdom Bio-based Pigments Market
- 14.5.1. Country Segmental Analysis
- 14.5.2. Source
- 14.5.3. Pigment Type
- 14.5.4. Form
- 14.5.5. Solubility
- 14.5.6. End-use Industry
- 14.5.7. Distribution Channel
- 14.6. France Bio-based Pigments Market
- 14.6.1. Country Segmental Analysis
- 14.6.2. Source
- 14.6.3. Pigment Type
- 14.6.4. Form
- 14.6.5. Solubility
- 14.6.6. End-use Industry
- 14.6.7. Distribution Channel
- 14.7. Italy Bio-based Pigments Market
- 14.7.1. Country Segmental Analysis
- 14.7.2. Source
- 14.7.3. Pigment Type
- 14.7.4. Form
- 14.7.5. Solubility
- 14.7.6. End-use Industry
- 14.7.7. Distribution Channel
- 14.8. Spain Bio-based Pigments Market
- 14.8.1. Country Segmental Analysis
- 14.8.2. Source
- 14.8.3. Pigment Type
- 14.8.4. Form
- 14.8.5. Solubility
- 14.8.6. End-use Industry
- 14.8.7. Distribution Channel
- 14.9. Netherlands Bio-based Pigments Market
- 14.9.1. Country Segmental Analysis
- 14.9.2. Source
- 14.9.3. Pigment Type
- 14.9.4. Form
- 14.9.5. Solubility
- 14.9.6. End-use Industry
- 14.9.7. Distribution Channel
- 14.10. Nordic Countries Bio-based Pigments Market
- 14.10.1. Country Segmental Analysis
- 14.10.2. Source
- 14.10.3. Pigment Type
- 14.10.4. Form
- 14.10.5. Solubility
- 14.10.6. End-use Industry
- 14.10.7. Distribution Channel
- 14.11. Poland Bio-based Pigments Market
- 14.11.1. Country Segmental Analysis
- 14.11.2. Source
- 14.11.3. Pigment Type
- 14.11.4. Form
- 14.11.5. Solubility
- 14.11.6. End-use Industry
- 14.11.7. Distribution Channel
- 14.12. Russia & CIS Bio-based Pigments Market
- 14.12.1. Country Segmental Analysis
- 14.12.2. Source
- 14.12.3. Pigment Type
- 14.12.4. Form
- 14.12.5. Solubility
- 14.12.6. End-use Industry
- 14.12.7. Distribution Channel
- 14.13. Rest of Europe Bio-based Pigments Market
- 14.13.1. Country Segmental Analysis
- 14.13.2. Source
- 14.13.3. Pigment Type
- 14.13.4. Form
- 14.13.5. Solubility
- 14.13.6. End-use Industry
- 14.13.7. Distribution Channel
- 15. Asia Pacific Bio-based Pigments Market Analysis
- 15.1. Key Segment Analysis
- 15.2. Regional Snapshot
- 15.3. Asia Pacific Bio-based Pigments Market Size (Volume - TONS and Value - US$ Bn), Analysis, and Forecasts, 2021-2035
- 15.3.1. Source
- 15.3.2. Pigment Type
- 15.3.3. Form
- 15.3.4. Solubility
- 15.3.5. End-use Industry
- 15.3.6. Distribution Channel
- 15.3.7. Country
- 15.3.7.1. China
- 15.3.7.2. India
- 15.3.7.3. Japan
- 15.3.7.4. South Korea
- 15.3.7.5. Australia and New Zealand
- 15.3.7.6. Indonesia
- 15.3.7.7. Malaysia
- 15.3.7.8. Thailand
- 15.3.7.9. Vietnam
- 15.3.7.10. Rest of Asia Pacific
- 15.4. China Bio-based Pigments Market
- 15.4.1. Country Segmental Analysis
- 15.4.2. Source
- 15.4.3. Pigment Type
- 15.4.4. Form
- 15.4.5. Solubility
- 15.4.6. End-use Industry
- 15.4.7. Distribution Channel
- 15.5. India Bio-based Pigments Market
- 15.5.1. Country Segmental Analysis
- 15.5.2. Source
- 15.5.3. Pigment Type
- 15.5.4. Form
- 15.5.5. Solubility
- 15.5.6. End-use Industry
- 15.5.7. Distribution Channel
- 15.6. Japan Bio-based Pigments Market
- 15.6.1. Country Segmental Analysis
- 15.6.2. Source
- 15.6.3. Pigment Type
- 15.6.4. Form
- 15.6.5. Solubility
- 15.6.6. End-use Industry
- 15.6.7. Distribution Channel
- 15.7. South Korea Bio-based Pigments Market
- 15.7.1. Country Segmental Analysis
- 15.7.2. Source
- 15.7.3. Pigment Type
- 15.7.4. Form
- 15.7.5. Solubility
- 15.7.6. End-use Industry
- 15.7.7. Distribution Channel
- 15.8. Australia and New Zealand Bio-based Pigments Market
- 15.8.1. Country Segmental Analysis
- 15.8.2. Source
- 15.8.3. Pigment Type
- 15.8.4. Form
- 15.8.5. Solubility
- 15.8.6. End-use Industry
- 15.8.7. Distribution Channel
- 15.9. Indonesia Bio-based Pigments Market
- 15.9.1. Country Segmental Analysis
- 15.9.2. Source
- 15.9.3. Pigment Type
- 15.9.4. Form
- 15.9.5. Solubility
- 15.9.6. End-use Industry
- 15.9.7. Distribution Channel
- 15.10. Malaysia Bio-based Pigments Market
- 15.10.1. Country Segmental Analysis
- 15.10.2. Source
- 15.10.3. Pigment Type
- 15.10.4. Form
- 15.10.5. Solubility
- 15.10.6. End-use Industry
- 15.10.7. Distribution Channel
- 15.11. Thailand Bio-based Pigments Market
- 15.11.1. Country Segmental Analysis
- 15.11.2. Source
- 15.11.3. Pigment Type
- 15.11.4. Form
- 15.11.5. Solubility
- 15.11.6. End-use Industry
- 15.11.7. Distribution Channel
- 15.12. Vietnam Bio-based Pigments Market
- 15.12.1. Country Segmental Analysis
- 15.12.2. Source
- 15.12.3. Pigment Type
- 15.12.4. Form
- 15.12.5. Solubility
- 15.12.6. End-use Industry
- 15.12.7. Distribution Channel
- 15.13. Rest of Asia Pacific Bio-based Pigments Market
- 15.13.1. Country Segmental Analysis
- 15.13.2. Source
- 15.13.3. Pigment Type
- 15.13.4. Form
- 15.13.5. Solubility
- 15.13.6. End-use Industry
- 15.13.7. Distribution Channel
- 16. Middle East Bio-based Pigments Market Analysis
- 16.1. Key Segment Analysis
- 16.2. Regional Snapshot
- 16.3. Middle East Bio-based Pigments Market Size (Volume - TONS and Value - US$ Bn), Analysis, and Forecasts, 2021-2035
- 16.3.1. Source
- 16.3.2. Pigment Type
- 16.3.3. Form
- 16.3.4. Solubility
- 16.3.5. End-use Industry
- 16.3.6. Distribution Channel
- 16.3.7. Country
- 16.3.7.1. Turkey
- 16.3.7.2. UAE
- 16.3.7.3. Saudi Arabia
- 16.3.7.4. Israel
- 16.3.7.5. Rest of Middle East
- 16.4. Turkey Bio-based Pigments Market
- 16.4.1. Country Segmental Analysis
- 16.4.2. Source
- 16.4.3. Pigment Type
- 16.4.4. Form
- 16.4.5. Solubility
- 16.4.6. End-use Industry
- 16.4.7. Distribution Channel
- 16.5. UAE Bio-based Pigments Market
- 16.5.1. Country Segmental Analysis
- 16.5.2. Source
- 16.5.3. Pigment Type
- 16.5.4. Form
- 16.5.5. Solubility
- 16.5.6. End-use Industry
- 16.5.7. Distribution Channel
- 16.6. Saudi Arabia Bio-based Pigments Market
- 16.6.1. Country Segmental Analysis
- 16.6.2. Source
- 16.6.3. Pigment Type
- 16.6.4. Form
- 16.6.5. Solubility
- 16.6.6. End-use Industry
- 16.6.7. Distribution Channel
- 16.7. Israel Bio-based Pigments Market
- 16.7.1. Country Segmental Analysis
- 16.7.2. Source
- 16.7.3. Pigment Type
- 16.7.4. Form
- 16.7.5. Solubility
- 16.7.6. End-use Industry
- 16.7.7. Distribution Channel
- 16.8. Rest of Middle East Bio-based Pigments Market
- 16.8.1. Country Segmental Analysis
- 16.8.2. Source
- 16.8.3. Pigment Type
- 16.8.4. Form
- 16.8.5. Solubility
- 16.8.6. End-use Industry
- 16.8.7. Distribution Channel
- 17. Africa Bio-based Pigments Market Analysis
- 17.1. Key Segment Analysis
- 17.2. Regional Snapshot
- 17.3. Africa Bio-based Pigments Market Size (Volume - TONS and Value - US$ Bn), Analysis, and Forecasts, 2021-2035
- 17.3.1. Source
- 17.3.2. Pigment Type
- 17.3.3. Form
- 17.3.4. Solubility
- 17.3.5. End-use Industry
- 17.3.6. Distribution Channel
- 17.3.7. Country
- 17.3.7.1. South Africa
- 17.3.7.2. Egypt
- 17.3.7.3. Nigeria
- 17.3.7.4. Algeria
- 17.3.7.5. Rest of Africa
- 17.4. South Africa Bio-based Pigments Market
- 17.4.1. Country Segmental Analysis
- 17.4.2. Source
- 17.4.3. Pigment Type
- 17.4.4. Form
- 17.4.5. Solubility
- 17.4.6. End-use Industry
- 17.4.7. Distribution Channel
- 17.5. Egypt Bio-based Pigments Market
- 17.5.1. Country Segmental Analysis
- 17.5.2. Source
- 17.5.3. Pigment Type
- 17.5.4. Form
- 17.5.5. Solubility
- 17.5.6. End-use Industry
- 17.5.7. Distribution Channel
- 17.6. Nigeria Bio-based Pigments Market
- 17.6.1. Country Segmental Analysis
- 17.6.2. Source
- 17.6.3. Pigment Type
- 17.6.4. Form
- 17.6.5. Solubility
- 17.6.6. End-use Industry
- 17.6.7. Distribution Channel
- 17.7. Algeria Bio-based Pigments Market
- 17.7.1. Country Segmental Analysis
- 17.7.2. Source
- 17.7.3. Pigment Type
- 17.7.4. Form
- 17.7.5. Solubility
- 17.7.6. End-use Industry
- 17.7.7. Distribution Channel
- 17.8. Rest of Africa Bio-based Pigments Market
- 17.8.1. Country Segmental Analysis
- 17.8.2. Source
- 17.8.3. Pigment Type
- 17.8.4. Form
- 17.8.5. Solubility
- 17.8.6. End-use Industry
- 17.8.7. Distribution Channel
- 18. South America Bio-based Pigments Market Analysis
- 18.1. Key Segment Analysis
- 18.2. Regional Snapshot
- 18.3. South America Bio-based Pigments Market Size (Volume - TONS and Value - US$ Bn), Analysis, and Forecasts, 2021-2035
- 18.3.1. Source
- 18.3.2. Pigment Type
- 18.3.3. Form
- 18.3.4. Solubility
- 18.3.5. End-use Industry
- 18.3.6. Distribution Channel
- 18.3.7. Country
- 18.3.7.1. Brazil
- 18.3.7.2. Argentina
- 18.3.7.3. Rest of South America
- 18.4. Brazil Bio-based Pigments Market
- 18.4.1. Country Segmental Analysis
- 18.4.2. Source
- 18.4.3. Pigment Type
- 18.4.4. Form
- 18.4.5. Solubility
- 18.4.6. End-use Industry
- 18.4.7. Distribution Channel
- 18.5. Argentina Bio-based Pigments Market
- 18.5.1. Country Segmental Analysis
- 18.5.2. Source
- 18.5.3. Pigment Type
- 18.5.4. Form
- 18.5.5. Solubility
- 18.5.6. End-use Industry
- 18.5.7. Distribution Channel
- 18.6. Rest of South America Bio-based Pigments Market
- 18.6.1. Country Segmental Analysis
- 18.6.2. Source
- 18.6.3. Pigment Type
- 18.6.4. Form
- 18.6.5. Solubility
- 18.6.6. End-use Industry
- 18.6.7. Distribution Channel
- 19. Key Players/ Company Profile
- 19.1. Algatech Ltd.
- 19.1.1. Company Details/ Overview
- 19.1.2. Company Financials
- 19.1.3. Key Customers and Competitors
- 19.1.4. Business/ Industry Portfolio
- 19.1.5. Product Portfolio/ Specification Details
- 19.1.6. Pricing Data
- 19.1.7. Strategic Overview
- 19.1.8. Recent Developments
- 19.2. Allied Biotech Corporation
- 19.3. Archer Daniels Midland Company (ADM)
- 19.4. BASF SE
- 19.5. BlueBioTech GmbH
- 19.6. Calyxt Inc.
- 19.7. Chr. Hansen Holding A/S
- 19.8. Colour Synthesis Solutions Ltd.
- 19.9. Cyanotech Corporation
- 19.10. DDW The Color House
- 19.11. Döhler GmbH
- 19.12. DSM-Firmenich AG
- 19.13. GNT Group B.V.
- 19.14. Kalsec Inc.
- 19.15. Lycored Ltd.
- 19.16. Naturex S.A. (Givaudan Group)
- 19.17. Phycom B.V.
- 19.18. Roha Group
- 19.19. San-Ei Gen F.F.I., Inc.
- 19.20. Sensient Technologies Corporation
- 19.21. Symrise AG
- 19.22. Other Key Players
- 19.1. Algatech Ltd.
Note* - This is just tentative list of players. While providing the report, we will cover more number of players based on their revenue and share for each geography
Research Design
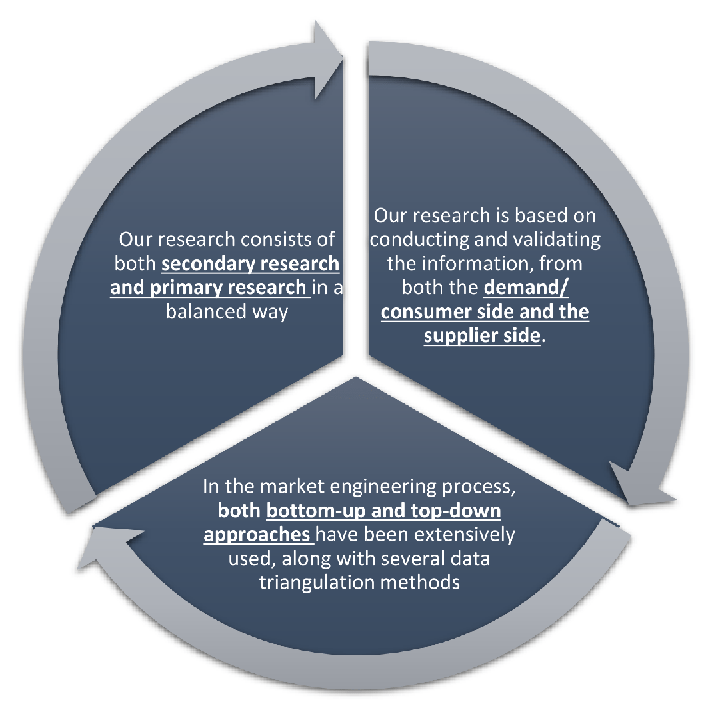
Our research design integrates both demand-side and supply-side analysis through a balanced combination of primary and secondary research methodologies. By utilizing both bottom-up and top-down approaches alongside rigorous data triangulation methods, we deliver robust market intelligence that supports strategic decision-making.
MarketGenics' comprehensive research design framework ensures the delivery of accurate, reliable, and actionable market intelligence. Through the integration of multiple research approaches, rigorous validation processes, and expert analysis, we provide our clients with the insights needed to make informed strategic decisions and capitalize on market opportunities.
MarketGenics leverages a dedicated industry panel of experts and a comprehensive suite of paid databases to effectively collect, consolidate, and analyze market intelligence.
Our approach has consistently proven to be reliable and effective in generating accurate market insights, identifying key industry trends, and uncovering emerging business opportunities.
Through both primary and secondary research, we capture and analyze critical company-level data such as manufacturing footprints, including technical centers, R&D facilities, sales offices, and headquarters.
Our expert panel further enhances our ability to estimate market size for specific brands based on validated field-level intelligence.
Our data mining techniques incorporate both parametric and non-parametric methods, allowing for structured data collection, sorting, processing, and cleaning.
Demand projections are derived from large-scale data sets analyzed through proprietary algorithms, culminating in robust and reliable market sizing.
Research Approach
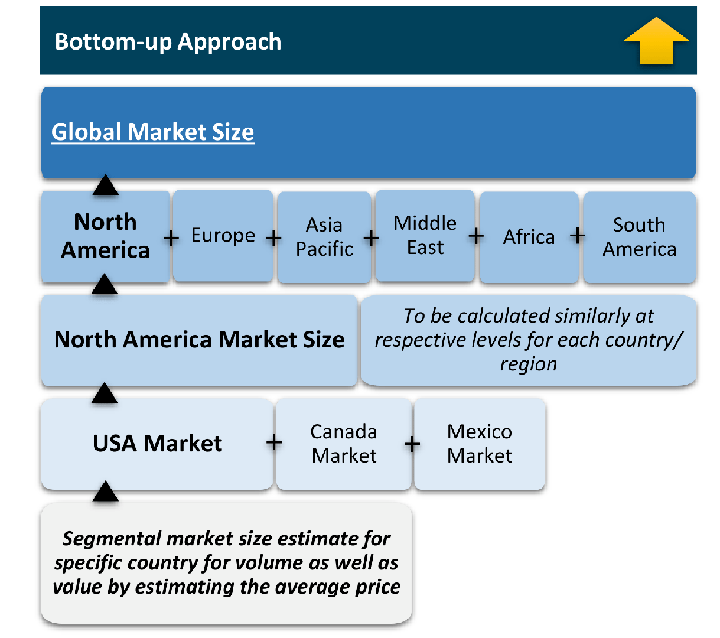
The bottom-up approach builds market estimates by starting with the smallest addressable market units and systematically aggregating them to create comprehensive market size projections.
This method begins with specific, granular data points and builds upward to create the complete market landscape.
Customer Analysis → Segmental Analysis → Geographical Analysis
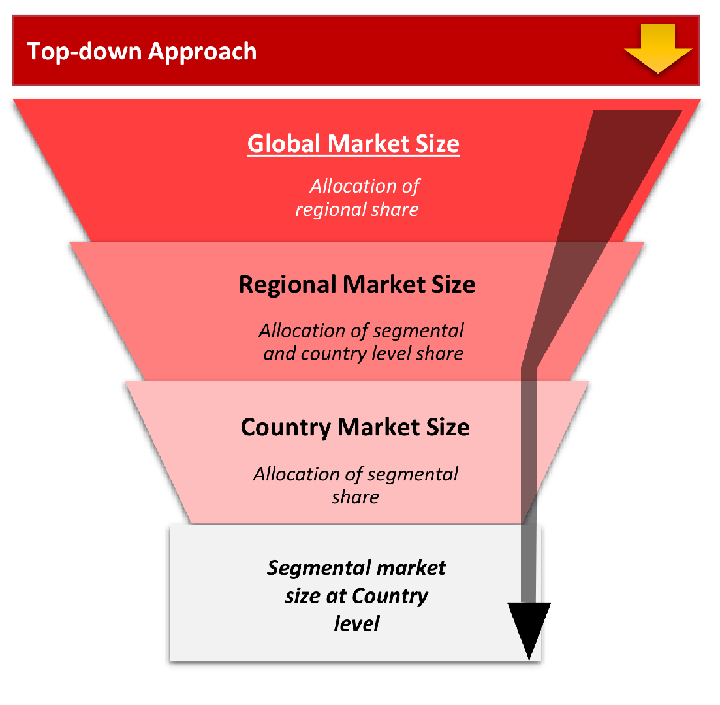
The top-down approach starts with the broadest possible market data and systematically narrows it down through a series of filters and assumptions to arrive at specific market segments or opportunities.
This method begins with the big picture and works downward to increasingly specific market slices.
TAM → SAM → SOM
Research Methods
Desk / Secondary Research
While analysing the market, we extensively study secondary sources, directories, and databases to identify and collect information useful for this technical, market-oriented, and commercial report. Secondary sources that we utilize are not only the public sources, but it is a combination of Open Source, Associations, Paid Databases, MG Repository & Knowledgebase, and others.
- Company websites, annual reports, financial reports, broker reports, and investor presentations
- National government documents, statistical databases and reports
- News articles, press releases and web-casts specific to the companies operating in the market, Magazines, reports, and others
- We gather information from commercial data sources for deriving company specific data such as segmental revenue, share for geography, product revenue, and others
- Internal and external proprietary databases (industry-specific), relevant patent, and regulatory databases
- Governing Bodies, Government Organizations
- Relevant Authorities, Country-specific Associations for Industries
We also employ the model mapping approach to estimate the product level market data through the players' product portfolio
Primary Research
Primary research/ interviews is vital in analyzing the market. Most of the cases involves paid primary interviews. Primary sources include primary interviews through e-mail interactions, telephonic interviews, surveys as well as face-to-face interviews with the different stakeholders across the value chain including several industry experts.
| Type of Respondents | Number of Primaries |
|---|---|
| Tier 2/3 Suppliers | ~20 |
| Tier 1 Suppliers | ~25 |
| End-users | ~25 |
| Industry Expert/ Panel/ Consultant | ~30 |
| Total | ~100 |
MG Knowledgebase
• Repository of industry blog, newsletter and case studies
• Online platform covering detailed market reports, and company profiles
Forecasting Factors and Models
Forecasting Factors
- Historical Trends – Past market patterns, cycles, and major events that shaped how markets behave over time. Understanding past trends helps predict future behavior.
- Industry Factors – Specific characteristics of the industry like structure, regulations, and innovation cycles that affect market dynamics.
- Macroeconomic Factors – Economic conditions like GDP growth, inflation, and employment rates that affect how much money people have to spend.
- Demographic Factors – Population characteristics like age, income, and location that determine who can buy your product.
- Technology Factors – How quickly people adopt new technology and how much technology infrastructure exists.
- Regulatory Factors – Government rules, laws, and policies that can help or restrict market growth.
- Competitive Factors – Analyzing competition structure such as degree of competition and bargaining power of buyers and suppliers.
Forecasting Models / Techniques
Multiple Regression Analysis
- Identify and quantify factors that drive market changes
- Statistical modeling to establish relationships between market drivers and outcomes
Time Series Analysis – Seasonal Patterns
- Understand regular cyclical patterns in market demand
- Advanced statistical techniques to separate trend, seasonal, and irregular components
Time Series Analysis – Trend Analysis
- Identify underlying market growth patterns and momentum
- Statistical analysis of historical data to project future trends
Expert Opinion – Expert Interviews
- Gather deep industry insights and contextual understanding
- In-depth interviews with key industry stakeholders
Multi-Scenario Development
- Prepare for uncertainty by modeling different possible futures
- Creating optimistic, pessimistic, and most likely scenarios
Time Series Analysis – Moving Averages
- Sophisticated forecasting for complex time series data
- Auto-regressive integrated moving average models with seasonal components
Econometric Models
- Apply economic theory to market forecasting
- Sophisticated economic models that account for market interactions
Expert Opinion – Delphi Method
- Harness collective wisdom of industry experts
- Structured, multi-round expert consultation process
Monte Carlo Simulation
- Quantify uncertainty and probability distributions
- Thousands of simulations with varying input parameters
Research Analysis
Our research framework is built upon the fundamental principle of validating market intelligence from both demand and supply perspectives. This dual-sided approach ensures comprehensive market understanding and reduces the risk of single-source bias.
Demand-Side Analysis: We understand end-user/application behavior, preferences, and market needs along with the penetration of the product for specific application.
Supply-Side Analysis: We estimate overall market revenue, analyze the segmental share along with industry capacity, competitive landscape, and market structure.
Validation & Evaluation
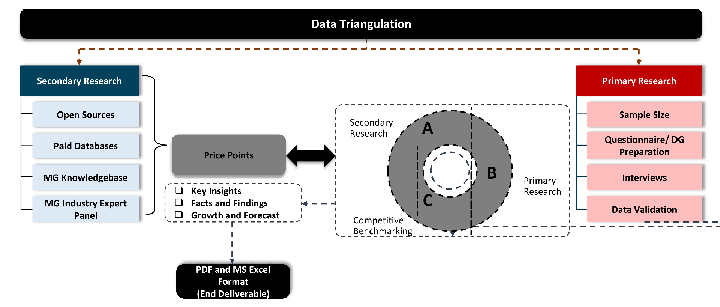
Data triangulation is a validation technique that uses multiple methods, sources, or perspectives to examine the same research question, thereby increasing the credibility and reliability of research findings. In market research, triangulation serves as a quality assurance mechanism that helps identify and minimize bias, validate assumptions, and ensure accuracy in market estimates.
- Data Source Triangulation – Using multiple data sources to examine the same phenomenon
- Methodological Triangulation – Using multiple research methods to study the same research question
- Investigator Triangulation – Using multiple researchers or analysts to examine the same data
- Theoretical Triangulation – Using multiple theoretical perspectives to interpret the same data
Custom Market Research Services
We will customise the research for you, in case the report listed above does not meet your requirements.
Get 10% Free Customisation