Demand Response Market Size, Share & Trends Analysis Report by Component (Hardware, Software, Services), Program Type, Technology, Solution Type, Deployment Mode, Load Type, Application/ Vertical, End-User and Geography (North America, Europe, Asia Pacific, Middle East, Africa, and South America) – Global Industry Data, Trends, and Forecasts, 2026–2035
|
Market Structure & Evolution |
|
|
Segmental Data Insights |
|
|
Demand Trends |
|
|
Competitive Landscape |
|
|
Strategic Development |
|
|
Future Outlook & Opportunities |
|
Demand Response Market Size, Share, and Growth
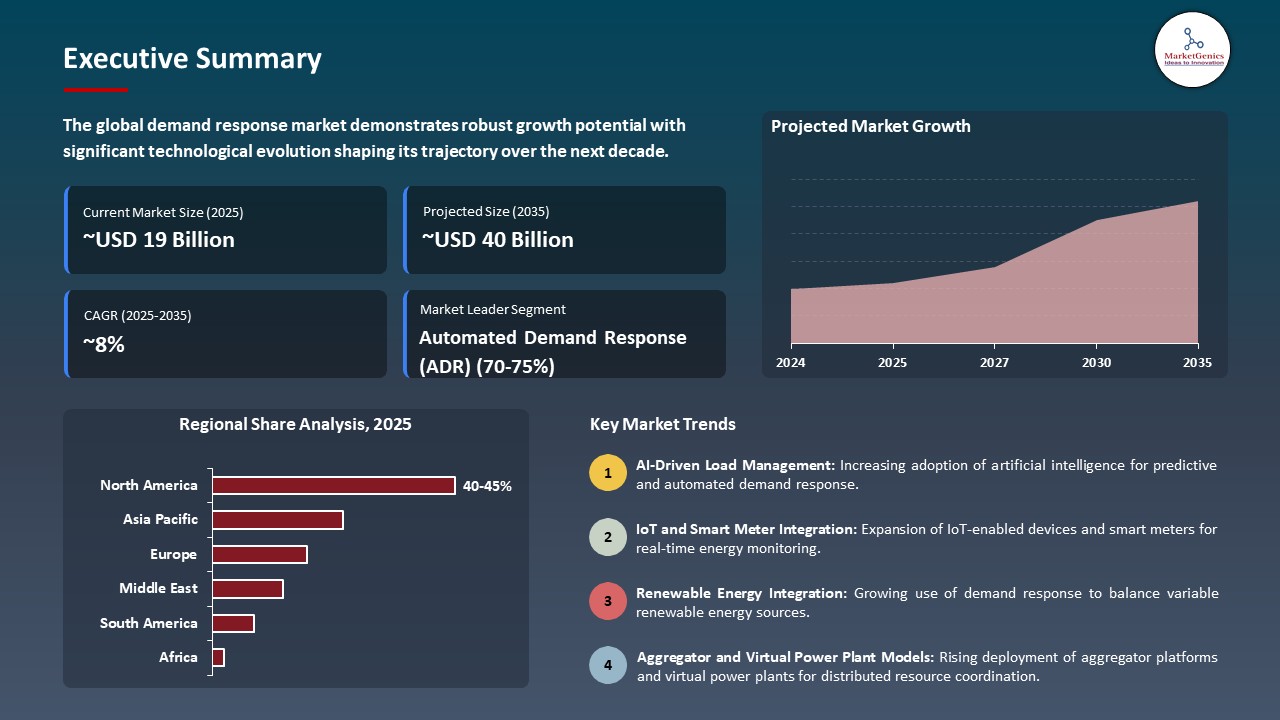
The global demand response market is experiencing robust growth, with its estimated value of USD 19.4 billion in the year 2025 and USD 40.2 billion by 2035, registering a CAGR of 7.6% during the forecast period.
The utility industry requires customer engagement because it must change operations to deliver reliable affordable and environmentally friendly energy service. The partnership between Xcel Energy and our company develops innovative AI-powered energy management solutions which provide customers with personalized energy usage advice and operational benefits to grid operators.
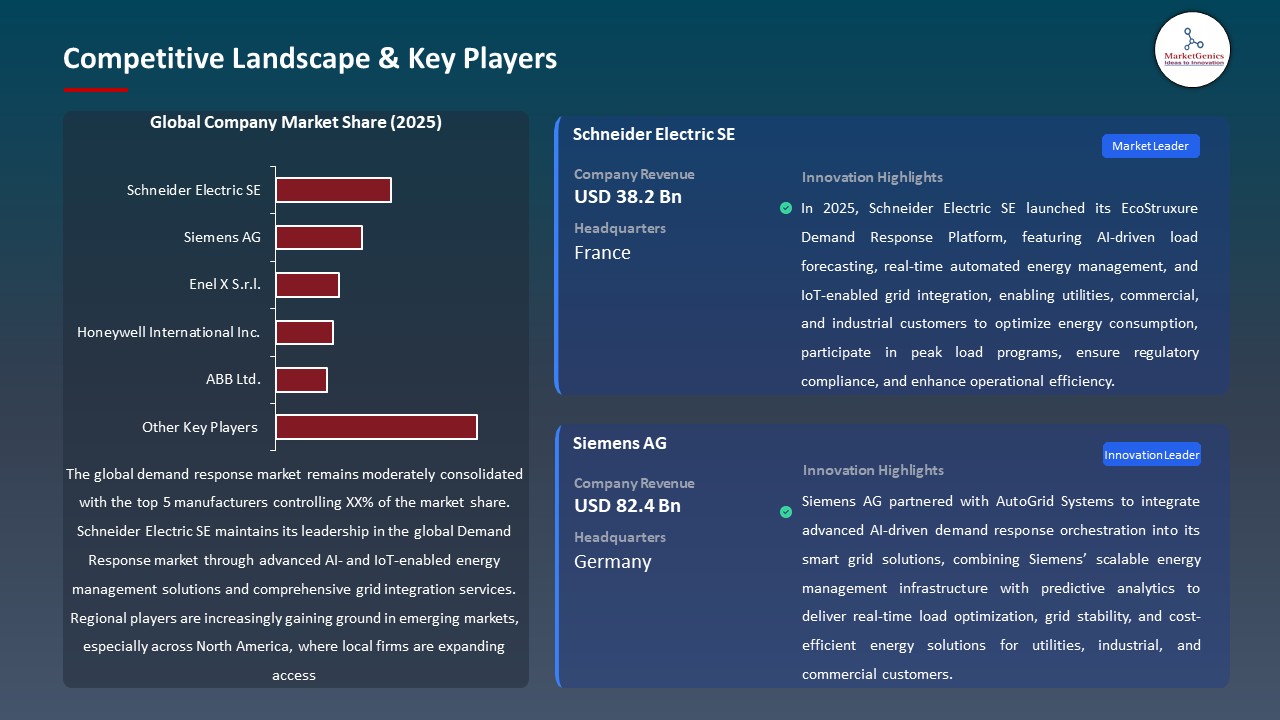
The global demand response market is experiencing rapid growth because multiple factors create demand for advanced automated systems which optimize energy use and maintain grid stability. Schneider Electric introduced its new AI-based demand response platform in September 2025 which uses real-time energy information and predictive modeling to control peak electricity demands, enabling utilities to save costs while delivering dependable service.
Demand response solutions have become more crucial because industries now adopt smart grids and electrification and renewable energy sources become more widespread. A major European utility used Siemens' next-generation virtual power plant platform, which launched in August 2025, to control peak demand through distributed energy resources.
Utilities are implementing advanced technologies because the U.S. Federal Energy Regulatory Commission (FERC) requires their demand response systems to participate in wholesale energy markets. The Demand Response market develops through technological improvements and policy backing and rising energy consumption, which enables grid systems to operate more efficiently while producing financial benefits and enhanced energy delivery.
The global demand response market provides multiple business opportunities, which include energy storage systems, instruments for ongoing energy monitoring, smart devices control through dynamic pricing, and grid-edge artificial intelligence analysis. Providers can use these adjacent markets to create better energy optimization products, which will lead to higher customer interaction.
Demand Response Market Dynamics and Trends
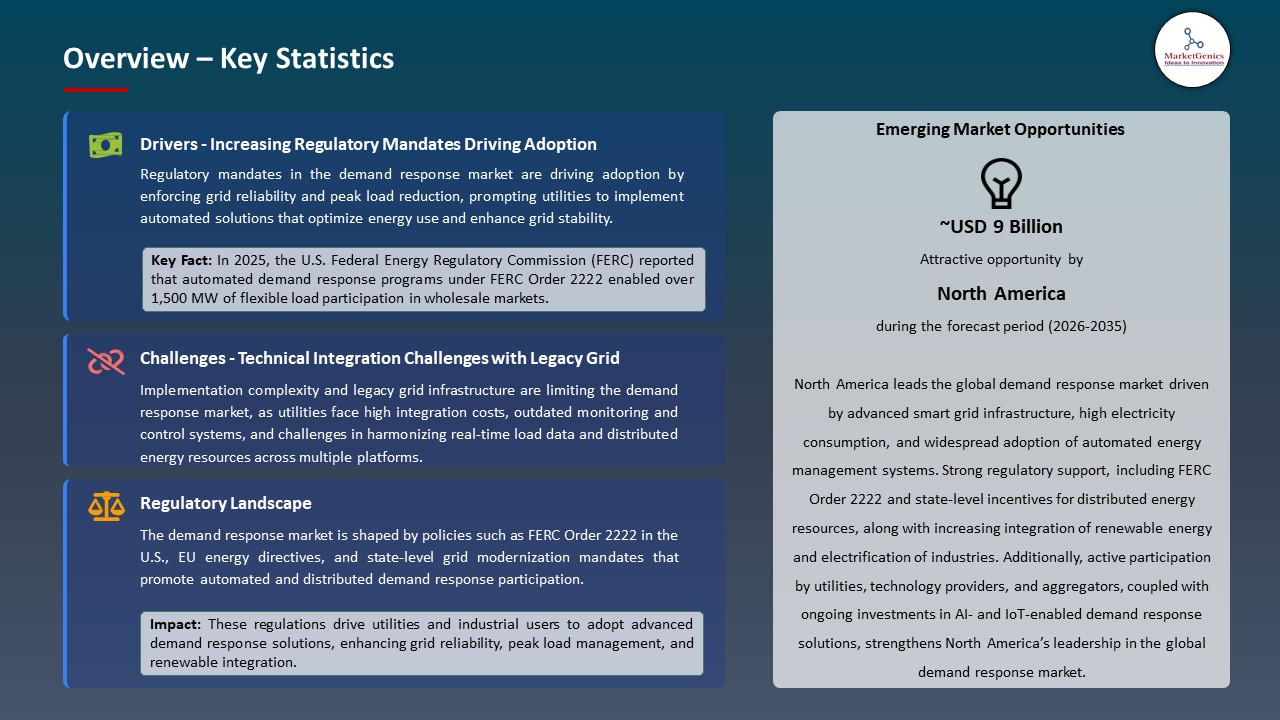
Driver: Increasing Regulatory Mandates Driving Adoption of Advanced Demand Response Systems
-
The demand response market is experiencing quick expansion because new regulatory frameworks across different countries establish resources for grid flexibility and clean energy technologies. The European Union and North America require utilities to use demand response resources for their planning processes which affects capacity markets, and this requirement compels businesses to develop systems that use advanced demand response automation for grid operations.
- The United States regulatory framework now allows smaller distributed energy resources to enter wholesale electricity markets through FERC Order 2222, which includes demand response systems that must establish sophisticated connections with grid operations.
- The increasing need for utilities to deliver grid flexibility during renewable energy development has created a rising demand for automated systems which use artificial intelligence to manage demand response and adjust power consumption in real time while ensuring customer comfort and adherence to data protection requirements. All these factors are likely to continue to escalate the growth of the demand response market.
Restraint: Technical Integration Challenges with Legacy Grid Infrastructure
-
The existing demand response systems face adoption challenges because their advanced technologies cannot work with the outdated grid systems that many regions still use. The majority of utilities continue to use their traditional monitoring and control systems which do not support real-time automated response and seamless data exchange between different systems.
- The conversion process to AI-enabled demand response platforms requires electricity providers to spend substantial funds on advanced metering infrastructure and communication systems and edge computing devices which creates financial challenges for smaller utilities and grid operators in developing countries.
- The current situation contains two main problems which create obstacles for demand response systems to reach their full operational capacity because organizations need to maintain reliable grid power and protect their systems against cyber threats while they operate their systems. All these elements are expected to restrict the expansion of the demand response market.
Opportunity: Emergence of Distributed Energy Resources and Aggregator Models
-
The convergence of distributed energy resources (DERs) such as rooftop solar, energy storage, and electric vehicles), with demand response solutions creates substantial prospects for increasing grid flexibility and achieving economical peak load management. Utilities and aggregators are creating programs which package DER flexibility together with demand response incentives to boost market participation.
- Technology companies and grid operators are forming partnerships which enable cloud-based demand response management platforms to operate, thus creating new revenue opportunities for software developers and third-party aggregators in both established and developing markets.
- Electrification trends and renewable energy increase create a need for flexible grid resources which vendors can satisfy through their advanced demand response solutions that include energy storage and real-time analytics, making demand response essential for developing future smart grid systems. All these advancements are likely to create more opportunities in future for demand response market.
Key Trend: Integration of AI, IoT, and Real‑Time Analytics Transforming Demand Response
-
The demand response market is undergoing transformation because artificial intelligence together with Internet of Things (IoT) technologies now provide tools for operators to handle dynamic demand and predict future power needs and control electrical loads which improves their ability to manage power grids and interact with customers.
- The real-time data analytics together with machine learning models work to enhance demand response performance through their ability to forecast peak demand times while they adjust power distribution across various assets which leads to better grid performance and decreased need for expensive power generation during peak hours.
- The combination of demand response with smart grid technologies which include advanced metering infrastructure and distributed energy management systems enables better electricity system resilience while achieving decarbonization through its capacity to manage power distribution and control decentralized energy resources. All these elements are expected to influence significant trends in the demand response market.
Demand Response Market Analysis and Segmental Data
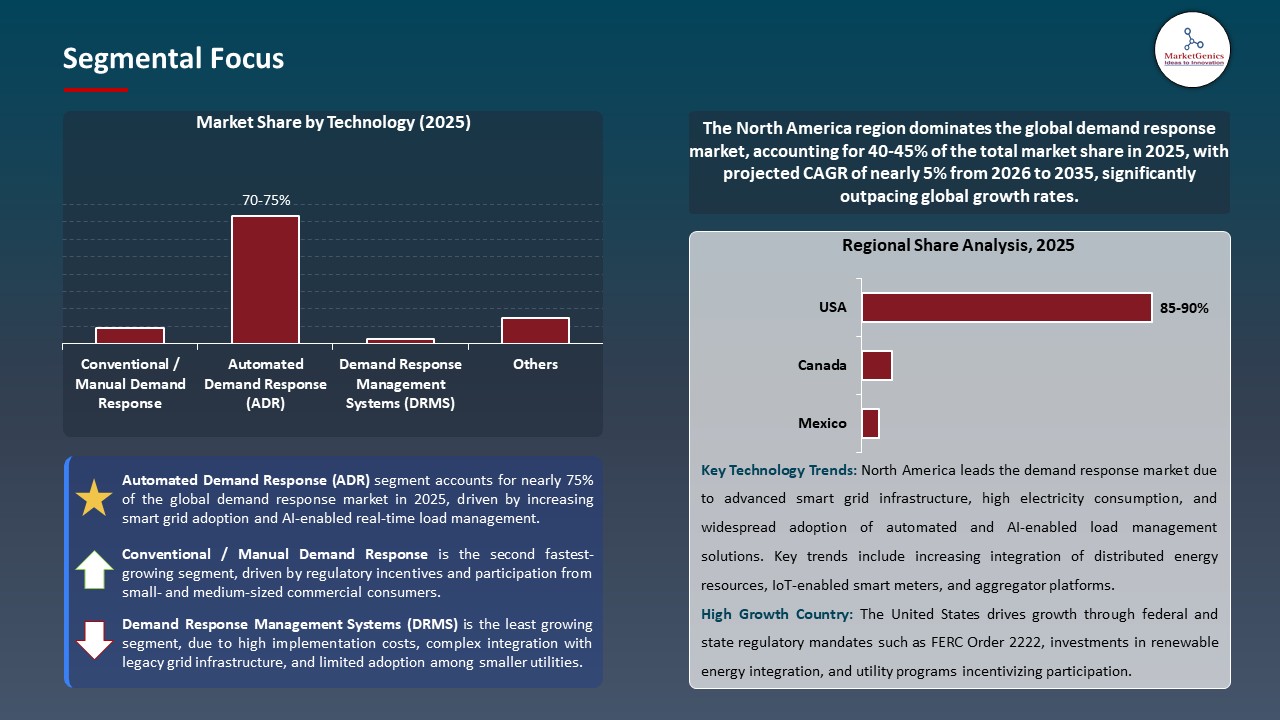
Automated Demand Response (ADR) Dominates Global Demand Response Market amid Rising Smart Grid Adoption and Regulatory Support
-
The global demand response market sees automated demand response (ADR) as the leading solution because of increasing smart grid usage and growing regulatory support for its main components. The combination of automated demand response and smart grid systems allows utilities to use real-time load control systems which help them create better energy balance between their electricity supply and customer needs while they work to increase renewable energy use.
- Regulatory frameworks now support automated demand response adoption because they enable more demand response resources to join both wholesale and ancillary markets, which also drives progress in grid modernization. The implementation of advanced communication protocols and standards enables different regions to achieve automatic system participation more efficiently.
- The Indian government will implement aggregator-based automated demand flexibility programs for large industrial and commercial users starting in 2025, thus demonstrating the ongoing dominance within the demand response market.
North America Dominates Global Demand Response Market amid Robust Smart Grid Infrastructure and Favorable Regulatory Frameworks
- North America leads the global demand response market because of its advanced smart grid systems and supportive regulatory environments which operate through multiple factors. The existing power networks of the region together with its extensive smart meter distribution system enable utilities to implement demand response solutions which improve grid reliability and help control peak electricity usage.
- Federal and state government programs create advantages for utilities and industrial customers who want to implement advanced demand response technologies through financial support and operational assistance. The combination of market maturity and existing utility programs leads to increased investments in technology and active participation from customers.
- Google established its 2026 contracts with various U.S. utilities to reduce data-center electricity consumption during peak periods through official demand response agreements which demonstrate effective execution of large-scale systems. The region's continual strengthening is current global leadership in demand response market.
Demand Response Market Ecosystem
The demand response market shows moderate consolidation because its main players Siemens AG and Schneider Electric and Honeywell and ABB and GE dominate the market with their extensive product range and international presence while AutoGrid and Enel X and CPower focus on serving specific market segments through regional operations.
The value chain includes two essential points which are solution development through software and hardware platform creation and service delivery through aggregation and grid integration processes. ABB will introduce its decentralized demand response controller system for industrial load balancing control in August 2025.
Recent Development and Strategic Overview:
- In July 2025, Constellation Energy and GridBeyond established their AI demand response program for the PJM grid region, which enables business customers to automatically change their energy usage during peak times through its predictive analytics and machine learning capabilities. The platform enables grid operators to achieve greater operational efficiency while decreasing operational expenses and protecting energy system resources through its automated demand response capabilities, which perform their functions without requiring human operators.
- In August 2025, Google signed official demand response contracts with multiple U.S. utilities including Indiana Michigan Power and the Tennessee Valley Authority, which will require its AI data centers to reduce or shift electricity consumption during periods of high demand. The project uses flexible load management techniques to maintain grid stability, which decreases the need for additional power generation resources, while demonstrating how demand response operates in contemporary energy systems.
Report Scope
|
Attribute |
Detail |
|
Market Size in 2025 |
USD 19.4 Bn |
|
Market Forecast Value in 2035 |
USD 40.2 Bn |
|
Growth Rate (CAGR) |
7.6% |
|
Forecast Period |
2026 – 2035 |
|
Historical Data Available for |
2021 – 2024 |
|
Market Size Units |
USD Bn for Value |
|
Report Format |
Electronic (PDF) + Excel |
|
Regions and Countries Covered |
|||||
|
North America |
Europe |
Asia Pacific |
Middle East |
Africa |
South America |
|
|
|
|
|
|
|
Companies Covered |
|||||
|
|
|
|
|
|
Demand Response Market Segmentation and Highlights
|
Segment |
Sub-segment |
|
Demand Response Market, By Component |
|
|
Demand Response Market, By Program Type |
|
|
Demand Response Market, By Technology |
|
|
Demand Response Market, By Solution Type |
|
|
Demand Response Market, By Deployment Mode |
|
|
Demand Response Market, By Load Type |
|
|
Demand Response Market, By Application/ Vertical |
|
|
Demand Response Market, By End-User |
|
Frequently Asked Questions
Table of Contents
- 1. Research Methodology and Assumptions
- 1.1. Definitions
- 1.2. Research Design and Approach
- 1.3. Data Collection Methods
- 1.4. Base Estimates and Calculations
- 1.5. Forecasting Models
- 1.5.1. Key Forecast Factors & Impact Analysis
- 1.6. Secondary Research
- 1.6.1. Open Sources
- 1.6.2. Paid Databases
- 1.6.3. Associations
- 1.7. Primary Research
- 1.7.1. Primary Sources
- 1.7.2. Primary Interviews with Stakeholders across Ecosystem
- 2. Executive Summary
- 2.1. Global Demand Response Market Outlook
- 2.1.1. Demand Response Market Size (Value - US$ Bn), and Forecasts, 2021-2035
- 2.1.2. Compounded Annual Growth Rate Analysis
- 2.1.3. Growth Opportunity Analysis
- 2.1.4. Segmental Share Analysis
- 2.1.5. Geographical Share Analysis
- 2.2. Market Analysis and Facts
- 2.3. Supply-Demand Analysis
- 2.4. Competitive Benchmarking
- 2.5. Go-to- Market Strategy
- 2.5.1. Customer/ End-use Industry Assessment
- 2.5.2. Growth Opportunity Data, 2026-2035
- 2.5.2.1. Regional Data
- 2.5.2.2. Country Data
- 2.5.2.3. Segmental Data
- 2.5.3. Identification of Potential Market Spaces
- 2.5.4. GAP Analysis
- 2.5.5. Potential Attractive Price Points
- 2.5.6. Prevailing Market Risks & Challenges
- 2.5.7. Preferred Sales & Marketing Strategies
- 2.5.8. Key Recommendations and Analysis
- 2.5.9. A Way Forward
- 2.1. Global Demand Response Market Outlook
- 3. Industry Data and Premium Insights
- 3.1. Global Energy & Power Industry Overview, 2025
- 3.1.1. Energy & Power Industry Analysis
- 3.1.2. Key Trends for Energy & Power Industry
- 3.1.3. Regional Distribution for Energy & Power Industry
- 3.2. Supplier Customer Data
- 3.3. Technology Roadmap and Developments
- 3.1. Global Energy & Power Industry Overview, 2025
- 4. Market Overview
- 4.1. Market Dynamics
- 4.1.1. Drivers
- 4.1.1.1. Increasing grid instability and peak load pressures driving utilities to adopt flexible demand-side management solutions.
- 4.1.1.2. Growing integration of renewable energy sources necessitating real-time demand balancing capabilities.
- 4.1.1.3. Supportive government policies and incentives promoting energy efficiency and smart grid adoption.
- 4.1.2. Restraints
- 4.1.2.1. Limited consumer awareness and participation reducing the effectiveness of demand response programs.
- 4.1.2.2. High initial investment in advanced metering infrastructure and communication systems.
- 4.1.1. Drivers
- 4.2. Key Trend Analysis
- 4.3. Regulatory Framework
- 4.3.1. Key Regulations, Norms, and Subsidies, by Key Countries
- 4.3.2. Tariffs and Standards
- 4.3.3. Impact Analysis of Regulations on the Market
- 4.4. Value Chain Analysis
- 4.4.1. Hardware/ Component Suppliers
- 4.4.2. Technology Providers
- 4.4.3. Demand Response Solution Providers
- 4.4.4. End Users
- 4.5. Porter’s Five Forces Analysis
- 4.6. PESTEL Analysis
- 4.7. Global Demand Response Market Demand
- 4.7.1. Historical Market Size – Value (US$ Bn), 2020-2024
- 4.7.2. Current and Future Market Size – Value (US$ Bn), 2026–2035
- 4.7.2.1. Y-o-Y Growth Trends
- 4.7.2.2. Absolute $ Opportunity Assessment
- 4.1. Market Dynamics
- 5. Competition Landscape
- 5.1. Competition structure
- 5.1.1. Fragmented v/s consolidated
- 5.2. Company Share Analysis, 2025
- 5.2.1. Global Company Market Share
- 5.2.2. By Region
- 5.2.2.1. North America
- 5.2.2.2. Europe
- 5.2.2.3. Asia Pacific
- 5.2.2.4. Middle East
- 5.2.2.5. Africa
- 5.2.2.6. South America
- 5.3. Product Comparison Matrix
- 5.3.1. Specifications
- 5.3.2. Market Positioning
- 5.3.3. Pricing
- 5.1. Competition structure
- 6. Global Demand Response Market Analysis, by Component
- 6.1. Key Segment Analysis
- 6.2. Demand Response Market Size (Value - US$ Bn), Analysis, and Forecasts, by Component, 2021-2035
- 6.2.1. Hardware
- 6.2.1.1. Smart Meters
- 6.2.1.2. Advanced Metering Infrastructure (AMI) Devices
- 6.2.1.3. Load Control Switches
- 6.2.1.4. Smart Thermostats
- 6.2.1.5. Smart Appliances
- 6.2.1.6. Intelligent Electronic Devices (IEDs)
- 6.2.1.7. Sensors & IoT Devices
- 6.2.1.8. Communication Gateways & Modems
- 6.2.1.9. Programmable Logic Controllers (PLCs)
- 6.2.1.10. Energy Storage Systems (Battery Hardware)
- 6.2.1.11. Others
- 6.2.2. Software
- 6.2.2.1. Demand Response Management Systems (DRMS)
- 6.2.2.2. Energy Management Systems (EMS)
- 6.2.2.3. Distributed Energy Resource Management Systems (DERMS)
- 6.2.2.4. Advanced Metering Infrastructure (AMI) Software
- 6.2.2.5. Load Forecasting & Analytics Software
- 6.2.2.6. Customer Engagement Platforms
- 6.2.2.7. Pricing & Billing Software
- 6.2.2.8. Virtual Power Plant (VPP) Platforms
- 6.2.2.9. Grid Optimization & Control Software
- 6.2.2.10. Cybersecurity Solutions
- 6.2.2.11. Others
- 6.2.3. Services
- 6.2.3.1. Consulting & Advisory Services
- 6.2.3.2. System Integration & Deployment
- 6.2.3.3. Program Design & Implementation
- 6.2.3.4. Curtailment Services
- 6.2.3.5. Managed Demand Response Services
- 6.2.3.6. Monitoring & Control Services
- 6.2.3.7. Operation & Maintenance (O&M)
- 6.2.3.8. Training & Support Services
- 6.2.3.9. Data Analytics & Reporting Services
- 6.2.3.10. Others
- 6.2.1. Hardware
- 7. Global Demand Response Market Analysis, by Program Type
- 7.1. Key Segment Analysis
- 7.2. Demand Response Market Size (Value - US$ Bn), Analysis, and Forecasts, by Program Type, 2021-2035
- 7.2.1. Price-Based Programs
- 7.2.2. Incentive-Based Programs
- 7.2.3. Time-Based Programs
- 7.2.4. Emergency Demand Response Programs
- 7.2.5. Direct Load Control Programs
- 7.2.6. Others
- 8. Global Demand Response Market Analysis, by Technology
- 8.1. Key Segment Analysis
- 8.2. Demand Response Market Size (Value - US$ Bn), Analysis, and Forecasts, by Technology, 2021-2035
- 8.2.1. Automated Demand Response (ADR)
- 8.2.2. Conventional / Manual Demand Response
- 8.2.3. Smart Metering Systems
- 8.2.4. Energy Management Systems (EMS)
- 8.2.5. Demand Response Management Systems (DRMS)
- 8.2.6. Others
- 9. Global Demand Response Market Analysis, by Solution Type
- 9.1. Key Segment Analysis
- 9.2. Demand Response Market Size (Value - US$ Bn), Analysis, and Forecasts, by Solution Type, 2021-2035
- 9.2.1. Residential Demand Response Management Systems
- 9.2.2. Commercial Demand Response Management Systems
- 9.2.3. Industrial Demand Response Management Systems
- 10. Global Demand Response Market Analysis, by Deployment Mode
- 10.1. Key Segment Analysis
- 10.2. Demand Response Market Size (Value - US$ Bn), Analysis, and Forecasts, by Deployment Mode, 2021-2035
- 10.2.1. On-Premises
- 10.2.2. Cloud-Based
- 10.2.3. Hybrid
- 11. Global Demand Response Market Analysis, by Load Type
- 11.1. Key Segment Analysis
- 11.2. Demand Response Market Size (Value - US$ Bn), Analysis, and Forecasts, by Ownership Model, 2021-2035
- 11.2.1. Peak Load Management
- 11.2.2. Base Load Management
- 11.2.3. Flexible Load Management
- 12. Global Demand Response Market Analysis and Forecasts, by Application/ Vertical
- 12.1. Key Findings
- 12.2. Demand Response Market Size (Value - US$ Bn), Analysis, and Forecasts, by Application/ Vertical, 2021-2035
- 12.2.1. Energy & Utilities
- 12.2.2. Manufacturing
- 12.2.3. Commercial Buildings
- 12.2.4. Municipal, University, School & Hospital (MUSH)
- 12.2.5. Agriculture
- 12.2.6. IT & Telecom
- 12.2.7. Healthcare
- 12.2.8. Others
- 13. Global Demand Response Market Analysis and Forecasts, by End-User
- 13.1. Key Findings
- 13.2. Demand Response Market Size (Value - US$ Bn), Analysis, and Forecasts, by End-User, 2021-2035
- 13.2.1. Residential
- 13.2.2. Commercial
- 13.2.3. Industrial
- 13.2.4. Utilities
- 13.2.5. Government & Public Sector
- 14. Global Demand Response Market Analysis and Forecasts, by Region
- 14.1. Key Findings
- 14.2. Demand Response Market Size (Value - US$ Bn), Analysis, and Forecasts, by Region, 2021-2035
- 14.2.1. North America
- 14.2.2. Europe
- 14.2.3. Asia Pacific
- 14.2.4. Middle East
- 14.2.5. Africa
- 14.2.6. South America
- 15. North America Demand Response Market Analysis
- 15.1. Key Segment Analysis
- 15.2. Regional Snapshot
- 15.3. North America Demand Response Market Size (Value - US$ Bn), Analysis, and Forecasts, 2021-2035
- 15.3.1. Component
- 15.3.2. Program Type
- 15.3.3. Technology
- 15.3.4. Solution Type
- 15.3.5. Deployment Mode
- 15.3.6. Load Type
- 15.3.7. Application/ Vertical
- 15.3.8. End-User
- 15.3.9. Country
- 15.3.9.1. USA
- 15.3.9.2. Canada
- 15.3.9.3. Mexico
- 15.4. USA Demand Response Market
- 15.4.1. Country Segmental Analysis
- 15.4.2. Component
- 15.4.3. Program Type
- 15.4.4. Technology
- 15.4.5. Solution Type
- 15.4.6. Deployment Mode
- 15.4.7. Load Type
- 15.4.8. Application/ Vertical
- 15.4.9. End-User
- 15.5. Canada Demand Response Market
- 15.5.1. Country Segmental Analysis
- 15.5.2. Component
- 15.5.3. Program Type
- 15.5.4. Technology
- 15.5.5. Solution Type
- 15.5.6. Deployment Mode
- 15.5.7. Load Type
- 15.5.8. Application/ Vertical
- 15.5.9. End-User
- 15.6. Mexico Demand Response Market
- 15.6.1. Country Segmental Analysis
- 15.6.2. Component
- 15.6.3. Program Type
- 15.6.4. Technology
- 15.6.5. Solution Type
- 15.6.6. Deployment Mode
- 15.6.7. Load Type
- 15.6.8. Application/ Vertical
- 15.6.9. End-User
- 16. Europe Demand Response Market Analysis
- 16.1. Key Segment Analysis
- 16.2. Regional Snapshot
- 16.3. Europe Demand Response Market Size (Value - US$ Bn), Analysis, and Forecasts, 2021-2035
- 16.3.1. Component
- 16.3.2. Program Type
- 16.3.3. Technology
- 16.3.4. Solution Type
- 16.3.5. Deployment Mode
- 16.3.6. Load Type
- 16.3.7. Application/ Vertical
- 16.3.8. End-User
- 16.3.9. Country
- 16.3.9.1. Germany
- 16.3.9.2. United Kingdom
- 16.3.9.3. France
- 16.3.9.4. Italy
- 16.3.9.5. Spain
- 16.3.9.6. Netherlands
- 16.3.9.7. Nordic Countries
- 16.3.9.8. Poland
- 16.3.9.9. Russia & CIS
- 16.3.9.10. Rest of Europe
- 16.4. Germany Demand Response Market
- 16.4.1. Country Segmental Analysis
- 16.4.2. Component
- 16.4.3. Program Type
- 16.4.4. Technology
- 16.4.5. Solution Type
- 16.4.6. Deployment Mode
- 16.4.7. Load Type
- 16.4.8. Application/ Vertical
- 16.4.9. End-User
- 16.5. United Kingdom Demand Response Market
- 16.5.1. Country Segmental Analysis
- 16.5.2. Component
- 16.5.3. Program Type
- 16.5.4. Technology
- 16.5.5. Solution Type
- 16.5.6. Deployment Mode
- 16.5.7. Load Type
- 16.5.8. Application/ Vertical
- 16.5.9. End-User
- 16.6. France Demand Response Market
- 16.6.1. Country Segmental Analysis
- 16.6.2. Component
- 16.6.3. Program Type
- 16.6.4. Technology
- 16.6.5. Solution Type
- 16.6.6. Deployment Mode
- 16.6.7. Load Type
- 16.6.8. Application/ Vertical
- 16.6.9. End-User
- 16.7. Italy Demand Response Market
- 16.7.1. Country Segmental Analysis
- 16.7.2. Component
- 16.7.3. Program Type
- 16.7.4. Technology
- 16.7.5. Solution Type
- 16.7.6. Deployment Mode
- 16.7.7. Load Type
- 16.7.8. Application/ Vertical
- 16.7.9. End-User
- 16.8. Spain Demand Response Market
- 16.8.1. Country Segmental Analysis
- 16.8.2. Component
- 16.8.3. Program Type
- 16.8.4. Technology
- 16.8.5. Solution Type
- 16.8.6. Deployment Mode
- 16.8.7. Load Type
- 16.8.8. Application/ Vertical
- 16.8.9. End-User
- 16.9. Netherlands Demand Response Market
- 16.9.1. Country Segmental Analysis
- 16.9.2. Component
- 16.9.3. Program Type
- 16.9.4. Technology
- 16.9.5. Solution Type
- 16.9.6. Deployment Mode
- 16.9.7. Load Type
- 16.9.8. Application/ Vertical
- 16.9.9. End-User
- 16.10. Nordic Countries Demand Response Market
- 16.10.1. Country Segmental Analysis
- 16.10.2. Component
- 16.10.3. Program Type
- 16.10.4. Technology
- 16.10.5. Solution Type
- 16.10.6. Deployment Mode
- 16.10.7. Load Type
- 16.10.8. Application/ Vertical
- 16.10.9. End-User
- 16.11. Poland Demand Response Market
- 16.11.1. Country Segmental Analysis
- 16.11.2. Component
- 16.11.3. Program Type
- 16.11.4. Technology
- 16.11.5. Solution Type
- 16.11.6. Deployment Mode
- 16.11.7. Load Type
- 16.11.8. Application/ Vertical
- 16.11.9. End-User
- 16.12. Russia & CIS Demand Response Market
- 16.12.1. Country Segmental Analysis
- 16.12.2. Component
- 16.12.3. Program Type
- 16.12.4. Technology
- 16.12.5. Solution Type
- 16.12.6. Deployment Mode
- 16.12.7. Load Type
- 16.12.8. Application/ Vertical
- 16.12.9. End-User
- 16.13. Rest of Europe Demand Response Market
- 16.13.1. Country Segmental Analysis
- 16.13.2. Component
- 16.13.3. Program Type
- 16.13.4. Technology
- 16.13.5. Solution Type
- 16.13.6. Deployment Mode
- 16.13.7. Load Type
- 16.13.8. Application/ Vertical
- 16.13.9. End-User
- 17. Asia Pacific Demand Response Market Analysis
- 17.1. Key Segment Analysis
- 17.2. Regional Snapshot
- 17.3. Asia Pacific Demand Response Market Size (Value - US$ Bn), Analysis, and Forecasts, 2021-2035
- 17.3.1. Component
- 17.3.2. Program Type
- 17.3.3. Technology
- 17.3.4. Solution Type
- 17.3.5. Deployment Mode
- 17.3.6. Load Type
- 17.3.7. Application/ Vertical
- 17.3.8. End-User
- 17.3.9. Country
- 17.3.9.1. China
- 17.3.9.2. India
- 17.3.9.3. Japan
- 17.3.9.4. South Korea
- 17.3.9.5. Australia and New Zealand
- 17.3.9.6. Indonesia
- 17.3.9.7. Malaysia
- 17.3.9.8. Thailand
- 17.3.9.9. Vietnam
- 17.3.9.10. Rest of Asia Pacific
- 17.4. China Demand Response Market
- 17.4.1. Country Segmental Analysis
- 17.4.2. Component
- 17.4.3. Program Type
- 17.4.4. Technology
- 17.4.5. Solution Type
- 17.4.6. Deployment Mode
- 17.4.7. Load Type
- 17.4.8. Application/ Vertical
- 17.4.9. End-User
- 17.5. India Demand Response Market
- 17.5.1. Country Segmental Analysis
- 17.5.2. Component
- 17.5.3. Program Type
- 17.5.4. Technology
- 17.5.5. Solution Type
- 17.5.6. Deployment Mode
- 17.5.7. Load Type
- 17.5.8. Application/ Vertical
- 17.5.9. End-User
- 17.6. Japan Demand Response Market
- 17.6.1. Country Segmental Analysis
- 17.6.2. Component
- 17.6.3. Program Type
- 17.6.4. Technology
- 17.6.5. Solution Type
- 17.6.6. Deployment Mode
- 17.6.7. Load Type
- 17.6.8. Application/ Vertical
- 17.6.9. End-User
- 17.7. South Korea Demand Response Market
- 17.7.1. Country Segmental Analysis
- 17.7.2. Component
- 17.7.3. Program Type
- 17.7.4. Technology
- 17.7.5. Solution Type
- 17.7.6. Deployment Mode
- 17.7.7. Load Type
- 17.7.8. Application/ Vertical
- 17.7.9. End-User
- 17.8. Australia and New Zealand Demand Response Market
- 17.8.1. Country Segmental Analysis
- 17.8.2. Component
- 17.8.3. Program Type
- 17.8.4. Technology
- 17.8.5. Solution Type
- 17.8.6. Deployment Mode
- 17.8.7. Load Type
- 17.8.8. Application/ Vertical
- 17.8.9. End-User
- 17.9. Indonesia Demand Response Market
- 17.9.1. Country Segmental Analysis
- 17.9.2. Component
- 17.9.3. Program Type
- 17.9.4. Technology
- 17.9.5. Solution Type
- 17.9.6. Deployment Mode
- 17.9.7. Load Type
- 17.9.8. Application/ Vertical
- 17.9.9. End-User
- 17.10. Malaysia Demand Response Market
- 17.10.1. Country Segmental Analysis
- 17.10.2. Component
- 17.10.3. Program Type
- 17.10.4. Technology
- 17.10.5. Solution Type
- 17.10.6. Deployment Mode
- 17.10.7. Load Type
- 17.10.8. Application/ Vertical
- 17.10.9. End-User
- 17.11. Thailand Demand Response Market
- 17.11.1. Country Segmental Analysis
- 17.11.2. Component
- 17.11.3. Program Type
- 17.11.4. Technology
- 17.11.5. Solution Type
- 17.11.6. Deployment Mode
- 17.11.7. Load Type
- 17.11.8. Application/ Vertical
- 17.11.9. End-User
- 17.12. Vietnam Demand Response Market
- 17.12.1. Country Segmental Analysis
- 17.12.2. Component
- 17.12.3. Program Type
- 17.12.4. Technology
- 17.12.5. Solution Type
- 17.12.6. Deployment Mode
- 17.12.7. Load Type
- 17.12.8. Application/ Vertical
- 17.12.9. End-User
- 17.13. Rest of Asia Pacific Demand Response Market
- 17.13.1. Country Segmental Analysis
- 17.13.2. Component
- 17.13.3. Program Type
- 17.13.4. Technology
- 17.13.5. Solution Type
- 17.13.6. Deployment Mode
- 17.13.7. Load Type
- 17.13.8. Application/ Vertical
- 17.13.9. End-User
- 18. Middle East Demand Response Market Analysis
- 18.1. Key Segment Analysis
- 18.2. Regional Snapshot
- 18.3. Middle East Demand Response Market Size (Value - US$ Bn), Analysis, and Forecasts, 2021-2035
- 18.3.1. Component
- 18.3.2. Program Type
- 18.3.3. Technology
- 18.3.4. Solution Type
- 18.3.5. Deployment Mode
- 18.3.6. Load Type
- 18.3.7. Application/ Vertical
- 18.3.8. End-User
- 18.3.9. Country
- 18.3.9.1. Turkey
- 18.3.9.2. UAE
- 18.3.9.3. Saudi Arabia
- 18.3.9.4. Israel
- 18.3.9.5. Rest of Middle East
- 18.4. Turkey Demand Response Market
- 18.4.1. Country Segmental Analysis
- 18.4.2. Component
- 18.4.3. Program Type
- 18.4.4. Technology
- 18.4.5. Solution Type
- 18.4.6. Deployment Mode
- 18.4.7. Load Type
- 18.4.8. Application/ Vertical
- 18.4.9. End-User
- 18.5. UAE Demand Response Market
- 18.5.1. Country Segmental Analysis
- 18.5.2. Component
- 18.5.3. Program Type
- 18.5.4. Technology
- 18.5.5. Solution Type
- 18.5.6. Deployment Mode
- 18.5.7. Load Type
- 18.5.8. Application/ Vertical
- 18.5.9. End-User
- 18.6. Saudi Arabia Demand Response Market
- 18.6.1. Country Segmental Analysis
- 18.6.2. Component
- 18.6.3. Program Type
- 18.6.4. Technology
- 18.6.5. Solution Type
- 18.6.6. Deployment Mode
- 18.6.7. Load Type
- 18.6.8. Application/ Vertical
- 18.6.9. End-User
- 18.7. Israel Demand Response Market
- 18.7.1. Country Segmental Analysis
- 18.7.2. Component
- 18.7.3. Program Type
- 18.7.4. Technology
- 18.7.5. Solution Type
- 18.7.6. Deployment Mode
- 18.7.7. Load Type
- 18.7.8. Application/ Vertical
- 18.7.9. End-User
- 18.8. Rest of Middle East Demand Response Market
- 18.8.1. Country Segmental Analysis
- 18.8.2. Component
- 18.8.3. Program Type
- 18.8.4. Technology
- 18.8.5. Solution Type
- 18.8.6. Deployment Mode
- 18.8.7. Load Type
- 18.8.8. Application/ Vertical
- 18.8.9. End-User
- 19. Africa Demand Response Market Analysis
- 19.1. Key Segment Analysis
- 19.2. Regional Snapshot
- 19.3. Africa Demand Response Market Size (Value - US$ Bn), Analysis, and Forecasts, 2021-2035
- 19.3.1. Component
- 19.3.2. Program Type
- 19.3.3. Technology
- 19.3.4. Solution Type
- 19.3.5. Deployment Mode
- 19.3.6. Load Type
- 19.3.7. Application/ Vertical
- 19.3.8. End-User
- 19.3.9. Country
- 19.3.9.1. South Africa
- 19.3.9.2. Egypt
- 19.3.9.3. Nigeria
- 19.3.9.4. Algeria
- 19.3.9.5. Rest of Africa
- 19.4. South Africa Demand Response Market
- 19.4.1. Country Segmental Analysis
- 19.4.2. Component
- 19.4.3. Program Type
- 19.4.4. Technology
- 19.4.5. Solution Type
- 19.4.6. Deployment Mode
- 19.4.7. Load Type
- 19.4.8. Application/ Vertical
- 19.4.9. End-User
- 19.5. Egypt Demand Response Market
- 19.5.1. Country Segmental Analysis
- 19.5.2. Component
- 19.5.3. Program Type
- 19.5.4. Technology
- 19.5.5. Solution Type
- 19.5.6. Deployment Mode
- 19.5.7. Load Type
- 19.5.8. Application/ Vertical
- 19.5.9. End-User
- 19.6. Nigeria Demand Response Market
- 19.6.1. Country Segmental Analysis
- 19.6.2. Component
- 19.6.3. Program Type
- 19.6.4. Technology
- 19.6.5. Solution Type
- 19.6.6. Deployment Mode
- 19.6.7. Load Type
- 19.6.8. Application/ Vertical
- 19.6.9. End-User
- 19.7. Algeria Demand Response Market
- 19.7.1. Country Segmental Analysis
- 19.7.2. Component
- 19.7.3. Program Type
- 19.7.4. Technology
- 19.7.5. Solution Type
- 19.7.6. Deployment Mode
- 19.7.7. Load Type
- 19.7.8. Application/ Vertical
- 19.7.9. End-User
- 19.8. Rest of Africa Demand Response Market
- 19.8.1. Country Segmental Analysis
- 19.8.2. Component
- 19.8.3. Program Type
- 19.8.4. Technology
- 19.8.5. Solution Type
- 19.8.6. Deployment Mode
- 19.8.7. Load Type
- 19.8.8. Application/ Vertical
- 19.8.9. End-User
- 20. South America Demand Response Market Analysis
- 20.1. Key Segment Analysis
- 20.2. Regional Snapshot
- 20.3. South America Demand Response Market Size (Value - US$ Bn), Analysis, and Forecasts, 2021-2035
- 20.3.1. Component
- 20.3.2. Program Type
- 20.3.3. Technology
- 20.3.4. Solution Type
- 20.3.5. Deployment Mode
- 20.3.6. Load Type
- 20.3.7. Application/ Vertical
- 20.3.8. End-User
- 20.3.9. Country
- 20.3.9.1. Brazil
- 20.3.9.2. Argentina
- 20.3.9.3. Rest of South America
- 20.4. Brazil Demand Response Market
- 20.4.1. Country Segmental Analysis
- 20.4.2. Component
- 20.4.3. Program Type
- 20.4.4. Technology
- 20.4.5. Solution Type
- 20.4.6. Deployment Mode
- 20.4.7. Load Type
- 20.4.8. Application/ Vertical
- 20.4.9. End-User
- 20.5. Argentina Demand Response Market
- 20.5.1. Country Segmental Analysis
- 20.5.2. Component
- 20.5.3. Program Type
- 20.5.4. Technology
- 20.5.5. Solution Type
- 20.5.6. Deployment Mode
- 20.5.7. Load Type
- 20.5.8. Application/ Vertical
- 20.5.9. End-User
- 20.6. Rest of South America Demand Response Market
- 20.6.1. Country Segmental Analysis
- 20.6.2. Component
- 20.6.3. Program Type
- 20.6.4. Technology
- 20.6.5. Solution Type
- 20.6.6. Deployment Mode
- 20.6.7. Load Type
- 20.6.8. Application/ Vertical
- 20.6.9. End-User
- 21. Key Players/ Company Profile
- 21.1. ABB Ltd.
- 21.1.1. Company Details/ Overview
- 21.1.2. Company Financials
- 21.1.3. Key Customers and Competitors
- 21.1.4. Business/ Industry Portfolio
- 21.1.5. Product Portfolio/ Specification Details
- 21.1.6. Pricing Data
- 21.1.7. Strategic Overview
- 21.1.8. Recent Developments
- 21.2. AutoGrid Systems, Inc.
- 21.3. Cisco Systems, Inc.
- 21.4. Comverge, Inc.
- 21.5. CPower Energy Management
- 21.6. Eaton Corporation plc
- 21.7. Enel X S.r.l.
- 21.8. EnergyHub, Inc.
- 21.9. EnerNOC, Inc. (Enel Group)
- 21.10. General Electric Company
- 21.11. GridPoint, Inc.
- 21.12. Honeywell International Inc.
- 21.13. International Business Machines Corporation (IBM)
- 21.14. Itron, Inc.
- 21.15. Johnson Controls International plc
- 21.16. Landis+Gyr AG
- 21.17. Oracle Corporation
- 21.18. Schneider Electric SE
- 21.19. Siemens AG
- 21.20. Voltus, Inc.
- 21.21. Other Key Players
- 21.1. ABB Ltd.
Note* - This is just tentative list of players. While providing the report, we will cover more number of players based on their revenue and share for each geography
Research Design
Our research design integrates both demand-side and supply-side analysis through a balanced combination of primary and secondary research methodologies. By utilizing both bottom-up and top-down approaches alongside rigorous data triangulation methods, we deliver robust market intelligence that supports strategic decision-making.
MarketGenics' comprehensive research design framework ensures the delivery of accurate, reliable, and actionable market intelligence. Through the integration of multiple research approaches, rigorous validation processes, and expert analysis, we provide our clients with the insights needed to make informed strategic decisions and capitalize on market opportunities.

MarketGenics leverages a dedicated industry panel of experts and a comprehensive suite of paid databases to effectively collect, consolidate, and analyze market intelligence.
Our approach has consistently proven to be reliable and effective in generating accurate market insights, identifying key industry trends, and uncovering emerging business opportunities.
Through both primary and secondary research, we capture and analyze critical company-level data such as manufacturing footprints, including technical centers, R&D facilities, sales offices, and headquarters.
Our expert panel further enhances our ability to estimate market size for specific brands based on validated field-level intelligence.
Our data mining techniques incorporate both parametric and non-parametric methods, allowing for structured data collection, sorting, processing, and cleaning.
Demand projections are derived from large-scale data sets analyzed through proprietary algorithms, culminating in robust and reliable market sizing.
Research Approach
The bottom-up approach builds market estimates by starting with the smallest addressable market units and systematically aggregating them to create comprehensive market size projections.
This method begins with specific, granular data points and builds upward to create the complete market landscape.
Customer Analysis → Segmental Analysis → Geographical Analysis
The top-down approach starts with the broadest possible market data and systematically narrows it down through a series of filters and assumptions to arrive at specific market segments or opportunities.
This method begins with the big picture and works downward to increasingly specific market slices.
TAM → SAM → SOM


Research Methods
Desk / Secondary Research
While analysing the market, we extensively study secondary sources, directories, and databases to identify and collect information useful for this technical, market-oriented, and commercial report. Secondary sources that we utilize are not only the public sources, but it is a combination of Open Source, Associations, Paid Databases, MG Repository & Knowledgebase, and others.
- Company websites, annual reports, financial reports, broker reports, and investor presentations
- National government documents, statistical databases and reports
- News articles, press releases and web-casts specific to the companies operating in the market, Magazines, reports, and others
- We gather information from commercial data sources for deriving company specific data such as segmental revenue, share for geography, product revenue, and others
- Internal and external proprietary databases (industry-specific), relevant patent, and regulatory databases
- Governing Bodies, Government Organizations
- Relevant Authorities, Country-specific Associations for Industries
We also employ the model mapping approach to estimate the product level market data through the players' product portfolio
Primary Research
Primary research/ interviews is vital in analyzing the market. Most of the cases involves paid primary interviews. Primary sources include primary interviews through e-mail interactions, telephonic interviews, surveys as well as face-to-face interviews with the different stakeholders across the value chain including several industry experts.
| Type of Respondents | Number of Primaries |
|---|---|
| Tier 2/3 Suppliers | ~20 |
| Tier 1 Suppliers | ~25 |
| End-users | ~25 |
| Industry Expert/ Panel/ Consultant | ~30 |
| Total | ~100 |
MG Knowledgebase
• Repository of industry blog, newsletter and case studies
• Online platform covering detailed market reports, and company profiles
Forecasting Factors and Models
Forecasting Factors
- Historical Trends – Past market patterns, cycles, and major events that shaped how markets behave over time. Understanding past trends helps predict future behavior.
- Industry Factors – Specific characteristics of the industry like structure, regulations, and innovation cycles that affect market dynamics.
- Macroeconomic Factors – Economic conditions like GDP growth, inflation, and employment rates that affect how much money people have to spend.
- Demographic Factors – Population characteristics like age, income, and location that determine who can buy your product.
- Technology Factors – How quickly people adopt new technology and how much technology infrastructure exists.
- Regulatory Factors – Government rules, laws, and policies that can help or restrict market growth.
- Competitive Factors – Analyzing competition structure such as degree of competition and bargaining power of buyers and suppliers.
Forecasting Models / Techniques
Multiple Regression Analysis
- Identify and quantify factors that drive market changes
- Statistical modeling to establish relationships between market drivers and outcomes
Time Series Analysis – Seasonal Patterns
- Understand regular cyclical patterns in market demand
- Advanced statistical techniques to separate trend, seasonal, and irregular components
Time Series Analysis – Trend Analysis
- Identify underlying market growth patterns and momentum
- Statistical analysis of historical data to project future trends
Expert Opinion – Expert Interviews
- Gather deep industry insights and contextual understanding
- In-depth interviews with key industry stakeholders
Multi-Scenario Development
- Prepare for uncertainty by modeling different possible futures
- Creating optimistic, pessimistic, and most likely scenarios
Time Series Analysis – Moving Averages
- Sophisticated forecasting for complex time series data
- Auto-regressive integrated moving average models with seasonal components
Econometric Models
- Apply economic theory to market forecasting
- Sophisticated economic models that account for market interactions
Expert Opinion – Delphi Method
- Harness collective wisdom of industry experts
- Structured, multi-round expert consultation process
Monte Carlo Simulation
- Quantify uncertainty and probability distributions
- Thousands of simulations with varying input parameters
Research Analysis
Our research framework is built upon the fundamental principle of validating market intelligence from both demand and supply perspectives. This dual-sided approach ensures comprehensive market understanding and reduces the risk of single-source bias.
Demand-Side Analysis: We understand end-user/application behavior, preferences, and market needs along with the penetration of the product for specific application.
Supply-Side Analysis: We estimate overall market revenue, analyze the segmental share along with industry capacity, competitive landscape, and market structure.
Validation & Evaluation
Data triangulation is a validation technique that uses multiple methods, sources, or perspectives to examine the same research question, thereby increasing the credibility and reliability of research findings. In market research, triangulation serves as a quality assurance mechanism that helps identify and minimize bias, validate assumptions, and ensure accuracy in market estimates.
- Data Source Triangulation – Using multiple data sources to examine the same phenomenon
- Methodological Triangulation – Using multiple research methods to study the same research question
- Investigator Triangulation – Using multiple researchers or analysts to examine the same data
- Theoretical Triangulation – Using multiple theoretical perspectives to interpret the same data

Custom Market Research Services
We will customise the research for you, in case the report listed above does not meet your requirements.
Get 10% Free Customisation