Healthcare Price Transparency Systems Market Size, Share & Trends Analysis Report by Component (Software, Services), System Type, Deployment Mode, Technology, Pricing Data Source, Enterprise Size, End-Users, and Geography (North America, Europe, Asia Pacific, Middle East, Africa, and South America) – Global Industry Data, Trends, and Forecasts, 2026–2035
Market Overview:
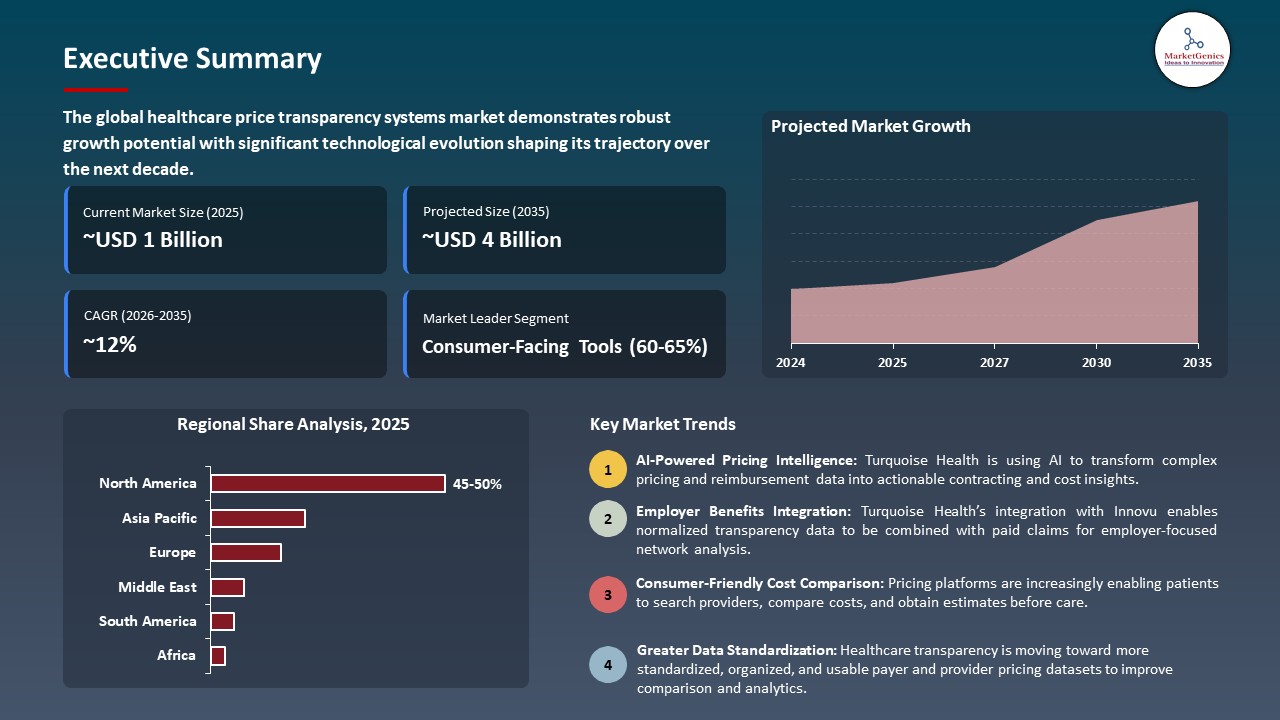
As per MarketGenics, the global healthcare price transparency systems market is experiencing significant growth, valued at USD 1.4 billion in 2025 and projected to reach USD 4.2 billion by 2035, expanding at a CAGR of 11.6% during the forecast period.
|
|
|
Segmental Data Insights |
|
|
Demand Trends |
|
|
Competitive Landscape |
|
|
Strategic Development |
|
|
Future Outlook & Opportunities |
|
Healthcare Price Transparency Systems Market Size, Share, and Growth
Rafiq Ahmed, CEO and Co-founder of Serif, said, “Price transparency started as a fight for access. It was about getting the data out into the open, Then the challenge became usability: making that data something healthcare teams could actually work with. Now we're asking a harder question: how do we get healthcare leaders from question to answer as fast as possible? The Signal upgrades with Signal Ask are our answer to that—AI isn't just a feature here; it's the next evolution of what price transparency can actually do for people relying on it every day”
Rising healthcare costs and the growing demand for transparency on pricing by consumers are creating a strong demand for healthcare-price-transparency-systems, which are being pushed by regulatory pressure for standardized disclosure, expansion of value-based care, and increasing employer interest in controlling medical spending. Also, more and more negotiated-rate data is becoming available in machine-readable formats, and this is driving the creation of platforms that take complicated negotiated-rate data and provide actionable estimates and comparisons of costs.
CMS introduced new hospital price transparency data requirements on January 2026, including standardized median, 10th-percentile, 90th-percentile and count-of-allowed-amount fields, further driving the need for systems to process and display standardized pricing data. In May 2026, Serif Health introduced new Signal functionality and previewed a new tool, which will help users navigate the complexities of healthcare pricing questions and get to actionable answers more quickly. In addition, rising employer healthcare costs and increased pressure on employers to shop around for healthcare providers and to negotiate contracts are also driving the demand for pricing intelligence platforms.
Adjacent opportunities include patient financial engagement platforms, healthcare navigation solutions, revenue cycle management software, digital payment and billing platforms, and all-payer claims database analytics. These markets can leverage transparent pricing data to deliver personalized cost estimates, guide provider selection, improve payment experiences, optimize reimbursement, and generate actionable healthcare spending insights.
Healthcare Price Transparency Systems Market Dynamics and Trends
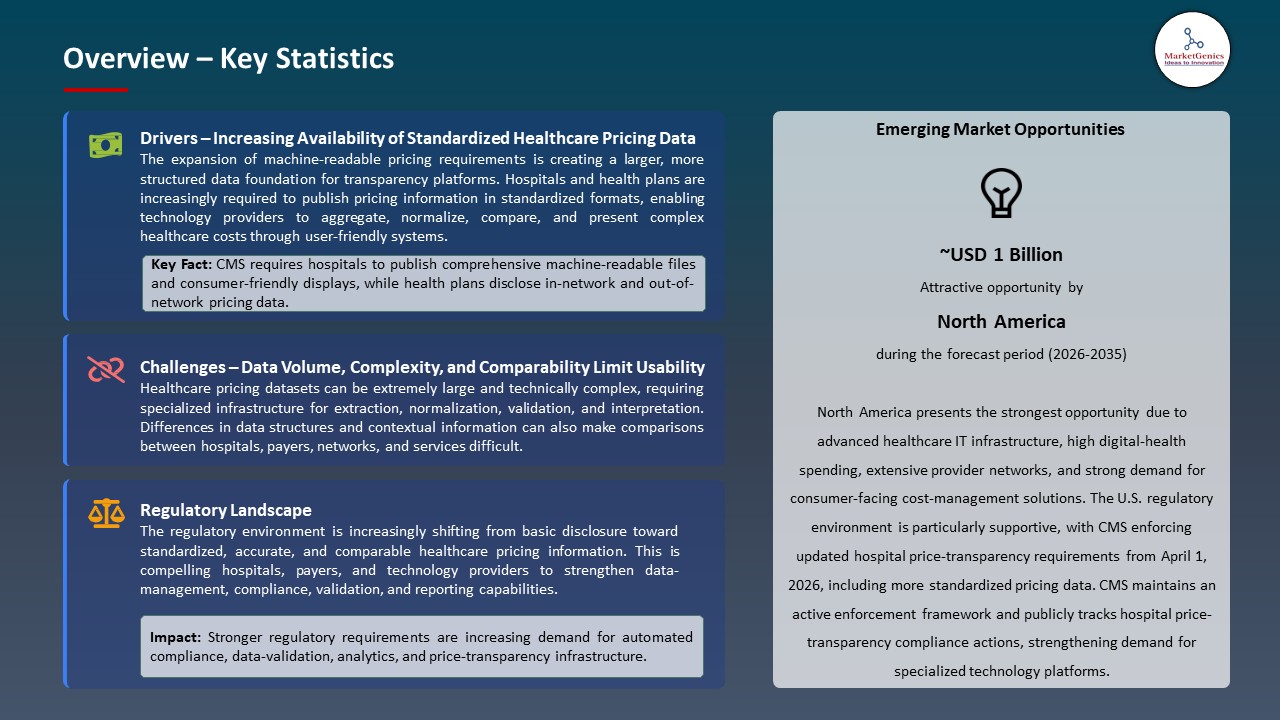
Driver: Rising Patient Demand for Upfront Healthcare Cost Information
- Patients are increasingly seeking clear information about healthcare costs before receiving treatment, particularly as out-of-pocket expenses and financial responsibility continue to influence healthcare decisions. Upfront pricing helps consumers shop around, consider options and understand what they may be facing financially.
- Healthcare price transparency systems have responded by allowing consumers to view information in an easy-to-consume format, offering consumers a personalized estimate of the cost of their services, comparing providers, and showing a digital tool to calculate prices. CMS also encourages patients to utilize hospital and payer price-estimator and comparison tools to gain more actionable information prior to receiving care.
- Growth in the demand for cost visibility is driving an increased number of healthcare providers, insurers and technology companies to create platforms that make pricing data more easily digestible and actionable.
Restraint: Inconsistent Pricing Data Quality Reduces Confidence in Transparency Platforms
- A lack of consistency, incompleteness, or processing difficulties in pricing data continues to be a major limiting factor since transparency systems in healthcare rely on accurate pricing data. Different file structures, provider identifiers, negotiated-rate information, and naming conventions may make it difficult to compare across providers and affect price accuracy displayed. Recent studies still find that the coverage gaps remain largely inconsistent between payers, in particular at the hospital inpatient level.
- The machine-readable files are also becoming more complex, which makes data normalization and validation more challenging, thus increasing operational costs for technology providers. When platform-based prices don't reflect actual costs to the patient or negotiated payments, these challenges can undermine user confidence.
- Lack of data consistency may diminish the accuracy of pricing and make platforms more expensive to process for the provider and impede the adoption of price transparency systems across the healthcare sector.
Opportunity: Integration with Employer Benefits Platforms Can Expand Transparency Adoption
- Incorporating price transparency technology into employer benefits platforms can help expand adoption by integrating provider pricing, cost comparisons, and personalized estimates into employee benefits and healthcare-navigation workflows.
- This allows staff to consider the costs before choosing the providers, and allows the employer and benefits advisor to see the pricing difference and possible saving opportunities. The platforms are becoming more transparent and feature plan, network and claims information that provides greater actionable pricing insights for self-insured employers and brokers.
- In 2026, MMA launched its proprietary transparency tool, Network Navigator, which will turn Transparency in Coverage data into provider-specific cost insights that are actuarially certified for use, allowing employers to compare network performance and make informed benefit decisions.
- Integrating with the employer platform can extend the reach of the customers and build greater recurring revenue for actionable healthcare pricing intelligence.
Key Trend: Artificial Intelligence Converts Healthcare Pricing Data into Actionable Intelligence
- Healthcare price transparency is an emerging trend driven by artificial intelligence, as healthcare organizations try to analyze vast, complicated pricing data sets to make meaningful decisions. With natural-language interfaces, AI can help you easily retrieve pricing data, search for relevant information, compare providers, and respond to questions about costs.
- In May 2026 Serif Health released the new AI research functionality, Signal Ask, made specifically for healthcare price-transparency information. It allows consumers to ask pricing questions without needing to have a technical understanding of the billing codes, data structures, or search logic.
- The movement is moving from a repository of passively collected prices to an intelligent system that helps with quicker contracting, network analysis, and healthcare cost decisions.
Healthcare Price Transparency Systems Market Analysis and Segmental Data
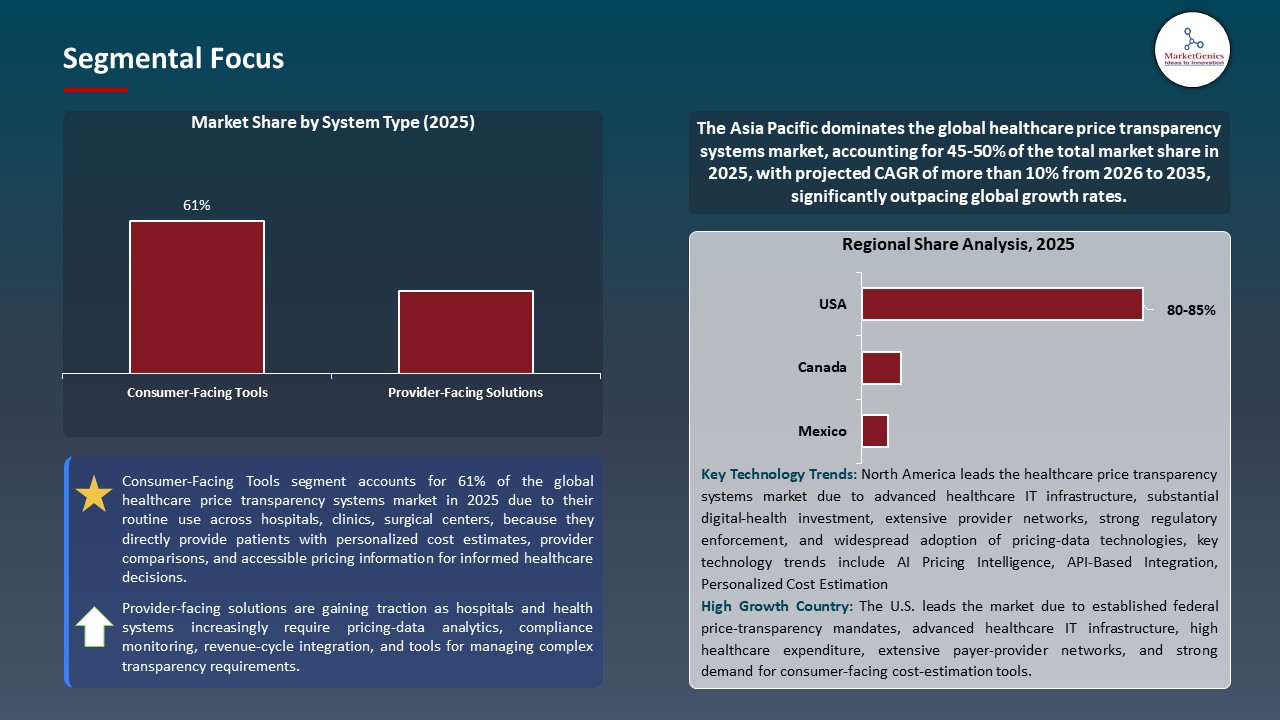
Consumer-Facing Tools Dominate Global Healthcare Price Transparency Systems Market
- Consumer-facing tools are a primary component of healthcare price transparency systems as they are most directly addressing consumers' demand for actionable, understandable information about healthcare prices. They offer customized cost estimates, provider comparisons, procedure pricing, and information on out-of-pocket expenses via easy-to-navigate digital interfaces. Consumer-oriented functionality is further emphasized by the fact that, if an alternative to the price-estimator is offered, CMS mandates that the hospitals give the consumer an individualized estimate of what they will be responsible for paying.
- Adoption is being further bolstered by growing patient preference for convenient self-service healthcare information. Insurance benefits, deductibles, co-payments and negotiated rates can be included in the price-estimation platforms to give more meaningful price information than the complex machine-readable files. In May 2026, Experian Health found that 82% of patients found accurate estimates useful for planning their healthcare payments, underscoring the importance of consumer-friendly solutions.
- Patient-facing tools continue to be the biggest segment, with personalized cost visibility, accessibility and functionality further strengthening the consumer-facing approach.
North America Leads Global Healthcare Price Transparency Systems Market Demand
- The healthcare price transparency systems market is expected to witness the highest growth in North America, as the region has an established healthcare IT landscape, high prevalence of digital cost estimation platforms, and robust regulatory support for easy access to pricing details.
- The U.S. tightened up hospital disclosure requirements, including new standardized pricing data requirements from Jan. 2026 and the launch of enforcement of updated provisions in April 2026.
- High healthcare spending, and an increasing consumer, employer, payer, and provider demand for actionable cost comparisons are also advantageous to the region.
- Advanced digital-health adoption and strong regulatory enforcement persist, maintaining North America's market-leading position. Advanced digital-health adoption and strong regulatory enforcement remain in place, continuing to secure North America's market-leading position.
Healthcare Price Transparency Systems Market Ecosystem
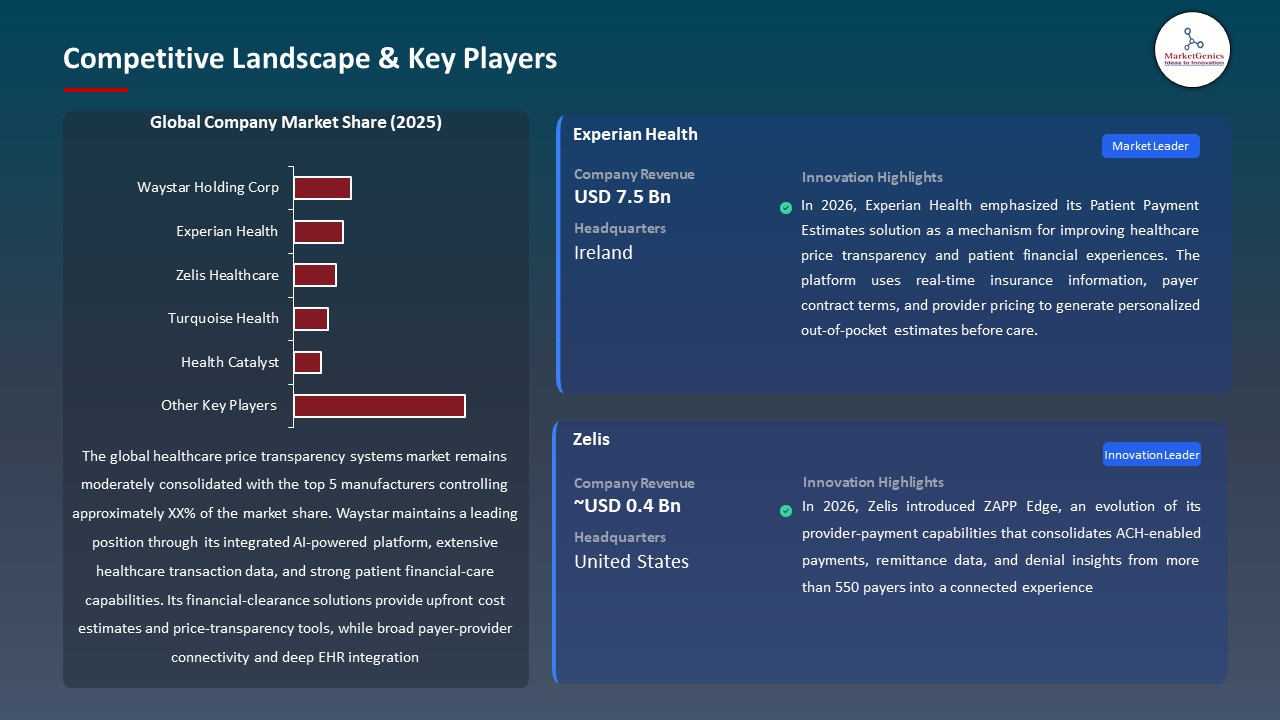
The healthcare price transparency systems market is moderately fragmented, led by Waystar Holding, Experian Health, Zelis Healthcare, Turquoise Health, and Health Catalyst. These companies compete through healthcare pricing intelligence, patient cost-estimation tools, price-transparency data aggregation, provider and payer analytics, claims and reimbursement data, consumer-facing cost-comparison solutions, contract and network intelligence, AI-enabled analytics, and integration with healthcare financial and navigation platforms.
The value chain includes healthcare pricing and claims data sources, payer and provider negotiated-rate data, data aggregation and normalization, pricing analytics and benchmarking, AI and machine-learning processing, software platform development, API and healthcare IT integration, consumer and employer-facing cost-estimation tools, provider/payer deployment, and ongoing data validation and platform support.
The market has moderate-to-high entry barriers due to requirements for large-scale healthcare pricing datasets, advanced data normalization and analytics capabilities, interoperability with payer and provider systems, data privacy and cybersecurity compliance, continuous regulatory monitoring, sophisticated AI and pricing-intelligence expertise, high technology development costs, established healthcare industry relationships, and the ability to accurately process complex negotiated rates, claims information, provider networks, and patient-specific benefit data.
Recent Development and Strategic Overview
- In May 2026, Experian Health emphasized its Patient Payment Estimates solution as a mechanism for improving healthcare price transparency and patient financial experiences. The platform uses real-time insurance information, payer contract terms, and provider pricing to generate personalized out-of-pocket estimates before care. Experian reported that 82% of patients consider accurate estimates helpful for preparing to pay healthcare costs.
- In January 2026, Zelis introduced ZAPP Edge, an evolution of its provider-payment capabilities that consolidates ACH-enabled payments, remittance data, and denial insights from more than 550 payers into a connected experience. The strategy gives providers greater visibility into reimbursement flows and creates a common data layer between payers and providers.
Report Scope
|
Detail |
|
|
Market Size in 2025 |
USD 1.4 Bn |
|
Market Forecast Value in 2035 |
USD 4.2 Bn |
|
Growth Rate (CAGR) |
11.6% |
|
Forecast Period |
2026 – 2035 |
|
Historical Data Available for |
2021 – 2024 |
|
Market Size Units |
US$ Billion for Value |
|
Report Format |
Electronic (PDF) + Excel |
|
North America |
Europe |
Asia Pacific |
Middle East |
Africa |
South America |
|
|
|
|
|
|
|
Companies Covered |
|||||
|
|||||
Healthcare Price Transparency Systems Market Segmentation and Highlights
|
Segment |
Sub-segment |
|
Healthcare Price Transparency Systems Market, By Component |
|
|
Healthcare Price Transparency Systems Market, By System Type |
|
|
Healthcare Price Transparency Systems Market, By Deployment Mode |
|
|
Healthcare Price Transparency Systems Market, By Technology |
|
|
Healthcare Price Transparency Systems Market, By Pricing Data Source |
|
|
Healthcare Price Transparency Systems Market, By Enterprise Size |
|
|
Healthcare Price Transparency Systems Market, By End-User |
|
Frequently Asked Questions
Table of Contents
- 1. Research Methodology and Assumptions
- 1.1. Definitions
- 1.2. Research Design and Approach
- 1.3. Data Collection Methods
- 1.4. Base Estimates and Calculations
- 1.5. Forecasting Models
- 1.5.1. Key Forecast Factors & Impact Analysis
- 1.6. Secondary Research
- 1.6.1. Open Sources
- 1.6.2. Paid Databases
- 1.6.3. Associations
- 1.7. Primary Research
- 1.7.1. Primary Sources
- 1.7.2. Primary Interviews with Stakeholders across Ecosystem
- 2. Executive Summary
- 2.1. Global Healthcare Price Transparency Systems Market Outlook
- 2.1.1. Healthcare Price Transparency Systems Market Size Value (US$ Bn), and Forecasts, 2021-2035
- 2.1.2. Compounded Annual Growth Rate Analysis
- 2.1.3. Growth Opportunity Analysis
- 2.1.4. Segmental Share Analysis
- 2.1.5. Geographical Share Analysis
- 2.2. Market Analysis and Facts
- 2.3. Supply-Demand Analysis
- 2.4. Competitive Benchmarking
- 2.5. Go-to- Market Strategy
- 2.5.1. Customer/ End-use Industry Assessment
- 2.5.2. Growth Opportunity Data, 2026-2035
- 2.5.2.1. Regional Data
- 2.5.2.2. Country Data
- 2.5.2.3. Segmental Data
- 2.5.3. Identification of Potential Market Spaces
- 2.5.4. GAP Analysis
- 2.5.5. Potential Attractive Price Points
- 2.5.6. Prevailing Market Risks & Challenges
- 2.5.7. Preferred Sales & Marketing Strategies
- 2.5.8. Key Recommendations and Analysis
- 2.5.9. A Way Forward
- 2.1. Global Healthcare Price Transparency Systems Market Outlook
- 3. Industry Data and Premium Insights
- 3.1. Global Healthcare & Pharmaceutical Industry Overview, 2025
- 3.1.1. Healthcare & Pharmaceutical Ecosystem Analysis
- 3.1.2. Key Trends for Healthcare & Pharmaceutical Industry
- 3.1.3. Regional Distribution for Healthcare & Pharmaceutical Industry
- 3.2. Supplier Customer Data
- 3.3. Technology Roadmap and Developments
- 3.1. Global Healthcare & Pharmaceutical Industry Overview, 2025
- 4. Market Overview
- 4.1. Market Dynamics
- 4.1.1. Drivers
- 4.1.1.1. Stronger government regulations and enforcement of healthcare price disclosure requirements
- 4.1.1.2. Rising consumer demand for personalized and upfront healthcare cost information
- 4.1.1.3. Increasing adoption of digital healthcare cost-estimation and comparison platforms
- 4.1.2. Restraints
- 4.1.2.1. Inconsistent, incomplete, and difficult-to-standardize healthcare pricing data
- 4.1.2.2. High technical complexity and costs associated with continuously updating pricing datasets
- 4.1.1. Drivers
- 4.2. Key Trend Analysis
- 4.3. Regulatory Framework
- 4.3.1. Key Regulations, Norms, and Subsidies, by Key Countries
- 4.3.2. Tariffs and Standards
- 4.3.3. Impact Analysis of Regulations on the Market
- 4.4. Ecosystem Analysis
- 4.5. Porter’s Five Forces Analysis
- 4.6. PESTEL Analysis
- 4.7. Global Healthcare Price Transparency Systems Market Demand
- 4.7.1. Historical Market Size – Value (US$ Bn), 2020-2024
- 4.7.2. Current and Future Market Size – Value (US$ Bn), 2026–2035
- 4.7.2.1. Y-o-Y Growth Trends
- 4.7.2.2. Absolute $ Opportunity Assessment
- 4.1. Market Dynamics
- 5. Competition Landscape
- 5.1. Competition structure
- 5.1.1. Fragmented v/s consolidated
- 5.2. Company Share Analysis, 2025
- 5.2.1. Global Company Market Share
- 5.2.2. By Region
- 5.2.2.1. North America
- 5.2.2.2. Europe
- 5.2.2.3. Asia Pacific
- 5.2.2.4. Middle East
- 5.2.2.5. Africa
- 5.2.2.6. South America
- 5.3. Product Comparison Matrix
- 5.3.1. Specifications
- 5.3.2. Market Positioning
- 5.3.3. Pricing
- 5.1. Competition structure
- 6. Global Healthcare Price Transparency Systems Market Analysis, by Component
- 6.1. Key Segment Analysis
- 6.2. Healthcare Price Transparency Systems Market Size Value (US$ Bn), Analysis, and Forecasts, by Component, 2021-2035
- 6.2.1. Software
- 6.2.1.1. Compliance Management Software
- 6.2.1.2. Revenue Cycle Software
- 6.2.1.3. Consumer Engagement Software
- 6.2.1.4. Others
- 6.2.2. Services
- 6.2.2.1. Implementation & Integration
- 6.2.2.2. Consulting & Advisory
- 6.2.2.3. Support & Maintenance
- 6.2.2.4. Managed Services
- 6.2.1. Software
- 7. Global Healthcare Price Transparency Systems Market Analysis, by System Type
- 7.1. Key Segment Analysis
- 7.2. Healthcare Price Transparency Systems Market Size Value (US$ Bn), Analysis, and Forecasts, by System Type, 2021-2035
- 7.2.1. Consumer-Facing Tools
- 7.2.1.1. Price Comparison Platforms
- 7.2.1.2. Cost Estimation Calculators
- 7.2.1.3. Billing & Invoice Explanation Tools
- 7.2.1.4. Payment Portals
- 7.2.1.5. Others
- 7.2.2. Provider-Facing Solutions
- 7.2.2.1. Claims Management Systems
- 7.2.2.2. Chargemaster Management Tools
- 7.2.2.3. Contract Rate Management Systems
- 7.2.2.4. Others
- 7.2.1. Consumer-Facing Tools
- 8. Global Healthcare Price Transparency Systems Market Analysis, by Deployment Mode
- 8.1. Key Segment Analysis
- 8.2. Healthcare Price Transparency Systems Market Size Value (US$ Bn), Analysis, and Forecasts, by Deployment Mode, 2021-2035
- 8.2.1. Cloud-Based/SaaS
- 8.2.2. On-Premise
- 8.2.3. Hybrid
- 9. Global Healthcare Price Transparency Systems Market Analysis, by Technology
- 9.1. Key Segment Analysis
- 9.2. Healthcare Price Transparency Systems Market Size Value (US$ Bn), Analysis, and Forecasts, by Technology, 2021-2035
- 9.2.1. Basic Web-Based Platforms
- 9.2.2. AI/Machine Learning-Driven Solutions
- 9.2.3. Blockchain-Enabled Solutions
- 9.2.4. API-Based Interoperability Solutions
- 10. Global Healthcare Price Transparency Systems Market Analysis and Forecasts, by Pricing Data Source
- 10.1. Key Findings
- 10.2. Healthcare Price Transparency Systems Market Size Value (US$ Bn), Analysis, and Forecasts, by Pricing Data Source, 2021-2035
- 10.2.1. Payer-Negotiated Rates
- 10.2.2. Hospital Standard Charges
- 10.2.3. Self-Pay/Cash Pricing
- 10.2.4. Claims-Based Historical Data
- 11. Global Healthcare Price Transparency Systems Market Analysis and Forecasts, by Enterprise Size
- 11.1. Key Findings
- 11.2. Healthcare Price Transparency Systems Market Size Value (US$ Bn), Analysis, and Forecasts, by Enterprise Size, 2021-2035
- 11.2.1. Large Healthcare Enterprises
- 11.2.2. Medium-Sized Organizations
- 11.2.3. Small Healthcare Organizations
- 12. Global Healthcare Price Transparency Systems Market Analysis and Forecasts, by End-User
- 12.1. Key Findings
- 12.2. Healthcare Price Transparency Systems Market Size Value (US$ Bn), Analysis, and Forecasts, by End-User, 2021-2035
- 12.2.1. Hospitals & Health Systems
- 12.2.2. Ambulatory Care/Physician Practices
- 12.2.3. Health Insurance Payers
- 12.2.4. Employers/Self-Insured Groups
- 12.2.5. Third-Party Administrators (TPAs)
- 12.2.6. Patients/Consumers
- 13. Global Healthcare Price Transparency Systems Market Analysis and Forecasts, by Region
- 13.1. Key Findings
- 13.2. Healthcare Price Transparency Systems Market Size Value (US$ Bn), Analysis, and Forecasts, by Region, 2021-2035
- 13.2.1. North America
- 13.2.2. Europe
- 13.2.3. Asia Pacific
- 13.2.4. Middle East
- 13.2.5. Africa
- 13.2.6. South America
- 14. North America Healthcare Price Transparency Systems Market Analysis
- 14.1. Key Segment Analysis
- 14.2. Regional Snapshot
- 14.3. North America Healthcare Price Transparency Systems Market Size- Value (US$ Bn), Analysis, and Forecasts, 2021-2035
- 14.3.1. Component
- 14.3.2. System Type
- 14.3.3. Deployment Mode
- 14.3.4. Technology
- 14.3.5. Pricing Data Source
- 14.3.6. Enterprise Size
- 14.3.7. End-User
- 14.3.8. Country
- 14.3.8.1. USA
- 14.3.8.2. Canada
- 14.3.8.3. Mexico
- 14.4. USA Healthcare Price Transparency Systems Market
- 14.4.1. Country Segmental Analysis
- 14.4.2. Component
- 14.4.3. System Type
- 14.4.4. Deployment Mode
- 14.4.5. Technology
- 14.4.6. Pricing Data Source
- 14.4.7. Enterprise Size
- 14.4.8. End-User
- 14.5. Canada Healthcare Price Transparency Systems Market
- 14.5.1. Country Segmental Analysis
- 14.5.2. Component
- 14.5.3. System Type
- 14.5.4. Deployment Mode
- 14.5.5. Technology
- 14.5.6. Pricing Data Source
- 14.5.7. Enterprise Size
- 14.5.8. End-User
- 14.6. Mexico Healthcare Price Transparency Systems Market
- 14.6.1. Country Segmental Analysis
- 14.6.2. Component
- 14.6.3. System Type
- 14.6.4. Deployment Mode
- 14.6.5. Technology
- 14.6.6. Pricing Data Source
- 14.6.7. Enterprise Size
- 14.6.8. End-User
- 15. Europe Healthcare Price Transparency Systems Market Analysis
- 15.1. Key Segment Analysis
- 15.2. Regional Snapshot
- 15.3. Europe Healthcare Price Transparency Systems Market Size Value (US$ Bn), Analysis, and Forecasts, 2021-2035
- 15.3.1. Component
- 15.3.2. System Type
- 15.3.3. Deployment Mode
- 15.3.4. Technology
- 15.3.5. Pricing Data Source
- 15.3.6. Enterprise Size
- 15.3.7. End-User
- 15.3.8. Country
- 15.3.8.1. Germany
- 15.3.8.2. United Kingdom
- 15.3.8.3. France
- 15.3.8.4. Italy
- 15.3.8.5. Spain
- 15.3.8.6. Netherlands
- 15.3.8.7. Nordic Countries
- 15.3.8.8. Poland
- 15.3.8.9. Russia & CIS
- 15.3.8.10. Rest of Europe
- 15.4. Germany Healthcare Price Transparency Systems Market
- 15.4.1. Country Segmental Analysis
- 15.4.2. Component
- 15.4.3. System Type
- 15.4.4. Deployment Mode
- 15.4.5. Technology
- 15.4.6. Pricing Data Source
- 15.4.7. Enterprise Size
- 15.4.8. End-User
- 15.5. United Kingdom Healthcare Price Transparency Systems Market
- 15.5.1. Country Segmental Analysis
- 15.5.2. Component
- 15.5.3. System Type
- 15.5.4. Deployment Mode
- 15.5.5. Technology
- 15.5.6. Pricing Data Source
- 15.5.7. Enterprise Size
- 15.5.8. End-User
- 15.6. France Healthcare Price Transparency Systems Market
- 15.6.1. Country Segmental Analysis
- 15.6.2. Component
- 15.6.3. System Type
- 15.6.4. Deployment Mode
- 15.6.5. Technology
- 15.6.6. Pricing Data Source
- 15.6.7. Enterprise Size
- 15.6.8. End-User
- 15.7. Italy Healthcare Price Transparency Systems Market
- 15.7.1. Country Segmental Analysis
- 15.7.2. Component
- 15.7.3. System Type
- 15.7.4. Deployment Mode
- 15.7.5. Technology
- 15.7.6. Pricing Data Source
- 15.7.7. Enterprise Size
- 15.7.8. End-User
- 15.8. Spain Healthcare Price Transparency Systems Market
- 15.8.1. Country Segmental Analysis
- 15.8.2. Component
- 15.8.3. System Type
- 15.8.4. Deployment Mode
- 15.8.5. Technology
- 15.8.6. Pricing Data Source
- 15.8.7. Enterprise Size
- 15.8.8. End-User
- 15.9. Netherlands Healthcare Price Transparency Systems Market
- 15.9.1. Country Segmental Analysis
- 15.9.2. Component
- 15.9.3. System Type
- 15.9.4. Deployment Mode
- 15.9.5. Technology
- 15.9.6. Pricing Data Source
- 15.9.7. Enterprise Size
- 15.9.8. End-User
- 15.10. Nordic Countries Healthcare Price Transparency Systems Market
- 15.10.1. Country Segmental Analysis
- 15.10.2. Component
- 15.10.3. System Type
- 15.10.4. Deployment Mode
- 15.10.5. Technology
- 15.10.6. Pricing Data Source
- 15.10.7. Enterprise Size
- 15.10.8. End-User
- 15.11. Poland Healthcare Price Transparency Systems Market
- 15.11.1. Country Segmental Analysis
- 15.11.2. Component
- 15.11.3. System Type
- 15.11.4. Deployment Mode
- 15.11.5. Technology
- 15.11.6. Pricing Data Source
- 15.11.7. Enterprise Size
- 15.11.8. End-User
- 15.12. Russia & CIS Healthcare Price Transparency Systems Market
- 15.12.1. Country Segmental Analysis
- 15.12.2. Component
- 15.12.3. System Type
- 15.12.4. Deployment Mode
- 15.12.5. Technology
- 15.12.6. Pricing Data Source
- 15.12.7. Enterprise Size
- 15.12.8. End-User
- 15.13. Rest of Europe Healthcare Price Transparency Systems Market
- 15.13.1. Country Segmental Analysis
- 15.13.2. Component
- 15.13.3. System Type
- 15.13.4. Deployment Mode
- 15.13.5. Technology
- 15.13.6. Pricing Data Source
- 15.13.7. Enterprise Size
- 15.13.8. End-User
- 16. Asia Pacific Healthcare Price Transparency Systems Market Analysis
- 16.1. Key Segment Analysis
- 16.2. Regional Snapshot
- 16.3. Asia Pacific Healthcare Price Transparency Systems Market Size Value (US$ Bn), Analysis, and Forecasts, 2021-2035
- 16.3.1. Component
- 16.3.2. System Type
- 16.3.3. Deployment Mode
- 16.3.4. Technology
- 16.3.5. Pricing Data Source
- 16.3.6. Enterprise Size
- 16.3.7. End-User
- 16.3.8. Country
- 16.3.8.1. China
- 16.3.8.2. India
- 16.3.8.3. Japan
- 16.3.8.4. South Korea
- 16.3.8.5. Australia and New Zealand
- 16.3.8.6. Indonesia
- 16.3.8.7. Malaysia
- 16.3.8.8. Thailand
- 16.3.8.9. Vietnam
- 16.3.8.10. Rest of Asia Pacific
- 16.4. China Healthcare Price Transparency Systems Market
- 16.4.1. Country Segmental Analysis
- 16.4.2. Component
- 16.4.3. System Type
- 16.4.4. Deployment Mode
- 16.4.5. Technology
- 16.4.6. Pricing Data Source
- 16.4.7. Enterprise Size
- 16.4.8. End-User
- 16.5. India Healthcare Price Transparency Systems Market
- 16.5.1. Country Segmental Analysis
- 16.5.2. Component
- 16.5.3. System Type
- 16.5.4. Deployment Mode
- 16.5.5. Technology
- 16.5.6. Pricing Data Source
- 16.5.7. Enterprise Size
- 16.5.8. End-User
- 16.6. Japan Healthcare Price Transparency Systems Market
- 16.6.1. Country Segmental Analysis
- 16.6.2. Component
- 16.6.3. System Type
- 16.6.4. Deployment Mode
- 16.6.5. Technology
- 16.6.6. Pricing Data Source
- 16.6.7. Enterprise Size
- 16.6.8. End-User
- 16.7. South Korea Healthcare Price Transparency Systems Market
- 16.7.1. Country Segmental Analysis
- 16.7.2. Component
- 16.7.3. System Type
- 16.7.4. Deployment Mode
- 16.7.5. Technology
- 16.7.6. Pricing Data Source
- 16.7.7. Enterprise Size
- 16.7.8. End-User
- 16.8. Australia and New Zealand Healthcare Price Transparency Systems Market
- 16.8.1. Country Segmental Analysis
- 16.8.2. Component
- 16.8.3. System Type
- 16.8.4. Deployment Mode
- 16.8.5. Technology
- 16.8.6. Pricing Data Source
- 16.8.7. Enterprise Size
- 16.8.8. End-User
- 16.9. Indonesia Healthcare Price Transparency Systems Market
- 16.9.1. Country Segmental Analysis
- 16.9.2. Component
- 16.9.3. System Type
- 16.9.4. Deployment Mode
- 16.9.5. Technology
- 16.9.6. Pricing Data Source
- 16.9.7. Enterprise Size
- 16.9.8. End-User
- 16.10. Malaysia Healthcare Price Transparency Systems Market
- 16.10.1. Country Segmental Analysis
- 16.10.2. Component
- 16.10.3. System Type
- 16.10.4. Deployment Mode
- 16.10.5. Technology
- 16.10.6. Pricing Data Source
- 16.10.7. Enterprise Size
- 16.10.8. End-User
- 16.11. Thailand Healthcare Price Transparency Systems Market
- 16.11.1. Country Segmental Analysis
- 16.11.2. Component
- 16.11.3. System Type
- 16.11.4. Deployment Mode
- 16.11.5. Technology
- 16.11.6. Pricing Data Source
- 16.11.7. Enterprise Size
- 16.11.8. End-User
- 16.12. Vietnam Healthcare Price Transparency Systems Market
- 16.12.1. Country Segmental Analysis
- 16.12.2. Component
- 16.12.3. System Type
- 16.12.4. Deployment Mode
- 16.12.5. Technology
- 16.12.6. Pricing Data Source
- 16.12.7. Enterprise Size
- 16.12.8. End-User
- 16.13. Rest of Asia Pacific Healthcare Price Transparency Systems Market
- 16.13.1. Country Segmental Analysis
- 16.13.2. Component
- 16.13.3. System Type
- 16.13.4. Deployment Mode
- 16.13.5. Technology
- 16.13.6. Pricing Data Source
- 16.13.7. Enterprise Size
- 16.13.8. End-User
- 17. Middle East Healthcare Price Transparency Systems Market Analysis
- 17.1. Key Segment Analysis
- 17.2. Regional Snapshot
- 17.3. Middle East Healthcare Price Transparency Systems Market Size Value (US$ Bn), Analysis, and Forecasts, 2021-2035
- 17.3.1. Component
- 17.3.2. System Type
- 17.3.3. Deployment Mode
- 17.3.4. Technology
- 17.3.5. Pricing Data Source
- 17.3.6. Enterprise Size
- 17.3.7. End-User
- 17.3.8. Country
- 17.3.8.1. Turkey
- 17.3.8.2. UAE
- 17.3.8.3. Saudi Arabia
- 17.3.8.4. Israel
- 17.3.8.5. Rest of Middle East
- 17.4. Turkey Healthcare Price Transparency Systems Market
- 17.4.1. Country Segmental Analysis
- 17.4.2. Component
- 17.4.3. System Type
- 17.4.4. Deployment Mode
- 17.4.5. Technology
- 17.4.6. Pricing Data Source
- 17.4.7. Enterprise Size
- 17.4.8. End-User
- 17.5. UAE Healthcare Price Transparency Systems Market
- 17.5.1. Country Segmental Analysis
- 17.5.2. Component
- 17.5.3. System Type
- 17.5.4. Deployment Mode
- 17.5.5. Technology
- 17.5.6. Pricing Data Source
- 17.5.7. Enterprise Size
- 17.5.8. End-User
- 17.6. Saudi Arabia Healthcare Price Transparency Systems Market
- 17.6.1. Country Segmental Analysis
- 17.6.2. Component
- 17.6.3. System Type
- 17.6.4. Deployment Mode
- 17.6.5. Technology
- 17.6.6. Pricing Data Source
- 17.6.7. Enterprise Size
- 17.6.8. End-User
- 17.7. Israel Healthcare Price Transparency Systems Market
- 17.7.1. Country Segmental Analysis
- 17.7.2. Component
- 17.7.3. System Type
- 17.7.4. Deployment Mode
- 17.7.5. Technology
- 17.7.6. Pricing Data Source
- 17.7.7. Enterprise Size
- 17.7.8. End-User
- 17.8. Rest of Middle East Healthcare Price Transparency Systems Market
- 17.8.1. Country Segmental Analysis
- 17.8.2. Component
- 17.8.3. System Type
- 17.8.4. Deployment Mode
- 17.8.5. Technology
- 17.8.6. Pricing Data Source
- 17.8.7. Enterprise Size
- 17.8.8. End-User
- 18. Africa Healthcare Price Transparency Systems Market Analysis
- 18.1. Key Segment Analysis
- 18.2. Regional Snapshot
- 18.3. Africa Healthcare Price Transparency Systems Market Size Value (US$ Bn), Analysis, and Forecasts, 2021-2035
- 18.3.1. Component
- 18.3.2. System Type
- 18.3.3. Deployment Mode
- 18.3.4. Technology
- 18.3.5. Pricing Data Source
- 18.3.6. Enterprise Size
- 18.3.7. End-User
- 18.3.8. Country
- 18.3.8.1. South Africa
- 18.3.8.2. Egypt
- 18.3.8.3. Nigeria
- 18.3.8.4. Algeria
- 18.3.8.5. Rest of Africa
- 18.4. South Africa Healthcare Price Transparency Systems Market
- 18.4.1. Country Segmental Analysis
- 18.4.2. Component
- 18.4.3. System Type
- 18.4.4. Deployment Mode
- 18.4.5. Technology
- 18.4.6. Pricing Data Source
- 18.4.7. Enterprise Size
- 18.4.8. End-User
- 18.5. Egypt Healthcare Price Transparency Systems Market
- 18.5.1. Country Segmental Analysis
- 18.5.2. Component
- 18.5.3. System Type
- 18.5.4. Deployment Mode
- 18.5.5. Technology
- 18.5.6. Pricing Data Source
- 18.5.7. Enterprise Size
- 18.5.8. End-User
- 18.6. Nigeria Healthcare Price Transparency Systems Market
- 18.6.1. Country Segmental Analysis
- 18.6.2. Component
- 18.6.3. System Type
- 18.6.4. Deployment Mode
- 18.6.5. Technology
- 18.6.6. Pricing Data Source
- 18.6.7. Enterprise Size
- 18.6.8. End-User
- 18.7. Algeria Healthcare Price Transparency Systems Market
- 18.7.1. Country Segmental Analysis
- 18.7.2. Component
- 18.7.3. System Type
- 18.7.4. Deployment Mode
- 18.7.5. Technology
- 18.7.6. Pricing Data Source
- 18.7.7. Enterprise Size
- 18.7.8. End-User
- 18.8. Rest of Africa Healthcare Price Transparency Systems Market
- 18.8.1. Country Segmental Analysis
- 18.8.2. Component
- 18.8.3. System Type
- 18.8.4. Deployment Mode
- 18.8.5. Technology
- 18.8.6. Pricing Data Source
- 18.8.7. Enterprise Size
- 18.8.8. End-User
- 19. South America Healthcare Price Transparency Systems Market Analysis
- 19.1. Key Segment Analysis
- 19.2. Regional Snapshot
- 19.3. South America Healthcare Price Transparency Systems Market Size Value (US$ Bn), Analysis, and Forecasts, 2021-2035
- 19.3.1. Component
- 19.3.2. System Type
- 19.3.3. Deployment Mode
- 19.3.4. Technology
- 19.3.5. Pricing Data Source
- 19.3.6. Enterprise Size
- 19.3.7. End-User
- 19.3.8. Country
- 19.3.8.1. Brazil
- 19.3.8.2. Argentina
- 19.3.8.3. Rest of South America
- 19.4. Brazil Healthcare Price Transparency Systems Market
- 19.4.1. Country Segmental Analysis
- 19.4.2. Component
- 19.4.3. System Type
- 19.4.4. Deployment Mode
- 19.4.5. Technology
- 19.4.6. Pricing Data Source
- 19.4.7. Enterprise Size
- 19.4.8. End-User
- 19.5. Argentina Healthcare Price Transparency Systems Market
- 19.5.1. Country Segmental Analysis
- 19.5.2. Component
- 19.5.3. System Type
- 19.5.4. Deployment Mode
- 19.5.5. Technology
- 19.5.6. Pricing Data Source
- 19.5.7. Enterprise Size
- 19.5.8. End-User
- 19.6. Rest of South America Healthcare Price Transparency Systems Market
- 19.6.1. Country Segmental Analysis
- 19.6.2. Component
- 19.6.3. System Type
- 19.6.4. Deployment Mode
- 19.6.5. Technology
- 19.6.6. Pricing Data Source
- 19.6.7. Enterprise Size
- 19.6.8. End-User
- 20. Key Players/ Company Profile
- 20.1. Waystar Holding Corp.
- 20.1.1. Company Details/ Overview
- 20.1.2. Company Financials
- 20.1.3. Key Customers and Competitors
- 20.1.4. Business/ Industry Portfolio
- 20.1.5. Product Portfolio/ Specification Details
- 20.1.6. Pricing Data
- 20.1.7. Strategic Overview
- 20.1.8. Recent Developments
- 20.2. Castlight Health, Inc.
- 20.3. Change Healthcare Inc.
- 20.4. Clarify Health Solutions
- 20.5. ClearCost Health (MacroHealth)
- 20.6. Experian Health
- 20.7. Health Catalyst
- 20.8. Priority Health
- 20.9. TransUnion Healthcare
- 20.10. Turquoise Health
- 20.11. UnitedHealth Group
- 20.12. Valenz Bluebook
- 20.13. Zelis Healthcare
- 20.14. Other Key Players
- 20.1. Waystar Holding Corp.
Note* - This is just tentative list of players. While providing the report, we will cover more number of players based on their revenue and share for each geography
Research Design
Our research design integrates both demand-side and supply-side analysis through a balanced combination of primary and secondary research methodologies. By utilizing both bottom-up and top-down approaches alongside rigorous data triangulation methods, we deliver robust market intelligence that supports strategic decision-making.
MarketGenics' comprehensive research design framework ensures the delivery of accurate, reliable, and actionable market intelligence. Through the integration of multiple research approaches, rigorous validation processes, and expert analysis, we provide our clients with the insights needed to make informed strategic decisions and capitalize on market opportunities.
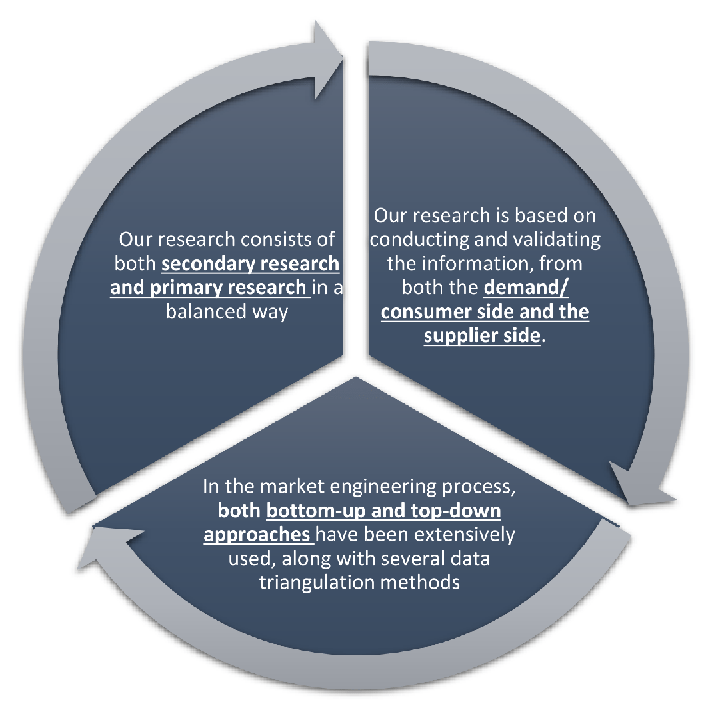
MarketGenics leverages a dedicated industry panel of experts and a comprehensive suite of paid databases to effectively collect, consolidate, and analyze market intelligence.
Our approach has consistently proven to be reliable and effective in generating accurate market insights, identifying key industry trends, and uncovering emerging business opportunities.
Through both primary and secondary research, we capture and analyze critical company-level data such as manufacturing footprints, including technical centers, R&D facilities, sales offices, and headquarters.
Our expert panel further enhances our ability to estimate market size for specific brands based on validated field-level intelligence.
Our data mining techniques incorporate both parametric and non-parametric methods, allowing for structured data collection, sorting, processing, and cleaning.
Demand projections are derived from large-scale data sets analyzed through proprietary algorithms, culminating in robust and reliable market sizing.
Research Approach
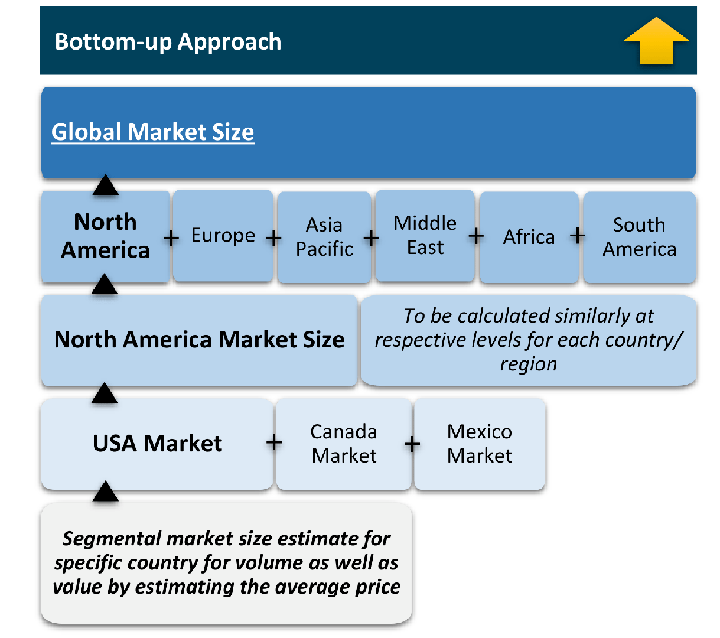
The bottom-up approach builds market estimates by starting with the smallest addressable market units and systematically aggregating them to create comprehensive market size projections.
This method begins with specific, granular data points and builds upward to create the complete market landscape.
Customer Analysis → Segmental Analysis → Geographical Analysis
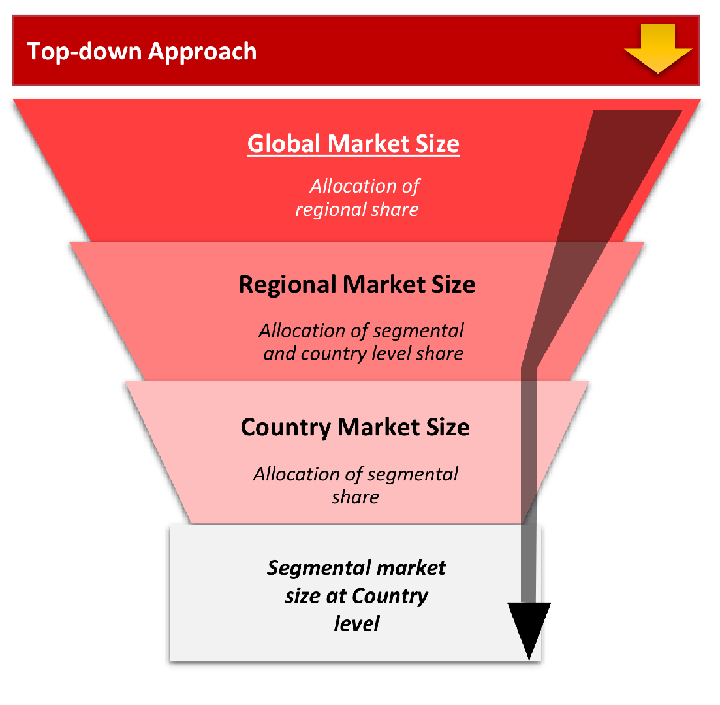
The top-down approach starts with the broadest possible market data and systematically narrows it down through a series of filters and assumptions to arrive at specific market segments or opportunities.
This method begins with the big picture and works downward to increasingly specific market slices.
TAM → SAM → SOM
Research Methods
Desk / Secondary Research
While analysing the market, we extensively study secondary sources, directories, and databases to identify and collect information useful for this technical, market-oriented, and commercial report. Secondary sources that we utilize are not only the public sources, but it is a combination of Open Source, Associations, Paid Databases, MG Repository & Knowledgebase, and others.
- Company websites, annual reports, financial reports, broker reports, and investor presentations
- National government documents, statistical databases and reports
- News articles, press releases and web-casts specific to the companies operating in the market, Magazines, reports, and others
- We gather information from commercial data sources for deriving company specific data such as segmental revenue, share for geography, product revenue, and others
- Internal and external proprietary databases (industry-specific), relevant patent, and regulatory databases
- Governing Bodies, Government Organizations
- Relevant Authorities, Country-specific Associations for Industries
We also employ the model mapping approach to estimate the product level market data through the players' product portfolio
Primary Research
Primary research/ interviews is vital in analyzing the market. Most of the cases involves paid primary interviews. Primary sources include primary interviews through e-mail interactions, telephonic interviews, surveys as well as face-to-face interviews with the different stakeholders across the value chain including several industry experts.
| Type of Respondents | Number of Primaries |
|---|---|
| Tier 2/3 Suppliers | ~20 |
| Tier 1 Suppliers | ~25 |
| End-users | ~25 |
| Industry Expert/ Panel/ Consultant | ~30 |
| Total | ~100 |
MG Knowledgebase
• Repository of industry blog, newsletter and case studies
• Online platform covering detailed market reports, and company profiles
Forecasting Factors and Models
Forecasting Factors
- Historical Trends – Past market patterns, cycles, and major events that shaped how markets behave over time. Understanding past trends helps predict future behavior.
- Industry Factors – Specific characteristics of the industry like structure, regulations, and innovation cycles that affect market dynamics.
- Macroeconomic Factors – Economic conditions like GDP growth, inflation, and employment rates that affect how much money people have to spend.
- Demographic Factors – Population characteristics like age, income, and location that determine who can buy your product.
- Technology Factors – How quickly people adopt new technology and how much technology infrastructure exists.
- Regulatory Factors – Government rules, laws, and policies that can help or restrict market growth.
- Competitive Factors – Analyzing competition structure such as degree of competition and bargaining power of buyers and suppliers.
Forecasting Models / Techniques
Multiple Regression Analysis
- Identify and quantify factors that drive market changes
- Statistical modeling to establish relationships between market drivers and outcomes
Time Series Analysis – Seasonal Patterns
- Understand regular cyclical patterns in market demand
- Advanced statistical techniques to separate trend, seasonal, and irregular components
Time Series Analysis – Trend Analysis
- Identify underlying market growth patterns and momentum
- Statistical analysis of historical data to project future trends
Expert Opinion – Expert Interviews
- Gather deep industry insights and contextual understanding
- In-depth interviews with key industry stakeholders
Multi-Scenario Development
- Prepare for uncertainty by modeling different possible futures
- Creating optimistic, pessimistic, and most likely scenarios
Time Series Analysis – Moving Averages
- Sophisticated forecasting for complex time series data
- Auto-regressive integrated moving average models with seasonal components
Econometric Models
- Apply economic theory to market forecasting
- Sophisticated economic models that account for market interactions
Expert Opinion – Delphi Method
- Harness collective wisdom of industry experts
- Structured, multi-round expert consultation process
Monte Carlo Simulation
- Quantify uncertainty and probability distributions
- Thousands of simulations with varying input parameters
Research Analysis
Our research framework is built upon the fundamental principle of validating market intelligence from both demand and supply perspectives. This dual-sided approach ensures comprehensive market understanding and reduces the risk of single-source bias.
Demand-Side Analysis: We understand end-user/application behavior, preferences, and market needs along with the penetration of the product for specific application.
Supply-Side Analysis: We estimate overall market revenue, analyze the segmental share along with industry capacity, competitive landscape, and market structure.
Validation & Evaluation
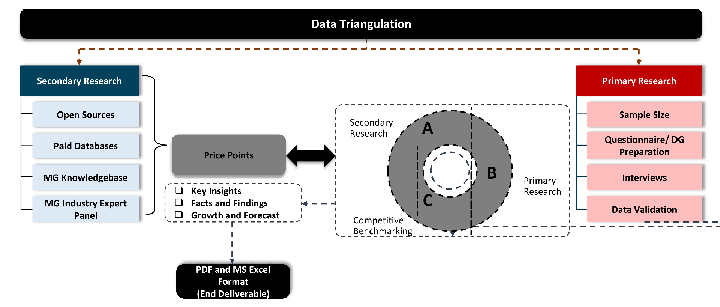
Data triangulation is a validation technique that uses multiple methods, sources, or perspectives to examine the same research question, thereby increasing the credibility and reliability of research findings. In market research, triangulation serves as a quality assurance mechanism that helps identify and minimize bias, validate assumptions, and ensure accuracy in market estimates.
- Data Source Triangulation – Using multiple data sources to examine the same phenomenon
- Methodological Triangulation – Using multiple research methods to study the same research question
- Investigator Triangulation – Using multiple researchers or analysts to examine the same data
- Theoretical Triangulation – Using multiple theoretical perspectives to interpret the same data
Custom Market Research Services
We will customise the research for you, in case the report listed above does not meet your requirements.
Get 10% Free Customisation