Vector Supply Market Size, Share & Trends Analysis Report by Vector Type (Viral Vectors, Non-Viral Vectors), Product Type, Workflow/Process, Application, Therapeutic Area, Administration Route, End User and Geography (North America, Europe, Asia Pacific, Middle East, Africa and South America) – Global Industry Data, Trends and Forecasts, 2026–2035
Market Overview:
As per MarketGenics, the global vector supply market is experiencing significant growth, valued at USD 2.2 billion in 2025 and projected to reach USD 5.6 billion by 2035, expanding at a CAGR of 9.7% during the forecast period.
|
|
|
Segmental Data Insights |
|
|
Demand Trends |
|
|
Competitive Landscape |
|
|
Strategic Development |
|
|
Future Outlook & Opportunities |
|
Vector Supply Market Size, Share, and Growth
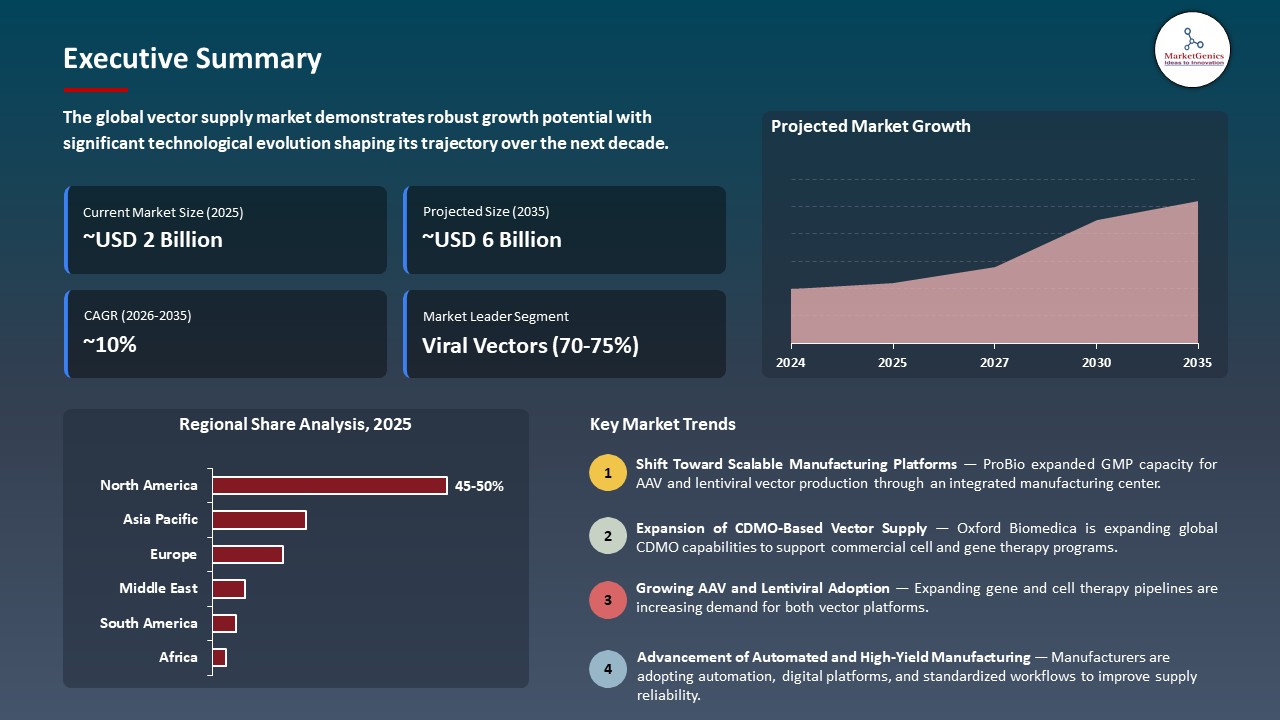
Dr. Sébastien Ribault, Chief Business Officer of OXB, said: “For emerging cell and gene therapy companies, viral vector development and manufacture represents a frequent bottleneck to clinical readiness, and issues can delay critical clinical milestones. The launch of our fast-track offering will make our proprietary inAAVate™ and LentiVector™ platforms accessible to a wider range of clients who are looking for an expedited route to GMP manufacture and the clinic, cutting industry standard development timelines by up to 50%.”
The growth of the cell and gene therapeutic pipeline is fueling the need for high quality viral vectors for more sophisticated clinical development and commercial scale therapeutic production. For instance, in July 2026, Immuneel Therapeutics and THSTI announced a strategic partnership to create a cGMP compliant CAR-T and lentiviral vector manufacturing site to augment existing vector-production capacity in the region.
Further, the adoption of vector manufacturing technologies is creating growth in the market by offering better manufacturing speed, scalability, yield, and process efficiency, along with decreasing manufacturing complexity and meeting the growing demand for viral vectors. For instance, in April 2025, Oxford Biomedica unveiled fast-track offering of AAV and lentiviral vectors based on its inAAVate and LentiVector platform, which shortened the AAV pathway to GMP manufacturing from around 15 months to as short as 7 months.
Adjacent opportunities for the global vector-supply-market include plasmid DNA manufacturing, cell and gene therapy CDMO services, non-viral gene delivery, AAV capsid engineering, and advanced bioprocessing technologies offer attractive expansion opportunities by complementing vector production and addressing downstream therapy-development requirements. These adjacent markets can broaden revenue streams, strengthen integrated manufacturing capabilities, and increase the strategic value of vector suppliers.
Vector Supply Market Dynamics and Trends
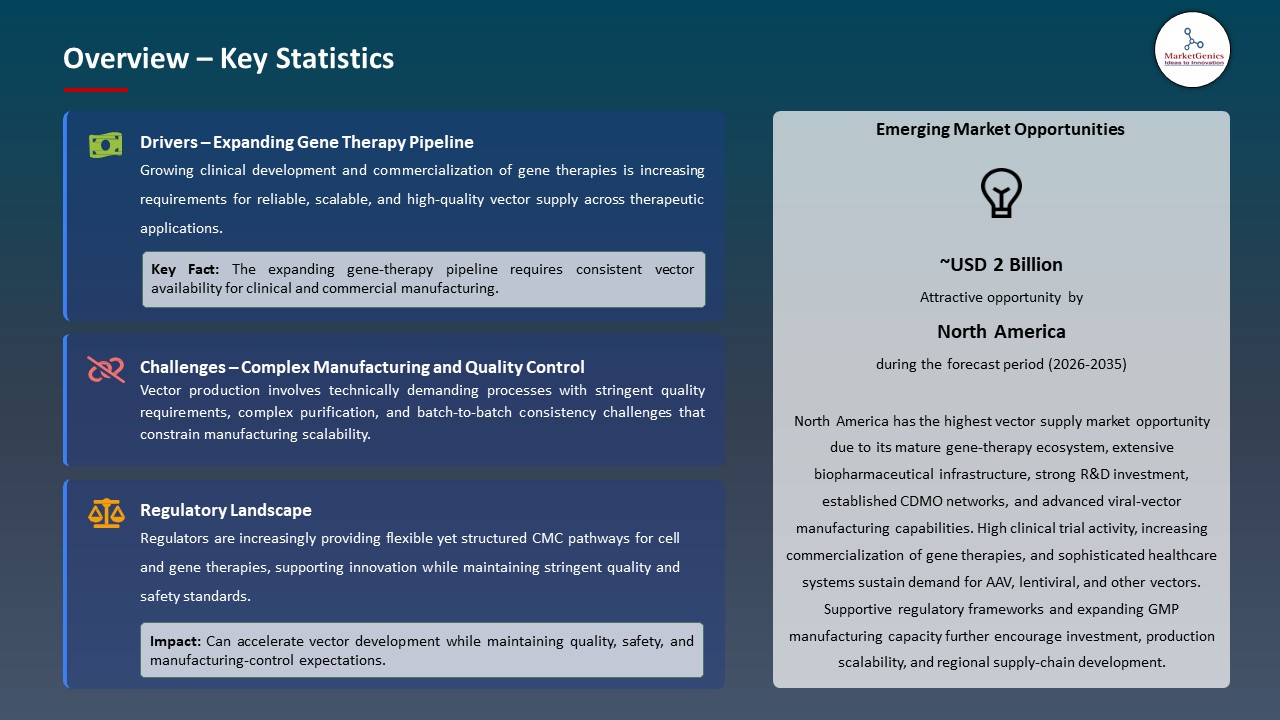
Driver: Expanding Gene Therapy Applications are Increasing Requirements for Specialized Vector Supply
- Reliable, high quality vector supply is growing in demand as these therapies increasingly enter the fields of oncology, rare diseases, inherited diseases and other therapeutic areas. Manufacturers are increasingly demanding reproducible, quality-assured, scalable vector platforms for AAV, lentiviral, adenoviral and other vectors as more programs move into the clinical and commercial phases.
- The larger commercial batches require vector manufacturing to ensure potency and purity, consistency, and compliance with regulatory standards, in addition to increasing production. In June 2026, FUJIFILM Biotechnologies announced the ongoing hurdle of moving viral-vector manufacturing from the bench to market, with a focus on yield, cost and regulatory challenges.
- The growing therapeutic use is directly resulting in an increased demand for scalable and commercially viable vector manufacturing capacities.
Restraint: Complex Manufacturing Processes and High Production Costs Constrain Vector Supply Expansion
- Complex upstream and downstream processes, high raw-material requirements, stringent quality controls, and difficulties achieving consistent yields continue to constrain efficient vector supply. The optimization of cell culture, transfection, harvesting, purification and analytical testing are especially critical for AAV production.
- The introduction of commercial scale production adds to the challenges of process consistency and cost control. These limitations can extend development timelines and manufacturing costs, especially for smaller biotechnology companies with fewer internal resources.
- The emergence of more efficient production systems is indicative of industry's efforts to tackle the manufacturing shortfalls that persist. However, commercially viable yields with regulatory grade quality is technically challenging and will limit the speed at which new vector capacity becomes available.
- Manufacturing complexity and cost pressures can constrain capacity growth and increase vector prices, and reduce flexibility in manufacturing.
Opportunity: Integrated CDMO Services Create Attractive Opportunities Across Vector Development and Manufacturing
- The increasing preference among biotechnology companies for outsourced development and manufacturing creates an opportunity for vector suppliers to provide integrated services spanning process development, vector production, analytical testing, regulatory support, and commercial manufacturing.
- Outsourcing provides emerging developers with specialized infrastructure without significant investment in dedicated GMP facilities and is an option for established pharmaceutical companies to manage fluctuations in the pipeline. This opportunity becomes more significant as therapies are moved from clinical batches into commercial-scale production.
- For instance, in March 2026, Lonza extended its commercial manufacturing agreement with Genetix Biotherapeutics to expand Houston capacity supporting demand for ZYNTEGLO, demonstrating how dedicated manufacturing partnerships can create long-term opportunities for vector and advanced-therapy suppliers.
- Integrated outsourcing models can boost supplier revenues, increase capacity utilization and enhance long-term customer relationships.
Key Trend: Platform-Based Vector Manufacturing is Accelerating Standardization Across Therapy Development Programs
- The platform-based manufacturing has emerged as a significant trend among vector suppliers, aimed at process standardization, decreased development variability, quicker timelines, and better technology transfer from clinical to commercial manufacturing.
- Standardized cell lines, plasmid systems, analytical methods and manufacturing workflows can minimize repetitive process development efforts and provide consistency among multiple therapeutic programs.
- The method is especially useful for AAV programs where developers are challenged to take laboratory processes to a scalable GMP manufacturing process. In 2026, Thermo Fisher Scientific continued to promote its standardized AAV and lentiviral manufacturing solutions, such as scalable technologies to minimize process variation and enable consistent manufacturing quality for gene therapy products.
- The integrated viral-vector workflow offers a standardized approach to repeatable and technology-driven manufacturing, allowing to avoid highly customized workflows for each individual therapeutic candidate.
Vector Supply Market Analysis and Segmental Data
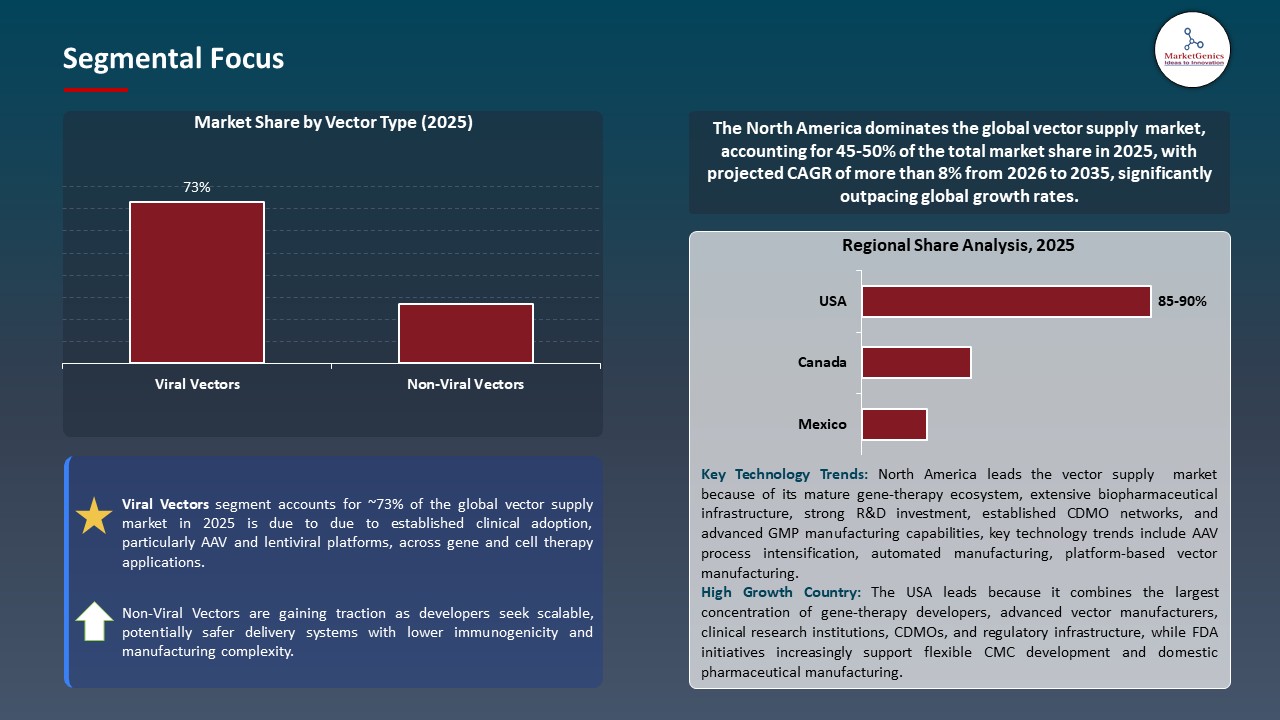
Viral Vectors Dominate Global Vector Supply Market
- The viral vectors segment dominates the global vector supply market due to clinical validation, commercial pipelines, and scalable GMP manufacturing of AAV and lentiviral platforms, which are established platforms in gene therapies and cell-based therapies, respectively.
- Their capacity to deliver genetic material to target cells with high efficiency remains to be the basis for their broad use in therapy. The growing shift from clinical development to commercialization is also driving the need for a more reliable and high-quality viral-vector manufacturing capacity.
- For instance, in July 2026, OXB selected an AAV gene-therapy program from Plowshare Therapies for process development and GMP manufacturing at its FDA-approved commercial-scale facility in Durham, North Carolina, demonstrating continued demand for scalable AAV supply.
- The growing use of AAV and lentiviral vectors will drive greater demand for scalable GMP vector manufacturing capacity and further global vector supply-chain growth.
North America Leads Global Vector Supply Market Demand
- North America leads the vector supply market is because of wide availability of GMP vector production capacity and CDMO expertise to provide AAV/lentiviral production on a scalable basis. For instance, in April 2026, Thermo Fisher Scientific has a number of viral-vector manufacturing facilities in North America and has manufactured more than 500 viral-vector products, which highlights a well-established North American manufacturing footprint.
- In addition, efforts by the U.S. government are improving domestic capacities for manufacturing viral vectors and standardizing processes. For instance, NIIMBL's Viral Vector Manufacturing program, funded by NIST, creates scalable manufacturing methods and analytical platforms for AAV gene-therapy vectors, enhancing U.S. supply-chain capabilities.
- North America's production capacity for vectors has been boosted by strong infrastructure and government initiatives, making vectors more scalable, standardized, and resilient to supply chain disruptions.
Vector Supply Market Ecosystem
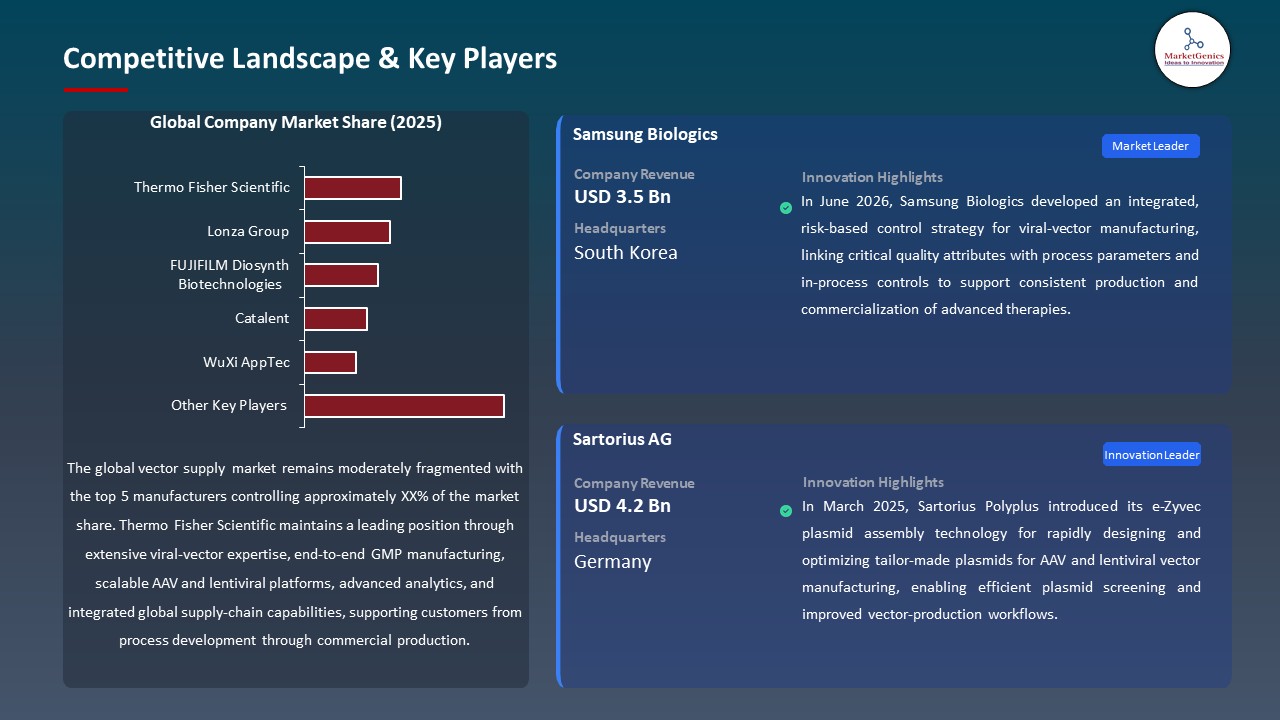
The global vector supply market is moderately fragmented, with Thermo Fisher Scientific, Lonza Group, FUJIFILM Diosynth Biotechnologies, Catalent, and WuXi AppTec maintaining strong positions through advanced viral-vector manufacturing technologies, GMP capabilities, and integrated CDMO services. Thermo Fisher, for example, provides end-to-end AAV, lentiviral, adenoviral, HSV, and retroviral manufacturing from development through commercial production.
Technological advancement is increasingly centered on producer-cell platforms and process optimization. In May 2026, Lonza demonstrated an inducible stable lentiviral-vector producer-cell line achieving up to 5 × 10⁷ TU/mL and stable productivity beyond 20 passages, supporting scalable manufacturing beyond 2,000 L.
Improvements of the stable producer-cell platforms are anticipated to increase vector productivity, consistency, scalability, and cost effectiveness of commercial manufacturing.
Recent Development and Strategic Overview:
- In May 2026, Lonza expanded its AAV offering with the Xcite AAV stable producer cell line platform to industrialize viral vector manufacturing, demonstrating 10–15-fold higher titers than transient transfection while improving scalability, process robustness, productivity, and cost efficiency.
- In February 2026, OXB signed a multi-year commercial supply agreement with Bristol Myers Squibb to manufacture and supply lentiviral vectors for CAR-T programs, strengthening scalable commercial manufacturing capacity across its UK and U.S. facilities.
Report Scope
|
Detail |
|
|
Market Size in 2025 |
USD 2.2 Bn |
|
Market Forecast Value in 2035 |
USD 5.6 Bn |
|
Growth Rate (CAGR) |
9.7% |
|
Forecast Period |
2026 – 2035 |
|
Historical Data Available for |
2021 – 2024 |
|
Market Size Units |
US$ Billion for Value |
|
Report Format |
Electronic (PDF) + Excel |
|
North America |
Europe |
Asia Pacific |
Middle East |
Africa |
South America |
|
|
|
|
|
|
|
Companies Covered |
|||||
Vector Supply Market Segmentation and Highlights
|
Segment |
Sub-segment |
|
Vector Supply Market, By Vector Type |
|
|
Vector Supply Market, By Product Type |
|
|
Vector Supply Market, By Workflow/Process |
|
|
Vector Supply Market, By Application |
|
|
Vector Supply Market, By Therapeutic Area |
|
|
Vector Supply Market, By Administration Route |
|
|
Vector Supply Market, By End User |
|
Frequently Asked Questions
Table of Contents
- 1. Research Methodology and Assumptions
- 1.1. Definitions
- 1.2. Research Design and Approach
- 1.3. Data Collection Methods
- 1.4. Base Estimates and Calculations
- 1.5. Forecasting Models
- 1.5.1. Key Forecast Factors & Impact Analysis
- 1.6. Secondary Research
- 1.6.1. Open Sources
- 1.6.2. Paid Databases
- 1.6.3. Associations
- 1.7. Primary Research
- 1.7.1. Primary Sources
- 1.7.2. Primary Interviews with Stakeholders across Ecosystem
- 2. Executive Summary
- 2.1. Global Vector Supply Market Outlook
- 2.1.1. Vector Supply Market Size (Value - US$ Bn), and Forecasts, 2021-2035
- 2.1.2. Compounded Annual Growth Rate Analysis
- 2.1.3. Growth Opportunity Analysis
- 2.1.4. Segmental Share Analysis
- 2.1.5. Geographical Share Analysis
- 2.2. Market Analysis and Facts
- 2.3. Supply-Demand Analysis
- 2.4. Competitive Benchmarking
- 2.5. Go-to- Market Strategy
- 2.5.1. Customer/ End-use Industry Assessment
- 2.5.2. Growth Opportunity Data, 2026-2035
- 2.5.2.1. Regional Data
- 2.5.2.2. Country Data
- 2.5.2.3. Segmental Data
- 2.5.3. Identification of Potential Market Spaces
- 2.5.4. GAP Analysis
- 2.5.5. Potential Attractive Price Points
- 2.5.6. Prevailing Market Risks & Challenges
- 2.5.7. Preferred Sales & Marketing Strategies
- 2.5.8. Key Recommendations and Analysis
- 2.5.9. A Way Forward
- 2.1. Global Vector Supply Market Outlook
- 3. Industry Data and Premium Insights
- 3.1. Global Healthcare & Pharmaceutical Industry Overview, 2025
- 3.1.1. Healthcare & Pharmaceutical Ecosystem Analysis
- 3.1.2. Key Trends for Healthcare & Pharmaceutical Industry
- 3.1.3. Regional Distribution for Healthcare & Pharmaceutical Industry
- 3.2. Supplier Customer Data
- 3.3. Technology Roadmap and Developments
- 3.1. Global Healthcare & Pharmaceutical Industry Overview, 2025
- 4. Market Overview
- 4.1. Market Dynamics
- 4.1.1. Drivers
- 4.1.1.1. Rising gene therapy adoption increases demand for viral vector manufacturing capacity
- 4.1.1.2. Expanding GMP facilities improve scalable and reliable vector production capabilities
- 4.1.1.3. Growing CDMO outsourcing expands access to specialized vector manufacturing expertise
- 4.1.2. Restraints
- 4.1.2.1. High manufacturing and quality-control costs constrain vector supply scalability
- 4.1.2.2. Stringent regulations increase qualification timelines and complicate vector manufacturing processes
- 4.1.1. Drivers
- 4.2. Key Trend Analysis
- 4.3. Regulatory Framework
- 4.3.1. Key Regulations, Norms, and Subsidies, by Key Countries
- 4.3.2. Tariffs and Standards
- 4.3.3. Impact Analysis of Regulations on the Market
- 4.4. Value Chain Analysis
- 4.4.1. Raw Material Suppliers
- 4.4.2. Vector Production
- 4.4.3. Purification & Formulation
- 4.4.4. Quality Control & Testing
- 4.4.5. Distribution & End Users
- 4.5. Porter’s Five Forces Analysis
- 4.6. PESTEL Analysis
- 4.7. Global Vector Supply Market Demand
- 4.7.1. Historical Market Size – in Value (US$ Bn), 2020-2024
- 4.7.2. Current and Future Market Size – in Value (US$ Bn), 2026–2035
- 4.7.2.1. Y-o-Y Growth Trends
- 4.7.2.2. Absolute $ Opportunity Assessment
- 4.1. Market Dynamics
- 5. Competition Landscape
- 5.1. Competition structure
- 5.1.1. Fragmented v/s consolidated
- 5.2. Company Share Analysis, 2025
- 5.2.1. Global Company Market Share
- 5.2.2. By Region
- 5.2.2.1. North America
- 5.2.2.2. Europe
- 5.2.2.3. Asia Pacific
- 5.2.2.4. Middle East
- 5.2.2.5. Africa
- 5.2.2.6. South America
- 5.3. Product Comparison Matrix
- 5.3.1. Specifications
- 5.3.2. Market Positioning
- 5.3.3. Pricing
- 5.1. Competition structure
- 6. Global Vector Supply Market Analysis, by Vector Type
- 6.1. Key Segment Analysis
- 6.2. Vector Supply Market Size (Value - US$ Bn), Analysis, and Forecasts, by Vector Type, 2021-2035
- 6.2.1. Viral Vectors
- 6.2.1.1. Adeno-Associated Virus (AAV)
- 6.2.1.2. Lentivirus
- 6.2.1.3. Adenovirus
- 6.2.1.4. Retrovirus
- 6.2.1.5. Herpes Simplex Virus (HSV)
- 6.2.1.6. Vaccinia Virus/Poxvirus
- 6.2.1.7. Others (Baculovirus, Sendai Virus, etc.)
- 6.2.2. Non-Viral Vectors
- 6.2.2.1. Plasmid DNA
- 6.2.2.2. mRNA/RNA-based Vectors
- 6.2.2.3. Lipid Nanoparticles (LNP)
- 6.2.2.4. Naked/Minicircle DNA
- 6.2.2.5. Polymer & Peptide-based Vectors
- 6.2.2.6. Others (Dendrimers, Exosomes, etc.)
- 6.2.1. Viral Vectors
- 7. Global Vector Supply Market Analysis, by Product Type
- 7.1. Key Segment Analysis
- 7.2. Vector Supply Market Size (Value - US$ Bn), Analysis, and Forecasts, by Product Type, 2021-2035
- 7.2.1. Vector/Plasmid DNA
- 7.2.2. Vector Manufacturing Services
- 7.2.3. Vector Purification & Analytical Services
- 7.2.4. Vector Storage & Distribution Services
- 8. Global Vector Supply Market Analysis, by Workflow/Process
- 8.1. Key Segment Analysis
- 8.2. Vector Supply Market Size (Value - US$ Bn), Analysis, and Forecasts, by Workflow/Process, 2021-2035
- 8.2.1. Upstream Processing
- 8.2.1.1. Cell Line/Bank Development
- 8.2.1.2. Transfection/Infection
- 8.2.1.3. Bioreactor Cultivation
- 8.2.2. Downstream Processing
- 8.2.2.1. Filtration
- 8.2.2.2. Chromatography/Purification
- 8.2.2.3. Fill-Finish
- 8.2.1. Upstream Processing
- 9. Global Vector Supply Market Analysis, by Application
- 9.1. Key Segment Analysis
- 9.2. Vector Supply Market Size (Value - US$ Bn), Analysis, and Forecasts, by Application, 2021-2035
- 9.2.1. Gene Therapy
- 9.2.2. Cell Therapy
- 9.2.3. Vaccine Development
- 9.2.4. Antisense & RNA Interference Therapy
- 9.2.5. Regenerative Medicine
- 9.2.6. Research & Academic Applications
- 9.2.7. Other Applications
- 10. Global Vector Supply Market Analysis, by Therapeutic Area
- 10.1. Key Segment Analysis
- 10.2. Vector Supply Market Size (Value - US$ Bn), Analysis, and Forecasts, by Therapeutic Area, 2021-2035
- 10.2.1. Oncology
- 10.2.2. Genetic & Rare Disorders
- 10.2.3. Infectious Diseases
- 10.2.4. Cardiovascular Diseases
- 10.2.5. Neurological Disorders
- 10.2.6. Ophthalmic Disorders
- 10.2.7. Others (Musculoskeletal, Metabolic, etc.)
- 11. Global Vector Supply Market Analysis, by Administration Route
- 11.1. Key Segment Analysis
- 11.2. Vector Supply Market Size (Value - US$ Bn), Analysis, and Forecasts, by Administration Route, 2021-2035
- 11.2.1. In Vivo Delivery
- 11.2.2. Ex Vivo Delivery
- 12. Global Vector Supply Market Analysis, by End User
- 12.1. Key Segment Analysis
- 12.2. Vector Supply Market Size (Value - US$ Bn), Analysis, and Forecasts, by End User, 2021-2035
- 12.2.1. Pharmaceutical Companies
- 12.2.2. Biotechnology Companies
- 12.2.3. CDMOs/CMOs
- 12.2.4. Academic & Research Institutes
- 12.2.5. Hospitals & Specialty Clinics
- 12.2.6. Government Research Organizations
- 12.2.7. Other End-users
- 13. Global Vector Supply Market Analysis, by Region
- 13.1. Key Findings
- 13.2. Vector Supply Market Size (Value - US$ Bn), Analysis, and Forecasts, by Region, 2021-2035
- 13.2.1. North America
- 13.2.2. Europe
- 13.2.3. Asia Pacific
- 13.2.4. Middle East
- 13.2.5. Africa
- 13.2.6. South America
- 14. North America Vector Supply Market Analysis
- 14.1. Key Segment Analysis
- 14.2. Regional Snapshot
- 14.3. North America Vector Supply Market Size (Value - US$ Bn), Analysis, and Forecasts, 2021-2035
- 14.3.1. Vector Type
- 14.3.2. Product Type
- 14.3.3. Workflow/Process
- 14.3.4. Application
- 14.3.5. Therapeutic Area
- 14.3.6. Administration Route
- 14.3.7. End User
- 14.3.8. Country
- 14.3.8.1. USA
- 14.3.8.2. Canada
- 14.3.8.3. Mexico
- 14.4. USA Vector Supply Market
- 14.4.1. Country Segmental Analysis
- 14.4.2. Vector Type
- 14.4.3. Product Type
- 14.4.4. Workflow/Process
- 14.4.5. Application
- 14.4.6. Therapeutic Area
- 14.4.7. Administration Route
- 14.4.8. End User
- 14.5. Canada Vector Supply Market
- 14.5.1. Country Segmental Analysis
- 14.5.2. Vector Type
- 14.5.3. Product Type
- 14.5.4. Workflow/Process
- 14.5.5. Application
- 14.5.6. Therapeutic Area
- 14.5.7. Administration Route
- 14.5.8. End User
- 14.6. Mexico Vector Supply Market
- 14.6.1. Country Segmental Analysis
- 14.6.2. Vector Type
- 14.6.3. Product Type
- 14.6.4. Workflow/Process
- 14.6.5. Application
- 14.6.6. Therapeutic Area
- 14.6.7. Administration Route
- 14.6.8. End User
- 15. Europe Vector Supply Market Analysis
- 15.1. Key Segment Analysis
- 15.2. Regional Snapshot
- 15.3. Europe Vector Supply Market Size (Value - US$ Bn), Analysis, and Forecasts, 2021-2035
- 15.3.1. Vector Type
- 15.3.2. Product Type
- 15.3.3. Workflow/Process
- 15.3.4. Application
- 15.3.5. Therapeutic Area
- 15.3.6. Administration Route
- 15.3.7. End User
- 15.3.8. Country
- 15.3.8.1. Germany
- 15.3.8.2. United Kingdom
- 15.3.8.3. France
- 15.3.8.4. Italy
- 15.3.8.5. Spain
- 15.3.8.6. Netherlands
- 15.3.8.7. Nordic Countries
- 15.3.8.8. Poland
- 15.3.8.9. Russia & CIS
- 15.3.8.10. Rest of Europe
- 15.4. Germany Vector Supply Market
- 15.4.1. Country Segmental Analysis
- 15.4.2. Vector Type
- 15.4.3. Product Type
- 15.4.4. Workflow/Process
- 15.4.5. Application
- 15.4.6. Therapeutic Area
- 15.4.7. Administration Route
- 15.4.8. End User
- 15.5. United Kingdom Vector Supply Market
- 15.5.1. Country Segmental Analysis
- 15.5.2. Vector Type
- 15.5.3. Product Type
- 15.5.4. Workflow/Process
- 15.5.5. Application
- 15.5.6. Therapeutic Area
- 15.5.7. Administration Route
- 15.5.8. End User
- 15.6. France Vector Supply Market
- 15.6.1. Country Segmental Analysis
- 15.6.2. Vector Type
- 15.6.3. Product Type
- 15.6.4. Workflow/Process
- 15.6.5. Application
- 15.6.6. Therapeutic Area
- 15.6.7. Administration Route
- 15.6.8. End User
- 15.7. Italy Vector Supply Market
- 15.7.1. Country Segmental Analysis
- 15.7.2. Vector Type
- 15.7.3. Product Type
- 15.7.4. Workflow/Process
- 15.7.5. Application
- 15.7.6. Therapeutic Area
- 15.7.7. Administration Route
- 15.7.8. End User
- 15.8. Spain Vector Supply Market
- 15.8.1. Country Segmental Analysis
- 15.8.2. Vector Type
- 15.8.3. Product Type
- 15.8.4. Workflow/Process
- 15.8.5. Application
- 15.8.6. Therapeutic Area
- 15.8.7. Administration Route
- 15.8.8. End User
- 15.9. Netherlands Vector Supply Market
- 15.9.1. Country Segmental Analysis
- 15.9.2. Vector Type
- 15.9.3. Product Type
- 15.9.4. Workflow/Process
- 15.9.5. Application
- 15.9.6. Therapeutic Area
- 15.9.7. Administration Route
- 15.9.8. End User
- 15.10. Nordic Countries Vector Supply Market
- 15.10.1. Country Segmental Analysis
- 15.10.2. Vector Type
- 15.10.3. Product Type
- 15.10.4. Workflow/Process
- 15.10.5. Application
- 15.10.6. Therapeutic Area
- 15.10.7. Administration Route
- 15.10.8. End User
- 15.11. Poland Vector Supply Market
- 15.11.1. Country Segmental Analysis
- 15.11.2. Vector Type
- 15.11.3. Product Type
- 15.11.4. Workflow/Process
- 15.11.5. Application
- 15.11.6. Therapeutic Area
- 15.11.7. Administration Route
- 15.11.8. End User
- 15.12. Russia & CIS Vector Supply Market
- 15.12.1. Country Segmental Analysis
- 15.12.2. Vector Type
- 15.12.3. Product Type
- 15.12.4. Workflow/Process
- 15.12.5. Application
- 15.12.6. Therapeutic Area
- 15.12.7. Administration Route
- 15.12.8. End User
- 15.13. Rest of Europe Vector Supply Market
- 15.13.1. Country Segmental Analysis
- 15.13.2. Vector Type
- 15.13.3. Product Type
- 15.13.4. Workflow/Process
- 15.13.5. Application
- 15.13.6. Therapeutic Area
- 15.13.7. Administration Route
- 15.13.8. End User
- 16. Asia Pacific Vector Supply Market Analysis
- 16.1. Key Segment Analysis
- 16.2. Regional Snapshot
- 16.3. Asia Pacific Vector Supply Market Size (Value - US$ Bn), Analysis, and Forecasts, 2021-2035
- 16.3.1. Vector Type
- 16.3.2. Product Type
- 16.3.3. Workflow/Process
- 16.3.4. Application
- 16.3.5. Therapeutic Area
- 16.3.6. Administration Route
- 16.3.7. End User
- 16.3.8. Country
- 16.3.8.1. China
- 16.3.8.2. India
- 16.3.8.3. Japan
- 16.3.8.4. South Korea
- 16.3.8.5. Australia and New Zealand
- 16.3.8.6. Indonesia
- 16.3.8.7. Malaysia
- 16.3.8.8. Thailand
- 16.3.8.9. Vietnam
- 16.3.8.10. Rest of Asia Pacific
- 16.4. China Vector Supply Market
- 16.4.1. Country Segmental Analysis
- 16.4.2. Vector Type
- 16.4.3. Product Type
- 16.4.4. Workflow/Process
- 16.4.5. Application
- 16.4.6. Therapeutic Area
- 16.4.7. Administration Route
- 16.4.8. End User
- 16.5. India Vector Supply Market
- 16.5.1. Country Segmental Analysis
- 16.5.2. Vector Type
- 16.5.3. Product Type
- 16.5.4. Workflow/Process
- 16.5.5. Application
- 16.5.6. Therapeutic Area
- 16.5.7. Administration Route
- 16.5.8. End User
- 16.6. Japan Vector Supply Market
- 16.6.1. Country Segmental Analysis
- 16.6.2. Vector Type
- 16.6.3. Product Type
- 16.6.4. Workflow/Process
- 16.6.5. Application
- 16.6.6. Therapeutic Area
- 16.6.7. Administration Route
- 16.6.8. End User
- 16.7. South Korea Vector Supply Market
- 16.7.1. Country Segmental Analysis
- 16.7.2. Vector Type
- 16.7.3. Product Type
- 16.7.4. Workflow/Process
- 16.7.5. Application
- 16.7.6. Therapeutic Area
- 16.7.7. Administration Route
- 16.7.8. End User
- 16.8. Australia and New Zealand Vector Supply Market
- 16.8.1. Country Segmental Analysis
- 16.8.2. Vector Type
- 16.8.3. Product Type
- 16.8.4. Workflow/Process
- 16.8.5. Application
- 16.8.6. Therapeutic Area
- 16.8.7. Administration Route
- 16.8.8. End User
- 16.9. Indonesia Vector Supply Market
- 16.9.1. Country Segmental Analysis
- 16.9.2. Vector Type
- 16.9.3. Product Type
- 16.9.4. Workflow/Process
- 16.9.5. Application
- 16.9.6. Therapeutic Area
- 16.9.7. Administration Route
- 16.9.8. End User
- 16.10. Malaysia Vector Supply Market
- 16.10.1. Country Segmental Analysis
- 16.10.2. Vector Type
- 16.10.3. Product Type
- 16.10.4. Workflow/Process
- 16.10.5. Application
- 16.10.6. Therapeutic Area
- 16.10.7. Administration Route
- 16.10.8. End User
- 16.11. Thailand Vector Supply Market
- 16.11.1. Country Segmental Analysis
- 16.11.2. Vector Type
- 16.11.3. Product Type
- 16.11.4. Workflow/Process
- 16.11.5. Application
- 16.11.6. Therapeutic Area
- 16.11.7. Administration Route
- 16.11.8. End User
- 16.12. Vietnam Vector Supply Market
- 16.12.1. Country Segmental Analysis
- 16.12.2. Vector Type
- 16.12.3. Product Type
- 16.12.4. Workflow/Process
- 16.12.5. Application
- 16.12.6. Therapeutic Area
- 16.12.7. Administration Route
- 16.12.8. End User
- 16.13. Rest of Asia Pacific Vector Supply Market
- 16.13.1. Country Segmental Analysis
- 16.13.2. Vector Type
- 16.13.3. Product Type
- 16.13.4. Workflow/Process
- 16.13.5. Application
- 16.13.6. Therapeutic Area
- 16.13.7. Administration Route
- 16.13.8. End User
- 17. Middle East Vector Supply Market Analysis
- 17.1. Key Segment Analysis
- 17.2. Regional Snapshot
- 17.3. Middle East Vector Supply Market Size (Value - US$ Bn), Analysis, and Forecasts, 2021-2035
- 17.3.1. Vector Type
- 17.3.2. Product Type
- 17.3.3. Workflow/Process
- 17.3.4. Application
- 17.3.5. Therapeutic Area
- 17.3.6. Administration Route
- 17.3.7. End User
- 17.3.8. Country
- 17.3.8.1. Turkey
- 17.3.8.2. UAE
- 17.3.8.3. Saudi Arabia
- 17.3.8.4. Israel
- 17.3.8.5. Rest of Middle East
- 17.4. Turkey Vector Supply Market
- 17.4.1. Country Segmental Analysis
- 17.4.2. Vector Type
- 17.4.3. Product Type
- 17.4.4. Workflow/Process
- 17.4.5. Application
- 17.4.6. Therapeutic Area
- 17.4.7. Administration Route
- 17.4.8. End User
- 17.5. UAE Vector Supply Market
- 17.5.1. Country Segmental Analysis
- 17.5.2. Vector Type
- 17.5.3. Product Type
- 17.5.4. Workflow/Process
- 17.5.5. Application
- 17.5.6. Therapeutic Area
- 17.5.7. Administration Route
- 17.5.8. End User
- 17.6. Saudi Arabia Vector Supply Market
- 17.6.1. Country Segmental Analysis
- 17.6.2. Vector Type
- 17.6.3. Product Type
- 17.6.4. Workflow/Process
- 17.6.5. Application
- 17.6.6. Therapeutic Area
- 17.6.7. Administration Route
- 17.6.8. End User
- 17.7. Israel Vector Supply Market
- 17.7.1. Country Segmental Analysis
- 17.7.2. Vector Type
- 17.7.3. Product Type
- 17.7.4. Workflow/Process
- 17.7.5. Application
- 17.7.6. Therapeutic Area
- 17.7.7. Administration Route
- 17.7.8. End User
- 17.8. Rest of Middle East Vector Supply Market
- 17.8.1. Country Segmental Analysis
- 17.8.2. Vector Type
- 17.8.3. Product Type
- 17.8.4. Workflow/Process
- 17.8.5. Application
- 17.8.6. Therapeutic Area
- 17.8.7. Administration Route
- 17.8.8. End User
- 18. Africa Vector Supply Market Analysis
- 18.1. Key Segment Analysis
- 18.2. Regional Snapshot
- 18.3. Africa Vector Supply Market Size (Value - US$ Bn), Analysis, and Forecasts, 2021-2035
- 18.3.1. Vector Type
- 18.3.2. Product Type
- 18.3.3. Workflow/Process
- 18.3.4. Application
- 18.3.5. Therapeutic Area
- 18.3.6. Administration Route
- 18.3.7. End User
- 18.3.8. Country
- 18.3.8.1. South Africa
- 18.3.8.2. Egypt
- 18.3.8.3. Nigeria
- 18.3.8.4. Algeria
- 18.3.8.5. Rest of Africa
- 18.4. South Africa Vector Supply Market
- 18.4.1. Country Segmental Analysis
- 18.4.2. Vector Type
- 18.4.3. Product Type
- 18.4.4. Workflow/Process
- 18.4.5. Application
- 18.4.6. Therapeutic Area
- 18.4.7. Administration Route
- 18.4.8. End User
- 18.5. Egypt Vector Supply Market
- 18.5.1. Country Segmental Analysis
- 18.5.2. Vector Type
- 18.5.3. Product Type
- 18.5.4. Workflow/Process
- 18.5.5. Application
- 18.5.6. Therapeutic Area
- 18.5.7. Administration Route
- 18.5.8. End User
- 18.6. Nigeria Vector Supply Market
- 18.6.1. Country Segmental Analysis
- 18.6.2. Vector Type
- 18.6.3. Product Type
- 18.6.4. Workflow/Process
- 18.6.5. Application
- 18.6.6. Therapeutic Area
- 18.6.7. Administration Route
- 18.6.8. End User
- 18.7. Algeria Vector Supply Market
- 18.7.1. Country Segmental Analysis
- 18.7.2. Vector Type
- 18.7.3. Product Type
- 18.7.4. Workflow/Process
- 18.7.5. Application
- 18.7.6. Therapeutic Area
- 18.7.7. Administration Route
- 18.7.8. End User
- 18.8. Rest of Africa Vector Supply Market
- 18.8.1. Country Segmental Analysis
- 18.8.2. Vector Type
- 18.8.3. Product Type
- 18.8.4. Workflow/Process
- 18.8.5. Application
- 18.8.6. Therapeutic Area
- 18.8.7. Administration Route
- 18.8.8. End User
- 19. South America Vector Supply Market Analysis
- 19.1. Key Segment Analysis
- 19.2. Regional Snapshot
- 19.3. South America Vector Supply Market Size (Value - US$ Bn), Analysis, and Forecasts, 2021-2035
- 19.3.1. Vector Type
- 19.3.2. Product Type
- 19.3.3. Workflow/Process
- 19.3.4. Application
- 19.3.5. Therapeutic Area
- 19.3.6. Administration Route
- 19.3.7. End User
- 19.3.8. Country
- 19.3.8.1. Brazil
- 19.3.8.2. Argentina
- 19.3.8.3. Rest of South America
- 19.4. Brazil Vector Supply Market
- 19.4.1. Country Segmental Analysis
- 19.4.2. Vector Type
- 19.4.3. Product Type
- 19.4.4. Workflow/Process
- 19.4.5. Application
- 19.4.6. Therapeutic Area
- 19.4.7. Administration Route
- 19.4.8. End User
- 19.5. Argentina Vector Supply Market
- 19.5.1. Country Segmental Analysis
- 19.5.2. Vector Type
- 19.5.3. Product Type
- 19.5.4. Workflow/Process
- 19.5.5. Application
- 19.5.6. Therapeutic Area
- 19.5.7. Administration Route
- 19.5.8. End User
- 19.6. Rest of South America Vector Supply Market
- 19.6.1. Country Segmental Analysis
- 19.6.2. Vector Type
- 19.6.3. Product Type
- 19.6.4. Workflow/Process
- 19.6.5. Application
- 19.6.6. Therapeutic Area
- 19.6.7. Administration Route
- 19.6.8. End User
- 20. Key Players/ Company Profile
- 20.1. ABL Inc.
- 20.1.1. Company Details/ Overview
- 20.1.2. Company Financials
- 20.1.3. Key Customers and Competitors
- 20.1.4. Business/ Industry Portfolio
- 20.1.5. Product Portfolio/ Specification Details
- 20.1.6. Pricing Data
- 20.1.7. Strategic Overview
- 20.1.8. Recent Developments
- 20.2. Andelyn Biosciences
- 20.3. Batavia Biosciences
- 20.4. C.H. Boehringer Sohn AG & Co. KG
- 20.5. Catalent
- 20.6. Charles River Laboratories
- 20.7. Cytiva (Pall Corporation)
- 20.8. FUJIFILM Diosynth Biotechnologies
- 20.9. Lonza Group
- 20.10. Merck KGaA
- 20.11. Oxford Biomedica
- 20.12. Samsung Biologics
- 20.13. Sartorius AG
- 20.14. Thermo Fisher Scientific
- 20.15. WuXi AppTec
- 20.16. Others
- 20.1. ABL Inc.
Note* - This is just tentative list of players. While providing the report, we will cover more number of players based on their revenue and share for each geography
Research Design
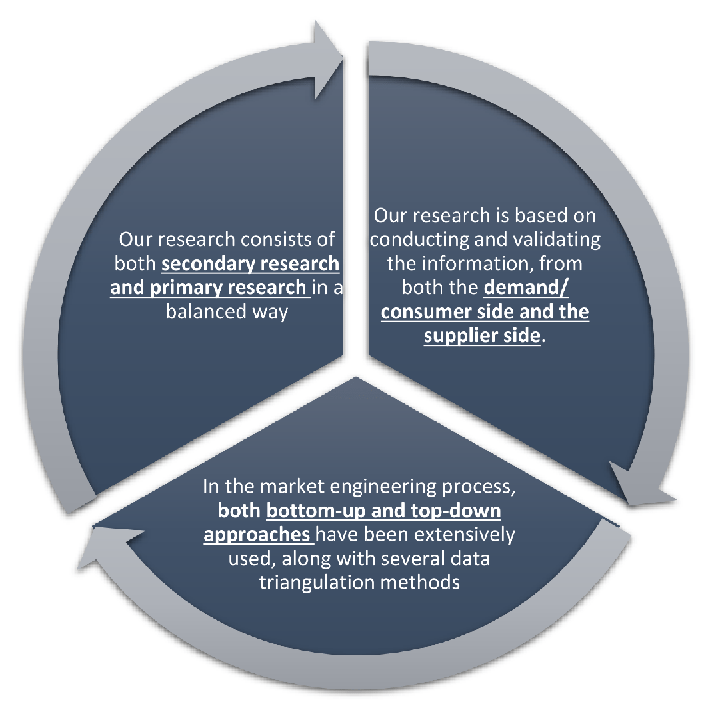
Our research design integrates both demand-side and supply-side analysis through a balanced combination of primary and secondary research methodologies. By utilizing both bottom-up and top-down approaches alongside rigorous data triangulation methods, we deliver robust market intelligence that supports strategic decision-making.
MarketGenics' comprehensive research design framework ensures the delivery of accurate, reliable, and actionable market intelligence. Through the integration of multiple research approaches, rigorous validation processes, and expert analysis, we provide our clients with the insights needed to make informed strategic decisions and capitalize on market opportunities.
MarketGenics leverages a dedicated industry panel of experts and a comprehensive suite of paid databases to effectively collect, consolidate, and analyze market intelligence.
Our approach has consistently proven to be reliable and effective in generating accurate market insights, identifying key industry trends, and uncovering emerging business opportunities.
Through both primary and secondary research, we capture and analyze critical company-level data such as manufacturing footprints, including technical centers, R&D facilities, sales offices, and headquarters.
Our expert panel further enhances our ability to estimate market size for specific brands based on validated field-level intelligence.
Our data mining techniques incorporate both parametric and non-parametric methods, allowing for structured data collection, sorting, processing, and cleaning.
Demand projections are derived from large-scale data sets analyzed through proprietary algorithms, culminating in robust and reliable market sizing.
Research Approach
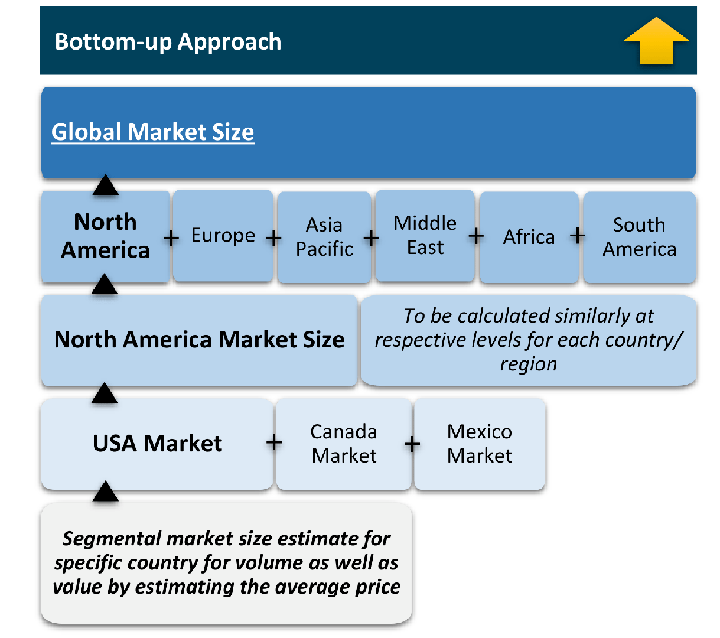
The bottom-up approach builds market estimates by starting with the smallest addressable market units and systematically aggregating them to create comprehensive market size projections.
This method begins with specific, granular data points and builds upward to create the complete market landscape.
Customer Analysis → Segmental Analysis → Geographical Analysis
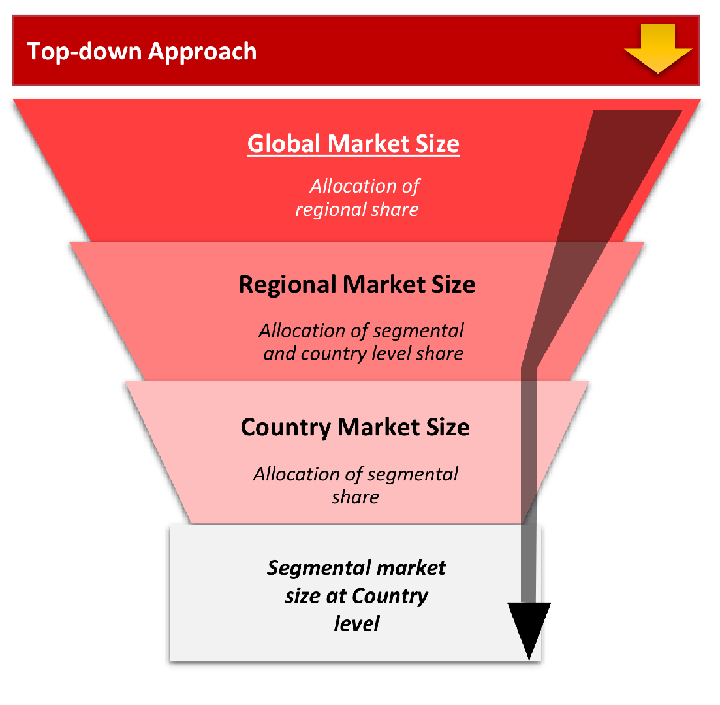
The top-down approach starts with the broadest possible market data and systematically narrows it down through a series of filters and assumptions to arrive at specific market segments or opportunities.
This method begins with the big picture and works downward to increasingly specific market slices.
TAM → SAM → SOM
Research Methods
Desk / Secondary Research
While analysing the market, we extensively study secondary sources, directories, and databases to identify and collect information useful for this technical, market-oriented, and commercial report. Secondary sources that we utilize are not only the public sources, but it is a combination of Open Source, Associations, Paid Databases, MG Repository & Knowledgebase, and others.
- Company websites, annual reports, financial reports, broker reports, and investor presentations
- National government documents, statistical databases and reports
- News articles, press releases and web-casts specific to the companies operating in the market, Magazines, reports, and others
- We gather information from commercial data sources for deriving company specific data such as segmental revenue, share for geography, product revenue, and others
- Internal and external proprietary databases (industry-specific), relevant patent, and regulatory databases
- Governing Bodies, Government Organizations
- Relevant Authorities, Country-specific Associations for Industries
We also employ the model mapping approach to estimate the product level market data through the players' product portfolio
Primary Research
Primary research/ interviews is vital in analyzing the market. Most of the cases involves paid primary interviews. Primary sources include primary interviews through e-mail interactions, telephonic interviews, surveys as well as face-to-face interviews with the different stakeholders across the value chain including several industry experts.
| Type of Respondents | Number of Primaries |
|---|---|
| Tier 2/3 Suppliers | ~20 |
| Tier 1 Suppliers | ~25 |
| End-users | ~25 |
| Industry Expert/ Panel/ Consultant | ~30 |
| Total | ~100 |
MG Knowledgebase
• Repository of industry blog, newsletter and case studies
• Online platform covering detailed market reports, and company profiles
Forecasting Factors and Models
Forecasting Factors
- Historical Trends – Past market patterns, cycles, and major events that shaped how markets behave over time. Understanding past trends helps predict future behavior.
- Industry Factors – Specific characteristics of the industry like structure, regulations, and innovation cycles that affect market dynamics.
- Macroeconomic Factors – Economic conditions like GDP growth, inflation, and employment rates that affect how much money people have to spend.
- Demographic Factors – Population characteristics like age, income, and location that determine who can buy your product.
- Technology Factors – How quickly people adopt new technology and how much technology infrastructure exists.
- Regulatory Factors – Government rules, laws, and policies that can help or restrict market growth.
- Competitive Factors – Analyzing competition structure such as degree of competition and bargaining power of buyers and suppliers.
Forecasting Models / Techniques
Multiple Regression Analysis
- Identify and quantify factors that drive market changes
- Statistical modeling to establish relationships between market drivers and outcomes
Time Series Analysis – Seasonal Patterns
- Understand regular cyclical patterns in market demand
- Advanced statistical techniques to separate trend, seasonal, and irregular components
Time Series Analysis – Trend Analysis
- Identify underlying market growth patterns and momentum
- Statistical analysis of historical data to project future trends
Expert Opinion – Expert Interviews
- Gather deep industry insights and contextual understanding
- In-depth interviews with key industry stakeholders
Multi-Scenario Development
- Prepare for uncertainty by modeling different possible futures
- Creating optimistic, pessimistic, and most likely scenarios
Time Series Analysis – Moving Averages
- Sophisticated forecasting for complex time series data
- Auto-regressive integrated moving average models with seasonal components
Econometric Models
- Apply economic theory to market forecasting
- Sophisticated economic models that account for market interactions
Expert Opinion – Delphi Method
- Harness collective wisdom of industry experts
- Structured, multi-round expert consultation process
Monte Carlo Simulation
- Quantify uncertainty and probability distributions
- Thousands of simulations with varying input parameters
Research Analysis
Our research framework is built upon the fundamental principle of validating market intelligence from both demand and supply perspectives. This dual-sided approach ensures comprehensive market understanding and reduces the risk of single-source bias.
Demand-Side Analysis: We understand end-user/application behavior, preferences, and market needs along with the penetration of the product for specific application.
Supply-Side Analysis: We estimate overall market revenue, analyze the segmental share along with industry capacity, competitive landscape, and market structure.
Validation & Evaluation
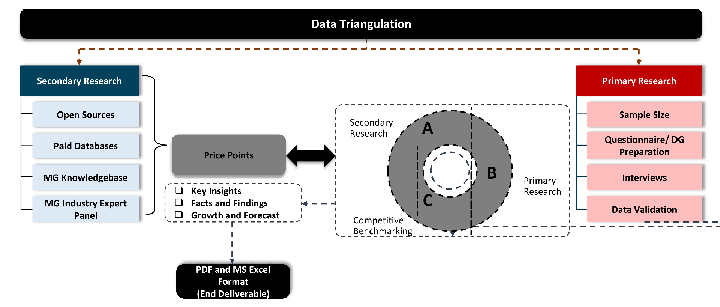
Data triangulation is a validation technique that uses multiple methods, sources, or perspectives to examine the same research question, thereby increasing the credibility and reliability of research findings. In market research, triangulation serves as a quality assurance mechanism that helps identify and minimize bias, validate assumptions, and ensure accuracy in market estimates.
- Data Source Triangulation – Using multiple data sources to examine the same phenomenon
- Methodological Triangulation – Using multiple research methods to study the same research question
- Investigator Triangulation – Using multiple researchers or analysts to examine the same data
- Theoretical Triangulation – Using multiple theoretical perspectives to interpret the same data
Custom Market Research Services
We will customise the research for you, in case the report listed above does not meet your requirements.
Get 10% Free Customisation