Energy Digital Twins Market Size, Share & Trends Analysis Report by Twin Type (Asset Twin, System Twin, Process Twin, Network/Grid Twin, Enterprise Twin), Technology Enabler, Functionality, Asset Type, Connectivity Architecture, End-users and Geography (North America, Europe, Asia Pacific, Middle East, Africa and South America) – Global Industry Data, Trends and Forecasts, 2026–2035
|
|
|
Segmental Data Insights |
|
|
Demand Trends |
|
|
Competitive Landscape |
|
|
Strategic Development |
|
|
Future Outlook & Opportunities |
|
Energy-Digital-Twins-Market Size, Share, and Growth
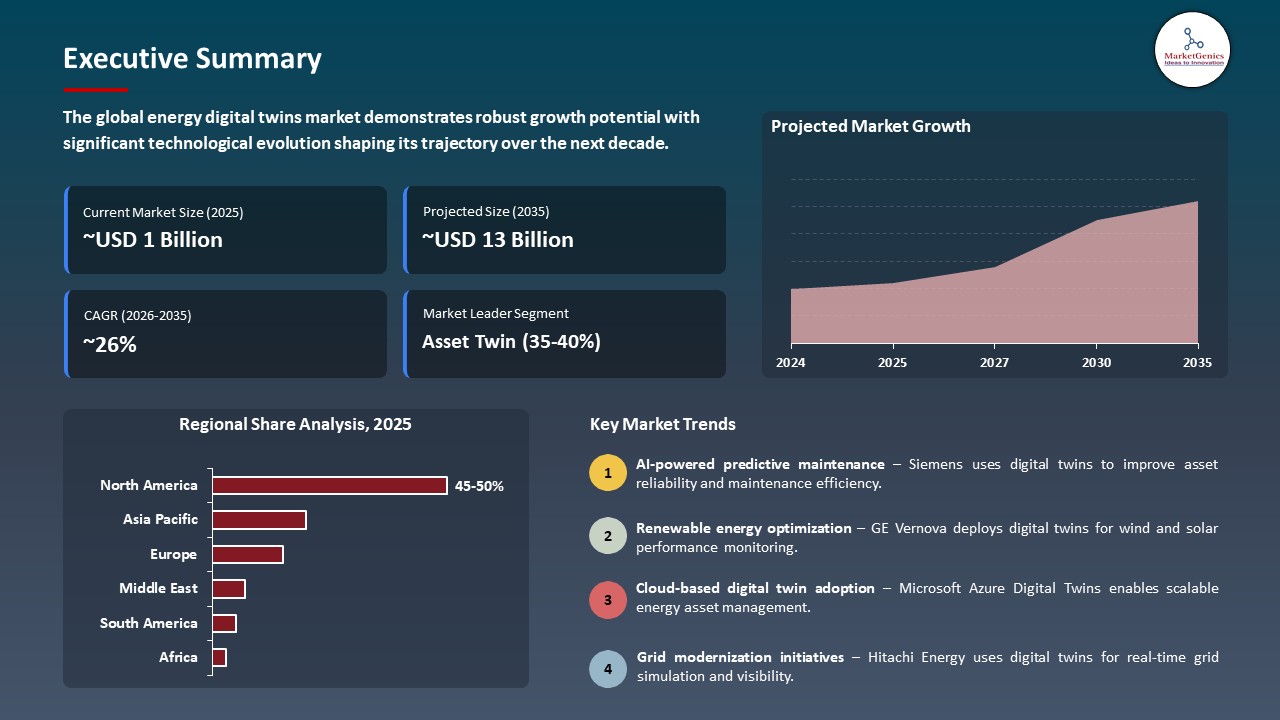
The global energy digital twins market is exhibiting strong growth, with an estimated value of USD 1.3 billion in 2025 and USD 13.4 billion by 2035, achieving a CAGR of 26.3%, during the forecast period. Asia Pacific leads fastest growth due to rapid urbanization, expanding power demand, strong renewable energy integration, government-led smart grid initiatives, and large-scale investments in digital energy infrastructure and automation technologies.
Sabine Erlinghagen, CEO of Siemens Grid Software said, “Collaborating with the Italian DSO, AcegasApsAmga, presents a key opportunity for the utility to leverage Siemens’ digital twin technology to simulate, monitor, and manage energy flows in real time, ensuring efficient operations and supporting sustainability goals."
AI-powered digital twins are helping utilities to enhance grid reliability and facilitate predictive maintenance by monitoring and optimizing assets in real-time. In March 2025, Schneider Electric and ETAP announced a new, advanced digital twin, leveraging NVIDIA Omniverse, that models grid-to-chip power systems to provide real-time insights and predictive optimization. This will help make the grid more resilient, respond faster to faults, and be more efficient in its operations.
Furthermore, the increasing share of renewables is increasing the need to use digital twins technology for the grid balancing and scenario modelling to deal with variability and maintain stable grid operations. For example, Siemens Energy has enhanced Siemens Xcelerator and grid-scale digital twins to simulate the integration of renewables and boost dispatch reliability for large wind and solar fleets. This is enhancing the flexibility and reliability of the grid, and allows for a more efficient integration of high penetrations of VREs.
Adjacent opportunities for the global energy digital twins market include smart grid analytics, predictive maintenance platforms, industrial IoT energy monitoring, AI-driven energy trading systems, and virtual power plant optimization solutions. These adjacent areas expand digital twin applications across energy ecosystems, enabling broader system intelligence, efficiency, and decarbonization across power infrastructure.
Energy Digital Twins Market Dynamics and Trends
Driver: AI-driven Digital Twins Enhancing Grid Reliability and Asset Performance Optimization
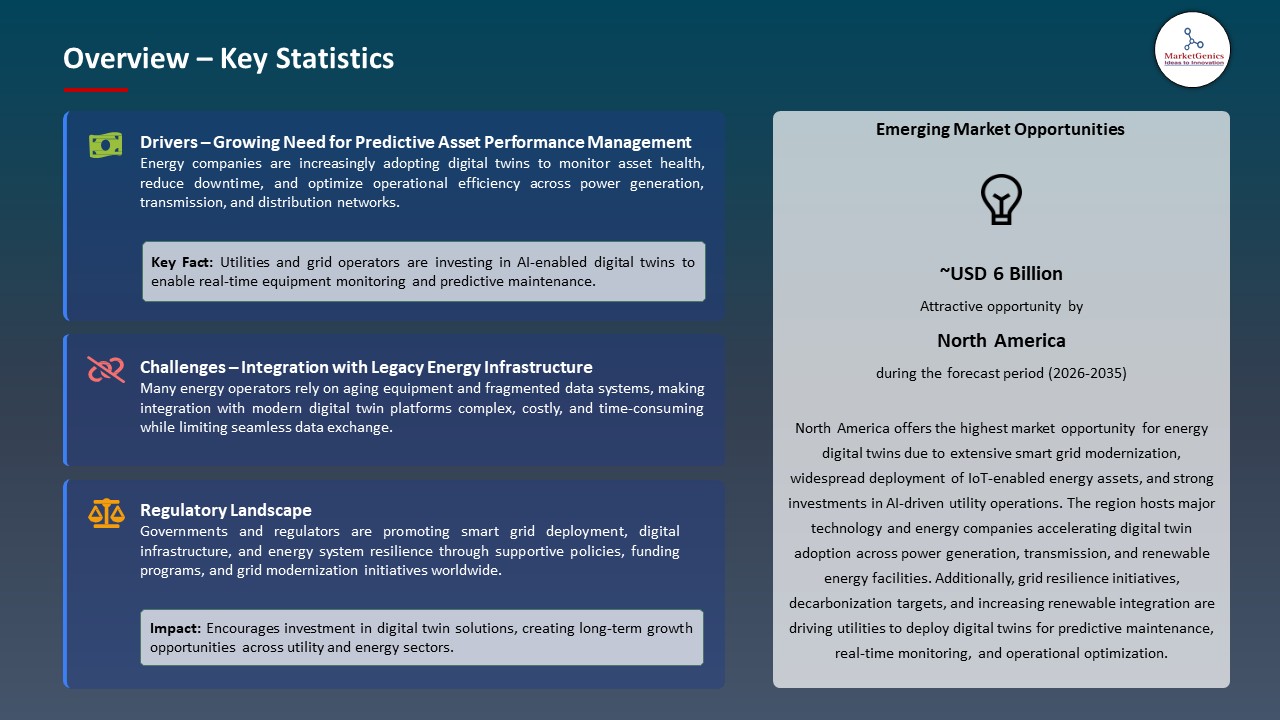
- The energy digital twins market is being driven by the use of AI for digital twins of the grid, which is helping to improve the reliability and performance of energy assets. With utilities increasingly turning to intelligent simulation to maintain the complex and evolving power grid, AI-driven digital twins are a significant factor in the energy digital twins market. They combine real-time data, AI, and physics-based models into virtual replicas of the grid, allowing for constant monitoring, quicker fault detection, optimal maintenance and reduced unplanned outages.
- In March 2026, Hitachi Energy introduced HMAX Energy, an AI-powered digital twin suite for grid assets, which supports predictive maintenance, fault detection and lifecycle optimization across HVDC systems, transformers, and substations, helping to lower equipment-related revenue losses by up to 60%.
- Furthermore, with growing system variability due to integration of renewables and electrification, digital twins enable critical decision-support features.
- This enhances the efficiency of operations, prolongs asset lifecycle and provides reliable, resilient and affordable power service in the modern energy network.
Restraint: Legacy Grid Integration Gaps Continue to Slow Deployment Momentum
- One significant constraint is the ability to embed digital twins in the existing grid-based infrastructure, which remains dependent on outdated control architectures, data systems, and communication protocols. It can be more difficult to get the data flowing constantly to enable high fidelity simulation and operability.
- For instance, the introduction of ABB's UNITROL 8000 in October 2025 served as an illustration of the need for vendors to offer solutions that address legacy integration challenges, with a focus on modular digital capabilities, communication protocol compatibility, and the ability to adapt to changing requirements over time to facilitate modernization of brownfield utility assets.
- Complicates digital twin deployment, extends the deployment timeline and modernization expenses of utility networks, reduces interoperability of real-time data and slows the speed of full-scale digital transformation of legacy grid infrastructure.
Opportunity: Grid Digital Twins Are Creating New Value in Distributed Energy Orchestration
- Distributed energy resources like solar, wind and energy storage are driving big opportunity for the energy digital twins market. To deal with decentralized and variable power generation, utilities need advanced simulation and optimization tools.
- Digital twins can be used to monitor, model, analyze and balance congestion and loads across complex grid networks in real-time, enhancing operational visibility and decision making. This helps to increase the flexibility and resilience of the grid, as well as to promote more efficient wind and solar power integration and move towards a more decentralized energy system.
- For example, GE Vernova's GridOS brings together intelligent grid applications and partner ecosystem to further improve the orchestration of the grid and drive the energy transition faster. This exemplifies the role of digital twins in facilitating improved coordination of distributed assets and in facilitating scalable renewable integration.
Key Trend: AI-linked Digital Twin Platforms Are Becoming the New Energy Software Standard
- AI-powered digital twin platforms have become a significant trend in the energy industry, representing utilities' transition toward intelligent, self-learning systems that integrate artificial intelligence, real-time operational data, and sophisticated simulation features.
- This transformation is taking digital twins from a static model of assets to dynamic platforms that learn, predict and optimize grid performance from generation to transmission and distribution networks. These platforms facilitate quicker decision-making, improved forecasting, and robust operational resilience, especially as energy systems grow increasingly decentralized and data-driven.
- For instance, Siemens released Digital Twin Composer in January 2026, introducing AI-powered simulation, NVIDIA Omniverse libraries, and real-world data to produce adaptive digital twin environments for AI-enabled energy systems in the real world.
- Enables the intelligent grid transformation by providing real-time optimization, better forecasting, and more autonomous operation of the energy system.
Energy Digital Twins Market Analysis and Segmental Data
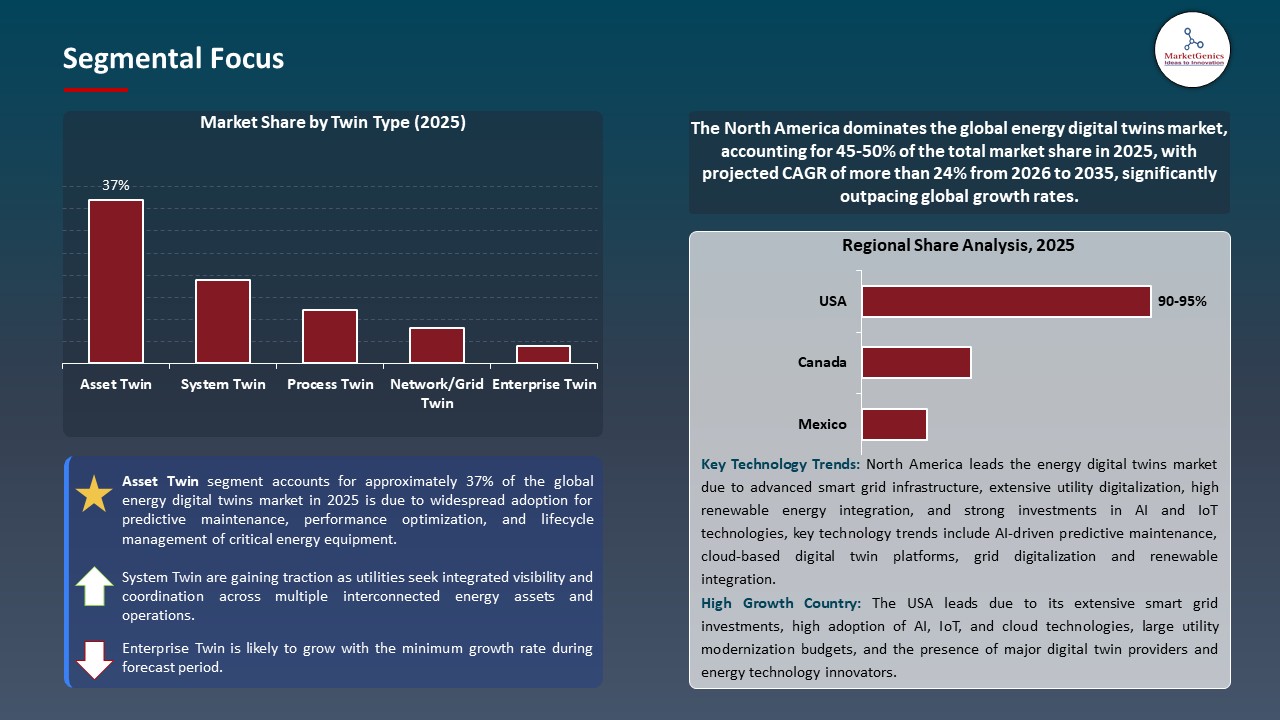
Asset Twin Dominate Global Energy Digital Twins Market
- The asset twin segment leads the global energy digital twins market given the focus of utilities and industrial operators on equipment-level visibility, predictive maintenance and lifecycle optimization of critical equipment like turbines, transformers, and generators. Granular insights in real-time fault detection and performance optimization are the ones most widely adopted and form the asset twins segment.
- For example, Asset Performance Management (APM) and digital twin solutions under Siemens Energy's Xcelerator platform. These solutions develop virtual copies of each energy resource and simulate its degradation, forecast failure, and schedule maintenance.
- This feature will help utilities greatly decrease unplanned downtime, extend asset life, and create more efficient operations, further anchoring the power of asset twins in the global energy digital twins landscape.
North America Leads Global Energy Digital Twins Market Demand
- Large-scale initiatives to modernize energy grids in North America are likely to be heavily driven by government support for AI, IoT, and digital twin technologies to strengthen energy grid resilience and reliability, which will fuel the growth of the energy digital twins market. The U.S. Department of Energy (DOE), for instance, is promoting the use of new digital grid technologies, such as real-time grid modeling, predictive analytics, and digital twin applications for grid infrastructure enhancements to make the grid more efficient and reliable, with funding for the Grid Modernization Initiative.
- Moreover, the dominance of North America is facilitated by the swift adoption of AI-powered digital twin platforms by key utilities and technology companies for real-time grid monitoring, predictive maintenance, renewable integration and enhancing operational efficiency within increasingly complex and decentralized energy infrastructure systems.
- These factors are powering digital transformation of energy systems, boosting grid reliability, optimizing system operations, and fostering widespread use of AI-based energy digital twin solutions in North America.
Energy Digital Twins Market Ecosystem
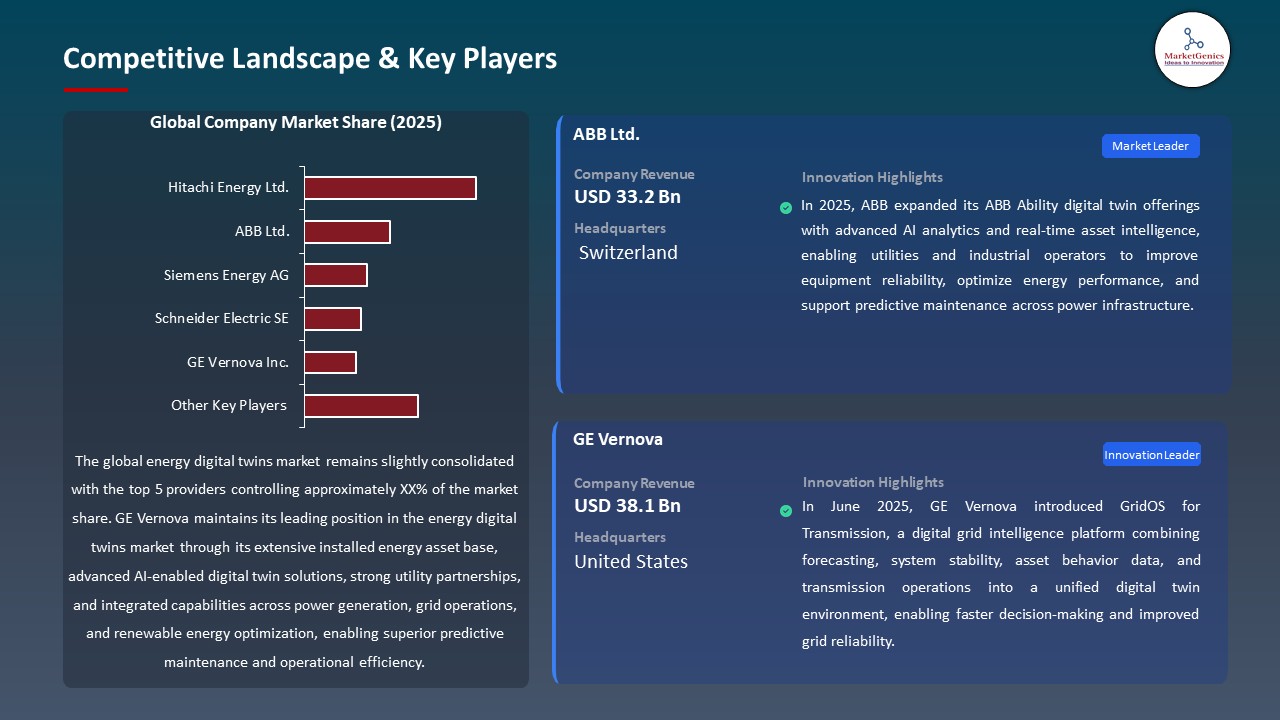
The global energy digital twins market is slightly consolidated, with leading players such as GE Vernova, Schneider Electric, ABB, IBM, and Honeywell International dominating through advanced AI, IoT, cloud computing, and physics-based simulation technologies that strengthen grid intelligence and asset optimization capabilities across energy systems.
These firms specialise in specific digital twin solutions to meet the unique needs of the power generation, transmission and industrial energy management sectors. For example, GE Vernova has introduced grid digital twins, Schneider Electric wets its hands with simulation tools powered by its EcoStruxure, and ABB has developed ABB Ability asset twins, and IBM has introduced a watsonx-powered predictive model, all of which help usher in a new era of real-time monitoring and predictive maintenance. The developments are helping to enhance the reliability of the electricity grid, minimize downtime and support decision-making in power networks that is more intelligent and efficient, based on data.
Recent Development and Strategic Overview:
- In February 2026, GE Vernova launched GridOS for Distribution, a unified grid orchestration platform integrating real-time operations, DER management, network modeling, and AI-driven intelligence. The solution enables utilities to create advanced grid digital twins for enhanced resilience, predictive analytics, and distributed energy management.
- In February 2026, Schneider Electric and ETAP launched a physics-based digital twin for utilities and critical infrastructure. The platform provides engineering-grade simulations, contingency analysis, switching validation, and lifecycle continuity, helping utilities improve grid resilience, operational efficiency, and modernization planning.
Report Scope
|
Detail |
|
|
Market Size in 2025 |
USD 1.3 Bn |
|
Market Forecast Value in 2035 |
USD 13.4 Bn |
|
Growth Rate (CAGR) |
26.3% |
|
Forecast Period |
2026 – 2035 |
|
Historical Data Available for |
2021 – 2024 |
|
Market Size Units |
US$ Billion for Value |
|
Report Format |
Electronic (PDF) + Excel |
|
North America |
Europe |
Asia Pacific |
Middle East |
Africa |
South America |
|
|
|
|
|
|
|
Companies Covered |
|||||
|
|
|
||||
Energy Digital Twins Market Segmentation and Highlights
|
Segment |
Sub-segment |
|
Energy Digital Twins Market, By Twin Type |
|
|
Energy Digital Twins Market, By Technology Enabler |
|
|
Energy Digital Twins Market, By Functionality |
|
|
Energy Digital Twins Market, By Asset Type |
|
|
Energy Digital Twins Market, By Connectivity Architecture |
|
|
Energy Digital Twins Market, By End-users |
|
Frequently Asked Questions
Table of Contents
- 1. Research Methodology and Assumptions
- 1.1. Definitions
- 1.2. Research Design and Approach
- 1.3. Data Collection Methods
- 1.4. Base Estimates and Calculations
- 1.5. Forecasting Models
- 1.5.1. Key Forecast Factors & Impact Analysis
- 1.6. Secondary Research
- 1.6.1. Open Sources
- 1.6.2. Paid Databases
- 1.6.3. Associations
- 1.7. Primary Research
- 1.7.1. Primary Sources
- 1.7.2. Primary Interviews with Stakeholders across Ecosystem
- 2. Executive Summary
- 2.1. Global Energy Digital Twins Market Outlook
- 2.1.1. Energy Digital Twins Market Size (Value - US$ Bn), and Forecasts, 2021-2035
- 2.1.2. Compounded Annual Growth Rate Analysis
- 2.1.3. Growth Opportunity Analysis
- 2.1.4. Segmental Share Analysis
- 2.1.5. Geographical Share Analysis
- 2.2. Market Analysis and Facts
- 2.3. Supply-Demand Analysis
- 2.4. Competitive Benchmarking
- 2.5. Go-to- Market Strategy
- 2.5.1. Customer/ End-use Industry Assessment
- 2.5.2. Growth Opportunity Data, 2026-2035
- 2.5.2.1. Regional Data
- 2.5.2.2. Country Data
- 2.5.2.3. Segmental Data
- 2.5.3. Identification of Potential Market Spaces
- 2.5.4. GAP Analysis
- 2.5.5. Potential Attractive Price Points
- 2.5.6. Prevailing Market Risks & Challenges
- 2.5.7. Preferred Sales & Marketing Strategies
- 2.5.8. Key Recommendations and Analysis
- 2.5.9. A Way Forward
- 2.1. Global Energy Digital Twins Market Outlook
- 3. Industry Data and Premium Insights
- 3.1. Global Energy & Power Industry Overview, 2025
- 3.1.1. Energy & Power Ecosystem Analysis
- 3.1.2. Key Trends for Energy & Power Industry
- 3.1.3. Regional Distribution for Energy & Power Industry
- 3.2. Supplier Customer Data
- 3.3. Technology Roadmap and Developments
- 3.4. Trade Analysis
- 3.4.1. Import & Export Analysis, 2025
- 3.4.2. Top Importing Countries
- 3.4.3. Top Exporting Countries
- 3.5. Trump Tariff Impact Analysis
- 3.5.1. Manufacturer
- 3.5.1.1. Based on the component & Raw material
- 3.5.2. Supply Chain
- 3.5.3. End Consumer
- 3.5.1. Manufacturer
- 3.6. Raw Material Analysis
- 3.1. Global Energy & Power Industry Overview, 2025
- 4. Market Overview
- 4.1. Market Dynamics
- 4.1.1. Drivers
- 4.1.1.1. Smart grid expansion and energy infrastructure digitalization
- 4.1.1.2. Demand for predictive maintenance and asset performance optimization
- 4.1.1.3. Renewable energy integration requiring advanced grid simulation capabilities
- 4.1.2. Restraints
- 4.1.2.1. High implementation costs and legacy system integration complexities
- 4.1.2.2. Cybersecurity, data privacy, and interoperability concerns
- 4.1.1. Drivers
- 4.2. Key Trend Analysis
- 4.3. Regulatory Framework
- 4.3.1. Key Regulations, Norms, and Subsidies, by Key Countries
- 4.3.2. Tariffs and Standards
- 4.3.3. Impact Analysis of Regulations on the Market
- 4.4. Ecosystem Analysis
- 4.5. Porter’s Five Forces Analysis
- 4.6. PESTEL Analysis
- 4.7. Global Energy Digital Twins Market Demand
- 4.7.1. Historical Market Size – in Value (US$ Bn), 2020-2024
- 4.7.2. Current and Future Market Size – in Value (US$ Bn), 2026–2035
- 4.7.2.1. Y-o-Y Growth Trends
- 4.7.2.2. Absolute $ Opportunity Assessment
- 4.1. Market Dynamics
- 5. Competition Landscape
- 5.1. Competition structure
- 5.1.1. Fragmented v/s consolidated
- 5.2. Company Share Analysis, 2025
- 5.2.1. Global Company Market Share
- 5.2.2. By Region
- 5.2.2.1. North America
- 5.2.2.2. Europe
- 5.2.2.3. Asia Pacific
- 5.2.2.4. Middle East
- 5.2.2.5. Africa
- 5.2.2.6. South America
- 5.3. Product Comparison Matrix
- 5.3.1. Specifications
- 5.3.2. Market Positioning
- 5.3.3. Pricing
- 5.1. Competition structure
- 6. Global Energy Digital Twins Market Analysis, by Twin Type
- 6.1. Key Segment Analysis
- 6.2. Energy Digital Twins Market Size (Value - US$ Bn), Analysis, and Forecasts, by Twin Type, 2021-2035
- 6.2.1. Asset Twin
- 6.2.2. System Twin
- 6.2.3. Process Twin
- 6.2.4. Network/Grid Twin
- 6.2.5. Enterprise Twin
- 7. Global Energy Digital Twins Market Analysis, by Technology Enabler
- 7.1. Key Segment Analysis
- 7.2. Energy Digital Twins Market Size (Value - US$ Bn), Analysis, and Forecasts, by Technology Enabler, 2021-2035
- 7.2.1. AI / ML Integration
- 7.2.2. Industrial IoT (IIoT)
- 7.2.3. Big Data & Advanced Analytics
- 7.2.4. Cloud Computing
- 7.2.5. AR / VR Integration
- 7.2.6. Blockchain
- 7.2.7. 5G & Edge Computing
- 7.2.8. Others
- 8. Global Energy Digital Twins Market Analysis, by Functionality
- 8.1. Key Segment Analysis
- 8.2. Energy Digital Twins Market Size (Value - US$ Bn), Analysis, and Forecasts, by Functionality, 2021-2035
- 8.2.1. Predictive Maintenance
- 8.2.2. Asset Health Monitoring
- 8.2.3. Energy Performance Optimization
- 8.2.4. Grid Load Forecasting & Demand Response
- 8.2.5. Fault Detection & Diagnostics (FDD)
- 8.2.6. Lifecycle Management
- 8.2.7. Regulatory Compliance & Reporting
- 8.2.8. Carbon Footprint Monitoring
- 8.2.9. Scenario Simulation & Planning
- 8.2.10. Others
- 9. Global Energy Digital Twins Market Analysis, by Asset Type
- 9.1. Key Segment Analysis
- 9.2. Energy Digital Twins Market Size (Value - US$ Bn), Analysis, and Forecasts, by Asset Type, 2021-2035
- 9.2.1. Renewable Energy
- 9.2.1.1. Solar PV Farms
- 9.2.1.2. Wind Farms
- 9.2.1.3. Hydropower Plants
- 9.2.1.4. Geothermal Systems
- 9.2.1.5. Green Hydrogen Facilities
- 9.2.1.6. Others
- 9.2.2. Conventional/Thermal Energy
- 9.2.2.1. Coal-Fired Power Plants
- 9.2.2.2. Gas Turbine & Combined Cycle Plants
- 9.2.2.3. Nuclear Power Plants
- 9.2.2.4. Others
- 9.2.3. Energy Storage Systems
- 9.2.4. Transmission & Distribution Infrastructure
- 9.2.5. Microgrids & Distributed Energy Resources
- 9.2.1. Renewable Energy
- 10. Global Energy Digital Twins Market Analysis, by Connectivity Architecture
- 10.1. Key Segment Analysis
- 10.2. Energy Digital Twins Market Size (Value - US$ Bn), Analysis, and Forecasts, by Connectivity Architecture, 2021-2035
- 10.2.1. Standalone Digital Twin
- 10.2.2. Integrated Ecosystem
- 10.2.3. Batch-Synchronized Twin
- 11. Global Energy Digital Twins Market Analysis, by End-users
- 11.1. Key Segment Analysis
- 11.2. Energy Digital Twins Market Size (Value - US$ Bn), Analysis, and Forecasts, by End-users, 2021-2035
- 11.2.1. Power Generation & Utilities
- 11.2.2. Oil & Gas
- 11.2.3. Renewable Energy
- 11.2.4. Industrial Manufacturing
- 11.2.5. Commercial Buildings & Smart Real Estate
- 11.2.6. Mining & Metals
- 11.2.7. Transportation & Mobility
- 11.2.8. Water & Wastewater
- 11.2.9. Data Centers & IT Infrastructure
- 11.2.10. Government, Defence & Critical Infrastructure
- 11.2.11. Other End-users
- 12. Global Energy Digital Twins Market Analysis, by Region
- 12.1. Key Findings
- 12.2. Energy Digital Twins Market Size (Value - US$ Bn), Analysis, and Forecasts, by Region, 2021-2035
- 12.2.1. North America
- 12.2.2. Europe
- 12.2.3. Asia Pacific
- 12.2.4. Middle East
- 12.2.5. Africa
- 12.2.6. South America
- 13. North America Energy Digital Twins Market Analysis
- 13.1. Key Segment Analysis
- 13.2. Regional Snapshot
- 13.3. North America Energy Digital Twins Market Size (Value - US$ Bn), Analysis, and Forecasts, 2021-2035
- 13.3.1. Twin Type
- 13.3.2. Technology Enabler
- 13.3.3. Functionality
- 13.3.4. Asset Type
- 13.3.5. Connectivity Architecture
- 13.3.6. End-users
- 13.3.7. Country
- 13.3.7.1. USA
- 13.3.7.2. Canada
- 13.3.7.3. Mexico
- 13.4. USA Energy Digital Twins Market
- 13.4.1. Country Segmental Analysis
- 13.4.2. Twin Type
- 13.4.3. Technology Enabler
- 13.4.4. Functionality
- 13.4.5. Asset Type
- 13.4.6. Connectivity Architecture
- 13.4.7. End-users
- 13.5. Canada Energy Digital Twins Market
- 13.5.1. Country Segmental Analysis
- 13.5.2. Twin Type
- 13.5.3. Technology Enabler
- 13.5.4. Functionality
- 13.5.5. Asset Type
- 13.5.6. Connectivity Architecture
- 13.5.7. End-users
- 13.6. Mexico Energy Digital Twins Market
- 13.6.1. Country Segmental Analysis
- 13.6.2. Twin Type
- 13.6.3. Technology Enabler
- 13.6.4. Functionality
- 13.6.5. Asset Type
- 13.6.6. Connectivity Architecture
- 13.6.7. End-users
- 14. Europe Energy Digital Twins Market Analysis
- 14.1. Key Segment Analysis
- 14.2. Regional Snapshot
- 14.3. Europe Energy Digital Twins Market Size (Value - US$ Bn), Analysis, and Forecasts, 2021-2035
- 14.3.1. Twin Type
- 14.3.2. Technology Enabler
- 14.3.3. Functionality
- 14.3.4. Asset Type
- 14.3.5. Connectivity Architecture
- 14.3.6. End-users
- 14.3.7. Country
- 14.3.7.1. Germany
- 14.3.7.2. United Kingdom
- 14.3.7.3. France
- 14.3.7.4. Italy
- 14.3.7.5. Spain
- 14.3.7.6. Netherlands
- 14.3.7.7. Nordic Countries
- 14.3.7.8. Poland
- 14.3.7.9. Russia & CIS
- 14.3.7.10. Rest of Europe
- 14.4. Germany Energy Digital Twins Market
- 14.4.1. Country Segmental Analysis
- 14.4.2. Twin Type
- 14.4.3. Technology Enabler
- 14.4.4. Functionality
- 14.4.5. Asset Type
- 14.4.6. Connectivity Architecture
- 14.4.7. End-users
- 14.5. United Kingdom Energy Digital Twins Market
- 14.5.1. Country Segmental Analysis
- 14.5.2. Twin Type
- 14.5.3. Technology Enabler
- 14.5.4. Functionality
- 14.5.5. Asset Type
- 14.5.6. Connectivity Architecture
- 14.5.7. End-users
- 14.6. France Energy Digital Twins Market
- 14.6.1. Country Segmental Analysis
- 14.6.2. Twin Type
- 14.6.3. Technology Enabler
- 14.6.4. Functionality
- 14.6.5. Asset Type
- 14.6.6. Connectivity Architecture
- 14.6.7. End-users
- 14.7. Italy Energy Digital Twins Market
- 14.7.1. Country Segmental Analysis
- 14.7.2. Twin Type
- 14.7.3. Technology Enabler
- 14.7.4. Functionality
- 14.7.5. Asset Type
- 14.7.6. Connectivity Architecture
- 14.7.7. End-users
- 14.8. Spain Energy Digital Twins Market
- 14.8.1. Country Segmental Analysis
- 14.8.2. Twin Type
- 14.8.3. Technology Enabler
- 14.8.4. Functionality
- 14.8.5. Asset Type
- 14.8.6. Connectivity Architecture
- 14.8.7. End-users
- 14.9. Netherlands Energy Digital Twins Market
- 14.9.1. Country Segmental Analysis
- 14.9.2. Twin Type
- 14.9.3. Technology Enabler
- 14.9.4. Functionality
- 14.9.5. Asset Type
- 14.9.6. Connectivity Architecture
- 14.9.7. End-users
- 14.10. Nordic Countries Energy Digital Twins Market
- 14.10.1. Country Segmental Analysis
- 14.10.2. Twin Type
- 14.10.3. Technology Enabler
- 14.10.4. Functionality
- 14.10.5. Asset Type
- 14.10.6. Connectivity Architecture
- 14.10.7. End-users
- 14.11. Poland Energy Digital Twins Market
- 14.11.1. Country Segmental Analysis
- 14.11.2. Twin Type
- 14.11.3. Technology Enabler
- 14.11.4. Functionality
- 14.11.5. Asset Type
- 14.11.6. Connectivity Architecture
- 14.11.7. End-users
- 14.12. Russia & CIS Energy Digital Twins Market
- 14.12.1. Country Segmental Analysis
- 14.12.2. Twin Type
- 14.12.3. Technology Enabler
- 14.12.4. Functionality
- 14.12.5. Asset Type
- 14.12.6. Connectivity Architecture
- 14.12.7. End-users
- 14.13. Rest of Europe Energy Digital Twins Market
- 14.13.1. Country Segmental Analysis
- 14.13.2. Twin Type
- 14.13.3. Technology Enabler
- 14.13.4. Functionality
- 14.13.5. Asset Type
- 14.13.6. Connectivity Architecture
- 14.13.7. End-users
- 15. Asia Pacific Energy Digital Twins Market Analysis
- 15.1. Key Segment Analysis
- 15.2. Regional Snapshot
- 15.3. Asia Pacific Energy Digital Twins Market Size (Value - US$ Bn), Analysis, and Forecasts, 2021-2035
- 15.3.1. Twin Type
- 15.3.2. Technology Enabler
- 15.3.3. Functionality
- 15.3.4. Asset Type
- 15.3.5. Connectivity Architecture
- 15.3.6. End-users
- 15.3.7. Country
- 15.3.7.1. China
- 15.3.7.2. India
- 15.3.7.3. Japan
- 15.3.7.4. South Korea
- 15.3.7.5. Australia and New Zealand
- 15.3.7.6. Indonesia
- 15.3.7.7. Malaysia
- 15.3.7.8. Thailand
- 15.3.7.9. Vietnam
- 15.3.7.10. Rest of Asia Pacific
- 15.4. China Energy Digital Twins Market
- 15.4.1. Country Segmental Analysis
- 15.4.2. Twin Type
- 15.4.3. Technology Enabler
- 15.4.4. Functionality
- 15.4.5. Asset Type
- 15.4.6. Connectivity Architecture
- 15.4.7. End-users
- 15.5. India Energy Digital Twins Market
- 15.5.1. Country Segmental Analysis
- 15.5.2. Twin Type
- 15.5.3. Technology Enabler
- 15.5.4. Functionality
- 15.5.5. Asset Type
- 15.5.6. Connectivity Architecture
- 15.5.7. End-users
- 15.6. Japan Energy Digital Twins Market
- 15.6.1. Country Segmental Analysis
- 15.6.2. Twin Type
- 15.6.3. Technology Enabler
- 15.6.4. Functionality
- 15.6.5. Asset Type
- 15.6.6. Connectivity Architecture
- 15.6.7. End-users
- 15.7. South Korea Energy Digital Twins Market
- 15.7.1. Country Segmental Analysis
- 15.7.2. Twin Type
- 15.7.3. Technology Enabler
- 15.7.4. Functionality
- 15.7.5. Asset Type
- 15.7.6. Connectivity Architecture
- 15.7.7. End-users
- 15.8. Australia and New Zealand Energy Digital Twins Market
- 15.8.1. Country Segmental Analysis
- 15.8.2. Twin Type
- 15.8.3. Technology Enabler
- 15.8.4. Functionality
- 15.8.5. Asset Type
- 15.8.6. Connectivity Architecture
- 15.8.7. End-users
- 15.9. Indonesia Energy Digital Twins Market
- 15.9.1. Country Segmental Analysis
- 15.9.2. Twin Type
- 15.9.3. Technology Enabler
- 15.9.4. Functionality
- 15.9.5. Asset Type
- 15.9.6. Connectivity Architecture
- 15.9.7. End-users
- 15.10. Malaysia Energy Digital Twins Market
- 15.10.1. Country Segmental Analysis
- 15.10.2. Twin Type
- 15.10.3. Technology Enabler
- 15.10.4. Functionality
- 15.10.5. Asset Type
- 15.10.6. Connectivity Architecture
- 15.10.7. End-users
- 15.11. Thailand Energy Digital Twins Market
- 15.11.1. Country Segmental Analysis
- 15.11.2. Twin Type
- 15.11.3. Technology Enabler
- 15.11.4. Functionality
- 15.11.5. Asset Type
- 15.11.6. Connectivity Architecture
- 15.11.7. End-users
- 15.12. Vietnam Energy Digital Twins Market
- 15.12.1. Country Segmental Analysis
- 15.12.2. Twin Type
- 15.12.3. Technology Enabler
- 15.12.4. Functionality
- 15.12.5. Asset Type
- 15.12.6. Connectivity Architecture
- 15.12.7. End-users
- 15.13. Rest of Asia Pacific Energy Digital Twins Market
- 15.13.1. Country Segmental Analysis
- 15.13.2. Twin Type
- 15.13.3. Technology Enabler
- 15.13.4. Functionality
- 15.13.5. Asset Type
- 15.13.6. Connectivity Architecture
- 15.13.7. End-users
- 16. Middle East Energy Digital Twins Market Analysis
- 16.1. Key Segment Analysis
- 16.2. Regional Snapshot
- 16.3. Middle East Energy Digital Twins Market Size (Value - US$ Bn), Analysis, and Forecasts, 2021-2035
- 16.3.1. Twin Type
- 16.3.2. Technology Enabler
- 16.3.3. Functionality
- 16.3.4. Asset Type
- 16.3.5. Connectivity Architecture
- 16.3.6. End-users
- 16.3.7. Country
- 16.3.7.1. Turkey
- 16.3.7.2. UAE
- 16.3.7.3. Saudi Arabia
- 16.3.7.4. Israel
- 16.3.7.5. Rest of Middle East
- 16.4. Turkey Energy Digital Twins Market
- 16.4.1. Country Segmental Analysis
- 16.4.2. Twin Type
- 16.4.3. Technology Enabler
- 16.4.4. Functionality
- 16.4.5. Asset Type
- 16.4.6. Connectivity Architecture
- 16.4.7. End-users
- 16.5. UAE Energy Digital Twins Market
- 16.5.1. Country Segmental Analysis
- 16.5.2. Twin Type
- 16.5.3. Technology Enabler
- 16.5.4. Functionality
- 16.5.5. Asset Type
- 16.5.6. Connectivity Architecture
- 16.5.7. End-users
- 16.6. Saudi Arabia Energy Digital Twins Market
- 16.6.1. Country Segmental Analysis
- 16.6.2. Twin Type
- 16.6.3. Technology Enabler
- 16.6.4. Functionality
- 16.6.5. Asset Type
- 16.6.6. Connectivity Architecture
- 16.6.7. End-users
- 16.7. Israel Energy Digital Twins Market
- 16.7.1. Country Segmental Analysis
- 16.7.2. Twin Type
- 16.7.3. Technology Enabler
- 16.7.4. Functionality
- 16.7.5. Asset Type
- 16.7.6. Connectivity Architecture
- 16.7.7. End-users
- 16.8. Rest of Middle East Energy Digital Twins Market
- 16.8.1. Country Segmental Analysis
- 16.8.2. Twin Type
- 16.8.3. Technology Enabler
- 16.8.4. Functionality
- 16.8.5. Asset Type
- 16.8.6. Connectivity Architecture
- 16.8.7. End-users
- 17. Africa Energy Digital Twins Market Analysis
- 17.1. Key Segment Analysis
- 17.2. Regional Snapshot
- 17.3. Africa Energy Digital Twins Market Size (Value - US$ Bn), Analysis, and Forecasts, 2021-2035
- 17.3.1. Twin Type
- 17.3.2. Technology Enabler
- 17.3.3. Functionality
- 17.3.4. Asset Type
- 17.3.5. Connectivity Architecture
- 17.3.6. End-users
- 17.3.7. Country
- 17.3.7.1. South Africa
- 17.3.7.2. Egypt
- 17.3.7.3. Nigeria
- 17.3.7.4. Algeria
- 17.3.7.5. Rest of Africa
- 17.4. South Africa Energy Digital Twins Market
- 17.4.1. Country Segmental Analysis
- 17.4.2. Twin Type
- 17.4.3. Technology Enabler
- 17.4.4. Functionality
- 17.4.5. Asset Type
- 17.4.6. Connectivity Architecture
- 17.4.7. End-users
- 17.5. Egypt Energy Digital Twins Market
- 17.5.1. Country Segmental Analysis
- 17.5.2. Twin Type
- 17.5.3. Technology Enabler
- 17.5.4. Functionality
- 17.5.5. Asset Type
- 17.5.6. Connectivity Architecture
- 17.5.7. End-users
- 17.6. Nigeria Energy Digital Twins Market
- 17.6.1. Country Segmental Analysis
- 17.6.2. Twin Type
- 17.6.3. Technology Enabler
- 17.6.4. Functionality
- 17.6.5. Asset Type
- 17.6.6. Connectivity Architecture
- 17.6.7. End-users
- 17.7. Algeria Energy Digital Twins Market
- 17.7.1. Country Segmental Analysis
- 17.7.2. Twin Type
- 17.7.3. Technology Enabler
- 17.7.4. Functionality
- 17.7.5. Asset Type
- 17.7.6. Connectivity Architecture
- 17.7.7. End-users
- 17.8. Rest of Africa Energy Digital Twins Market
- 17.8.1. Country Segmental Analysis
- 17.8.2. Twin Type
- 17.8.3. Technology Enabler
- 17.8.4. Functionality
- 17.8.5. Asset Type
- 17.8.6. Connectivity Architecture
- 17.8.7. End-users
- 18. South America Energy Digital Twins Market Analysis
- 18.1. Key Segment Analysis
- 18.2. Regional Snapshot
- 18.3. South America Energy Digital Twins Market Size (Value - US$ Bn), Analysis, and Forecasts, 2021-2035
- 18.3.1. Twin Type
- 18.3.2. Technology Enabler
- 18.3.3. Functionality
- 18.3.4. Asset Type
- 18.3.5. Connectivity Architecture
- 18.3.6. End-users
- 18.3.7. Country
- 18.3.7.1. Brazil
- 18.3.7.2. Argentina
- 18.3.7.3. Rest of South America
- 18.4. Brazil Energy Digital Twins Market
- 18.4.1. Country Segmental Analysis
- 18.4.2. Twin Type
- 18.4.3. Technology Enabler
- 18.4.4. Functionality
- 18.4.5. Asset Type
- 18.4.6. Connectivity Architecture
- 18.4.7. End-users
- 18.5. Argentina Energy Digital Twins Market
- 18.5.1. Country Segmental Analysis
- 18.5.2. Twin Type
- 18.5.3. Technology Enabler
- 18.5.4. Functionality
- 18.5.5. Asset Type
- 18.5.6. Connectivity Architecture
- 18.5.7. End-users
- 18.6. Rest of South America Energy Digital Twins Market
- 18.6.1. Country Segmental Analysis
- 18.6.2. Twin Type
- 18.6.3. Technology Enabler
- 18.6.4. Functionality
- 18.6.5. Asset Type
- 18.6.6. Connectivity Architecture
- 18.6.7. End-users
- 19. Key Players/ Company Profile
- 19.1. Ariadna Grid
- 19.1.1. Company Details/ Overview
- 19.1.2. Company Financials
- 19.1.3. Key Customers and Competitors
- 19.1.4. Business/ Industry Portfolio
- 19.1.5. Product Portfolio/ Specification Details
- 19.1.6. Pricing Data
- 19.1.7. Strategic Overview
- 19.1.8. Recent Developments
- 19.2. GE Vernova
- 19.3. HexaCoder Technologies
- 19.4. IBM Corporation
- 19.5. Schneider Electric SE
- 19.6. ABB Ltd.
- 19.7. Honeywell International Inc.
- 19.8. Bentley Systems Inc.
- 19.9. Altair (Siemens AG)
- 19.10. Wood Group
- 19.11. Cognite AS
- 19.12. Other Key Players
- 19.1. Ariadna Grid
Note* - This is just tentative list of players. While providing the report, we will cover more number of players based on their revenue and share for each geography
Research Design
Our research design integrates both demand-side and supply-side analysis through a balanced combination of primary and secondary research methodologies. By utilizing both bottom-up and top-down approaches alongside rigorous data triangulation methods, we deliver robust market intelligence that supports strategic decision-making.
MarketGenics' comprehensive research design framework ensures the delivery of accurate, reliable, and actionable market intelligence. Through the integration of multiple research approaches, rigorous validation processes, and expert analysis, we provide our clients with the insights needed to make informed strategic decisions and capitalize on market opportunities.
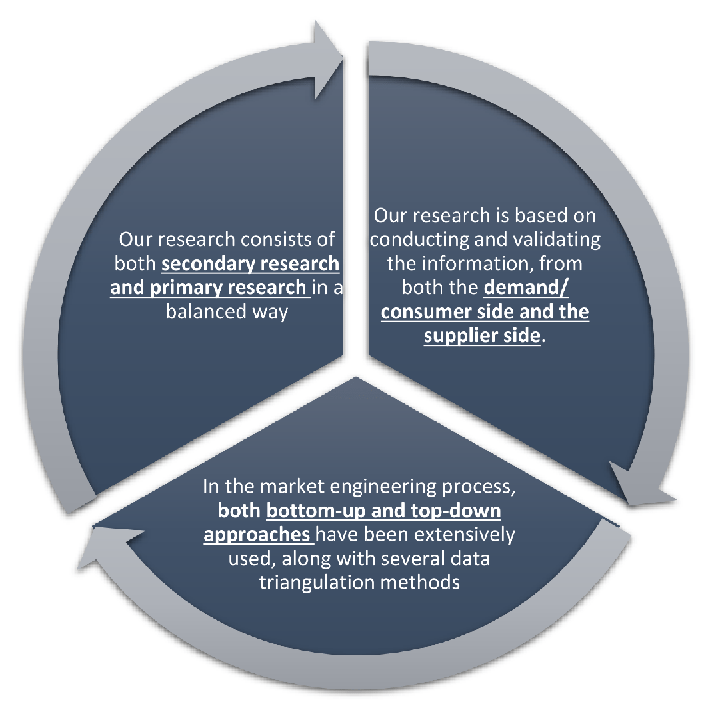
MarketGenics leverages a dedicated industry panel of experts and a comprehensive suite of paid databases to effectively collect, consolidate, and analyze market intelligence.
Our approach has consistently proven to be reliable and effective in generating accurate market insights, identifying key industry trends, and uncovering emerging business opportunities.
Through both primary and secondary research, we capture and analyze critical company-level data such as manufacturing footprints, including technical centers, R&D facilities, sales offices, and headquarters.
Our expert panel further enhances our ability to estimate market size for specific brands based on validated field-level intelligence.
Our data mining techniques incorporate both parametric and non-parametric methods, allowing for structured data collection, sorting, processing, and cleaning.
Demand projections are derived from large-scale data sets analyzed through proprietary algorithms, culminating in robust and reliable market sizing.
Research Approach
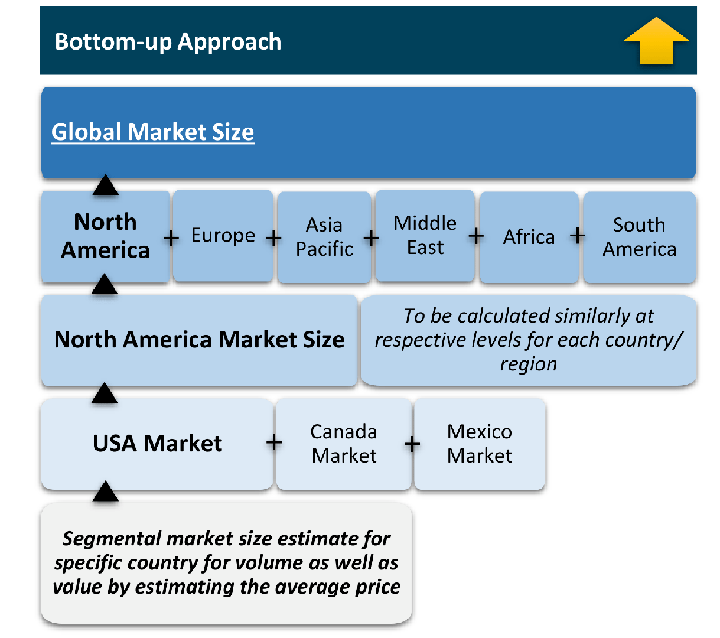
The bottom-up approach builds market estimates by starting with the smallest addressable market units and systematically aggregating them to create comprehensive market size projections.
This method begins with specific, granular data points and builds upward to create the complete market landscape.
Customer Analysis → Segmental Analysis → Geographical Analysis
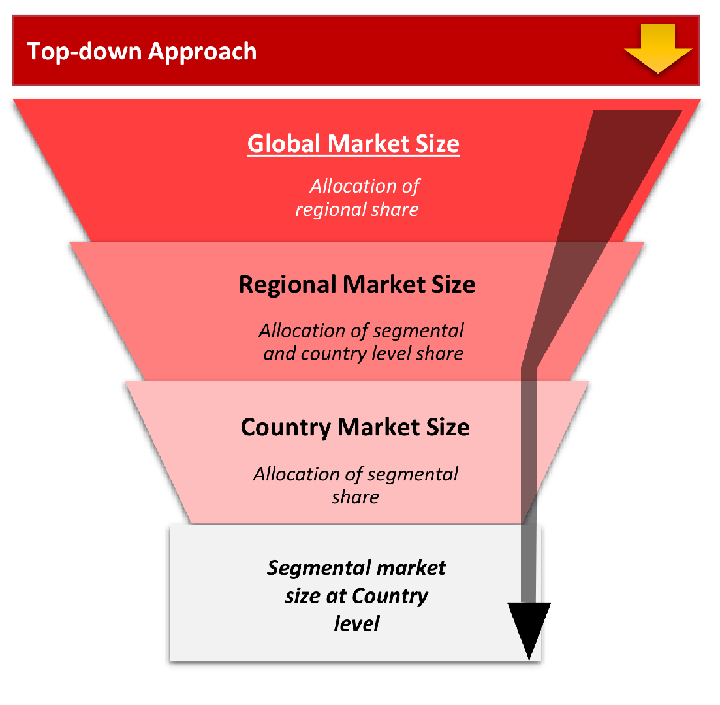
The top-down approach starts with the broadest possible market data and systematically narrows it down through a series of filters and assumptions to arrive at specific market segments or opportunities.
This method begins with the big picture and works downward to increasingly specific market slices.
TAM → SAM → SOM
Research Methods
Desk / Secondary Research
While analysing the market, we extensively study secondary sources, directories, and databases to identify and collect information useful for this technical, market-oriented, and commercial report. Secondary sources that we utilize are not only the public sources, but it is a combination of Open Source, Associations, Paid Databases, MG Repository & Knowledgebase, and others.
- Company websites, annual reports, financial reports, broker reports, and investor presentations
- National government documents, statistical databases and reports
- News articles, press releases and web-casts specific to the companies operating in the market, Magazines, reports, and others
- We gather information from commercial data sources for deriving company specific data such as segmental revenue, share for geography, product revenue, and others
- Internal and external proprietary databases (industry-specific), relevant patent, and regulatory databases
- Governing Bodies, Government Organizations
- Relevant Authorities, Country-specific Associations for Industries
We also employ the model mapping approach to estimate the product level market data through the players' product portfolio
Primary Research
Primary research/ interviews is vital in analyzing the market. Most of the cases involves paid primary interviews. Primary sources include primary interviews through e-mail interactions, telephonic interviews, surveys as well as face-to-face interviews with the different stakeholders across the value chain including several industry experts.
| Type of Respondents | Number of Primaries |
|---|---|
| Tier 2/3 Suppliers | ~20 |
| Tier 1 Suppliers | ~25 |
| End-users | ~25 |
| Industry Expert/ Panel/ Consultant | ~30 |
| Total | ~100 |
MG Knowledgebase
• Repository of industry blog, newsletter and case studies
• Online platform covering detailed market reports, and company profiles
Forecasting Factors and Models
Forecasting Factors
- Historical Trends – Past market patterns, cycles, and major events that shaped how markets behave over time. Understanding past trends helps predict future behavior.
- Industry Factors – Specific characteristics of the industry like structure, regulations, and innovation cycles that affect market dynamics.
- Macroeconomic Factors – Economic conditions like GDP growth, inflation, and employment rates that affect how much money people have to spend.
- Demographic Factors – Population characteristics like age, income, and location that determine who can buy your product.
- Technology Factors – How quickly people adopt new technology and how much technology infrastructure exists.
- Regulatory Factors – Government rules, laws, and policies that can help or restrict market growth.
- Competitive Factors – Analyzing competition structure such as degree of competition and bargaining power of buyers and suppliers.
Forecasting Models / Techniques
Multiple Regression Analysis
- Identify and quantify factors that drive market changes
- Statistical modeling to establish relationships between market drivers and outcomes
Time Series Analysis – Seasonal Patterns
- Understand regular cyclical patterns in market demand
- Advanced statistical techniques to separate trend, seasonal, and irregular components
Time Series Analysis – Trend Analysis
- Identify underlying market growth patterns and momentum
- Statistical analysis of historical data to project future trends
Expert Opinion – Expert Interviews
- Gather deep industry insights and contextual understanding
- In-depth interviews with key industry stakeholders
Multi-Scenario Development
- Prepare for uncertainty by modeling different possible futures
- Creating optimistic, pessimistic, and most likely scenarios
Time Series Analysis – Moving Averages
- Sophisticated forecasting for complex time series data
- Auto-regressive integrated moving average models with seasonal components
Econometric Models
- Apply economic theory to market forecasting
- Sophisticated economic models that account for market interactions
Expert Opinion – Delphi Method
- Harness collective wisdom of industry experts
- Structured, multi-round expert consultation process
Monte Carlo Simulation
- Quantify uncertainty and probability distributions
- Thousands of simulations with varying input parameters
Research Analysis
Our research framework is built upon the fundamental principle of validating market intelligence from both demand and supply perspectives. This dual-sided approach ensures comprehensive market understanding and reduces the risk of single-source bias.
Demand-Side Analysis: We understand end-user/application behavior, preferences, and market needs along with the penetration of the product for specific application.
Supply-Side Analysis: We estimate overall market revenue, analyze the segmental share along with industry capacity, competitive landscape, and market structure.
Validation & Evaluation
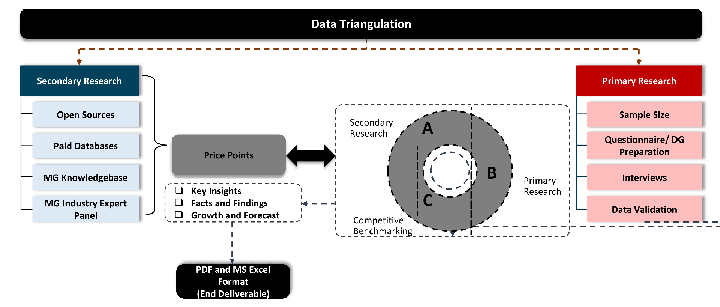
Data triangulation is a validation technique that uses multiple methods, sources, or perspectives to examine the same research question, thereby increasing the credibility and reliability of research findings. In market research, triangulation serves as a quality assurance mechanism that helps identify and minimize bias, validate assumptions, and ensure accuracy in market estimates.
- Data Source Triangulation – Using multiple data sources to examine the same phenomenon
- Methodological Triangulation – Using multiple research methods to study the same research question
- Investigator Triangulation – Using multiple researchers or analysts to examine the same data
- Theoretical Triangulation – Using multiple theoretical perspectives to interpret the same data
Custom Market Research Services
We will customise the research for you, in case the report listed above does not meet your requirements.
Get 10% Free Customisation