Premium Snacking Market Size, Share & Trends Analysis Report by Product Type (Nuts & Seeds, Chips & Crisps, Chocolate & Confectionery, Meat Snacks, Bars & Bites, Crackers & Biscuits, Dried Fruits & Fruit Snacks, Dairy-Based Snacks, Others), Source, Flavor Profile, Packaging Type, Sales Channel, End-users and Geography (North America, Europe, Asia Pacific, Middle East, Africa, and South America) – Global Industry Data, Trends, and Forecasts, 2026–2035
|
|
|
Segmental Data Insights |
|
|
Demand Trends |
|
|
Competitive Landscape |
|
|
Strategic Development |
|
|
Future Outlook & Opportunities |
|
Premium Snacking Market Size, Share, and Growth
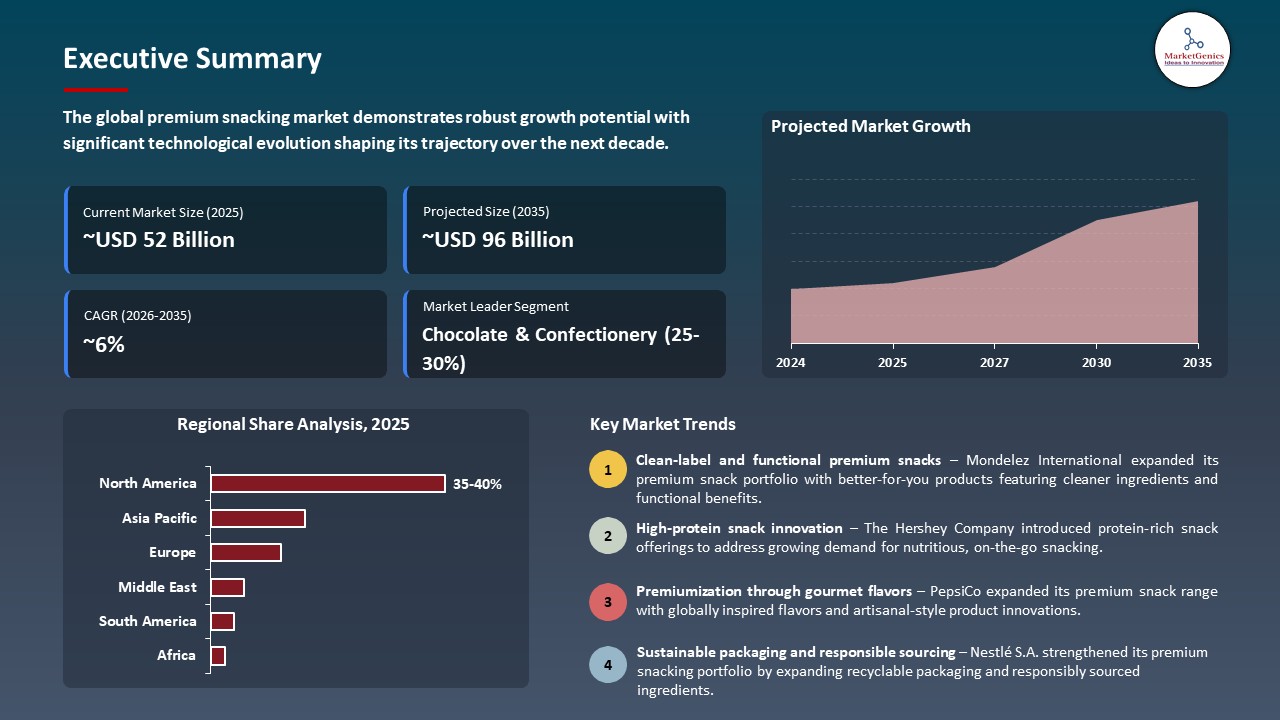
The global premium snacking market is exhibiting strong growth, with an estimated value of USD 51.8 billion in 2025 and USD 96.3 billion by 2035, achieving a CAGR of 6.4%, during the forecast period. The Premium Snacking market is rapidly growing in Asia Pacific due to rising urbanization, increasing disposable incomes, expanding middle-class population, growing exposure to global food trends, and rapid expansion of modern retail and e-commerce snack distribution channels.
Stefano Agostini, Head of Confectionery Nestlé Zone Europe, said, “Consumer insights reveal a significant opportunity to enhance the appeal of filled tablets, The new KitKat tablets are breaking the codes of the more conservative tablet segment and making them more attractive to younger shoppers, which should drive growth.”
The premium snacking market is being propelled by increasing consumer demand to indulge while staying healthy, with clean label ingredients, protein benefits and functional nutrition benefits all contributing to the demand. Around-the-clock, small, tasty and quality snacks, as well as ready-to-eat meal items that are nutritionally balanced, are gaining momentum in the busy urban lifestyle with more and more dual income families.
The increasing penetration of ecommerce grocery delivery services and direct-to-consumer (DTC) channels are enhancing accessibility and product discovery for premium snack products. The brand is continuously innovating its gourmet flavors, positioning and launch of limited editions to increase brand differentiation and repeat purchase behavior. With changing consumer preferences, leading manufacturers are turning their investment focus toward diversifying their portfolios into better-for-you and experiential snacking formats.
Nestlé S.A. added new limited-edition variants to its premium confectionery lineup, which align with the emerging trend of experiential snacking, and The Hershey Company launched protein-enhanced and functional snack bars designed to appeal to health-conscious consumers looking for indulgent snack options in global markets.
Adjacent opportunities for the premium snacking market include functional nutrition and protein supplements, healthy beverage pairings, gourmet foodservice snacking, e-commerce subscription snack boxes, and personalized diet-based snack solutions leveraging AI-driven nutrition platforms. These adjacent markets are expanding revenue streams and accelerating premium snack ecosystem diversification globally.
Premium Snacking Market Dynamics and Trends
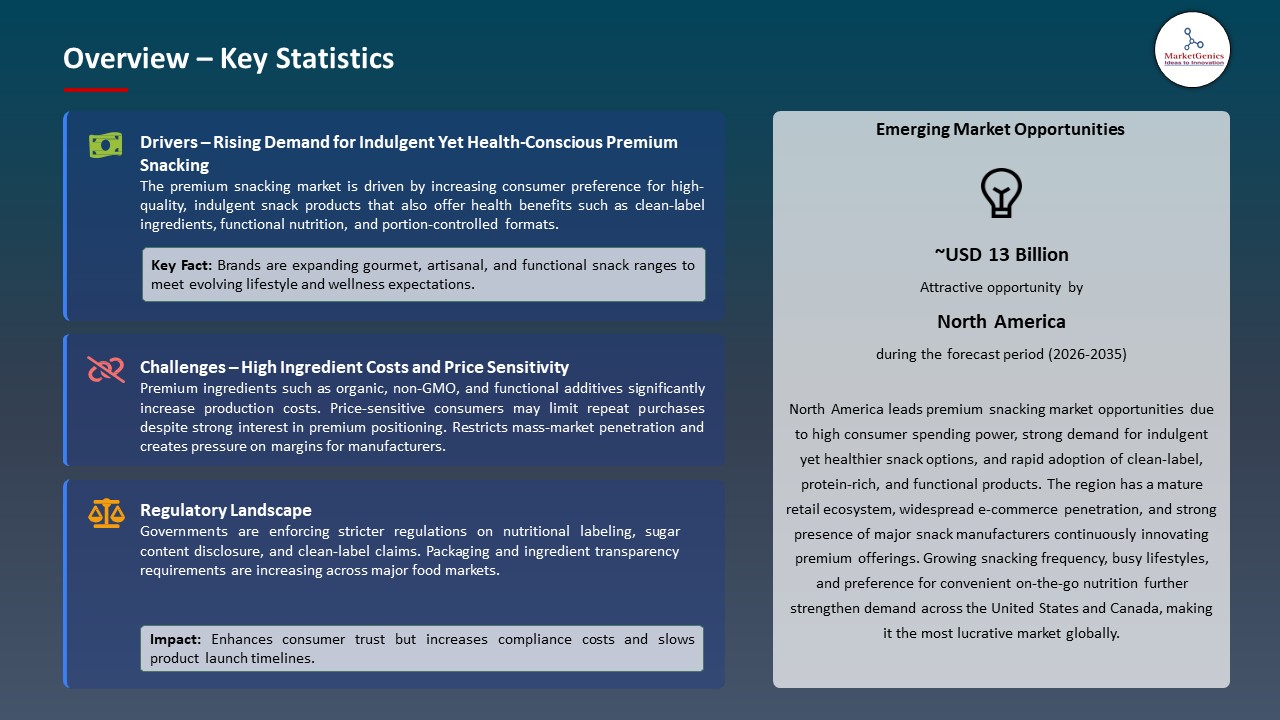
Driver: Increasing Preference for Clean-Label, Natural, and Functional Ingredients
- Consumer demand for premium snacking solutions with “clean label” and natural, functional ingredients is rapidly increasing as consumers are more aware of their health, wellness and ingredient transparency. Artificial additives, preservatives, and high sugar content have been phased out in favour of snack options that provide nutritional value such as protein fortification, fiber and vitamins.
- This change has spurred manufacturers to re-engineer their products and to develop healthier indulgent options without sacrificing flavor or enjoyment. Consumers worldwide are increasingly confident in transparent sourcing and clean ingredient lists, driving brand loyalty and repeat sales even more. Trust in transparent sourcing and simple ingredient lists is further sustaining brand loyalty and repeat purchases globally.
- The transition to clean-label and functional nutrition continues to drive premiumization as well as a shift in the product innovation approach in snacking.
Restraint: Elevated Ingredient Costs and Premium Pricing Accessibility Constraints
- Increased raw material prices for premium ingredients like organic, non-GMO, protein enriched and functional additives are driving up the cost of production in the premium snacking segment. Sustainable sourcing, specialty processing and sophisticated packaging that is intended to preserve product quality and shelf appeal are also driving up manufacturers' costs. This cost squeeze is exacerbated by volatile supply chains and volatile energy costs which directly affect manufacturing economics.
- However, premium price models simultaneously restrict access to those willing to pay more, particularly in developing markets, where high-end snacks are still not a huge priority for consumers. The retailers' problem is also finding the right balance between premium positioning and competitively pricing the product on the shelf, which limits mass market penetration and volume scalability for manufacturers.
- Cost inflation and affordability issues are inhibiting broad acceptance and scaling up of premium snacking foods across the world.
Opportunity: Expansion of Personalized Nutrition Subscription Models Creating New Growth Avenues
- The trend towards personalized nutrition is also offering good prospects in the premium snack market; as people are more interested in snacking items that can support their specific health objectives, including weight management, fitness performance, gut health and immunity support.
- AI-powered dietary analysis, digital health platforms, and subscription-based snack customization are helping these brands to bring more personalized, targeted product offerings to market. This is reinforced by increased consumer demand for nutrition and lifestyle-based preventive care.
- Manufacturers are increasingly using digital ecosystems to combine consumer data with product innovation to enable real-time personalization of snack recommendations and ingredient formulations.
- Hershey added new, zero-sugar, protein-rich, and plant-based snacks such as protein bars, gummies, and puffs to its better-for-you product lineup to meet the demands of consumers seeking personalized nutrition and wellness.
- Personalized nutrition is driving premium snacking to become a high-value, long-term scalable data-driven business.
Key Trend: Digital Premiumization Through Experiential Flavor Innovation Strategies
- Digital premiumization is changing the premium snacking landscape, with brands using online channels, social media interaction and data to innovate with limited edition and experiential products. Unique taste experiences, seasonal products and taste inspired by various parts of the world are actively sought by consumers to enrich the emotional and sensory impact.
- By integrating the latest in consumer analytics and real-time feedback loops, manufacturers are able to quickly experiment with and improve premium snack flavors to meet changing preferences. This is enhancing brand differentiation and boosting engagement on e-commerce and “omnichannel” retail channels.
- In 2025, Nestlé S.A. released KitKat premium chocolate tablets in Europe with high-value indulgent flavours including double chocolate, hazelnut and salty caramel, which are designed to appeal to experiential snackers, to boost the number of occasions on which people eat the snack and to reinforce KitKat's premium positioning with innovative product formats built around texture and flavour.
- Digital innovation is driving experiential innovation and is adding fuel to the premium differentiation fire in global snacking markets.
Premium Snacking Market Analysis and Segmental Data
Chocolate & Confectionery Dominate Global Premium Snacking Market
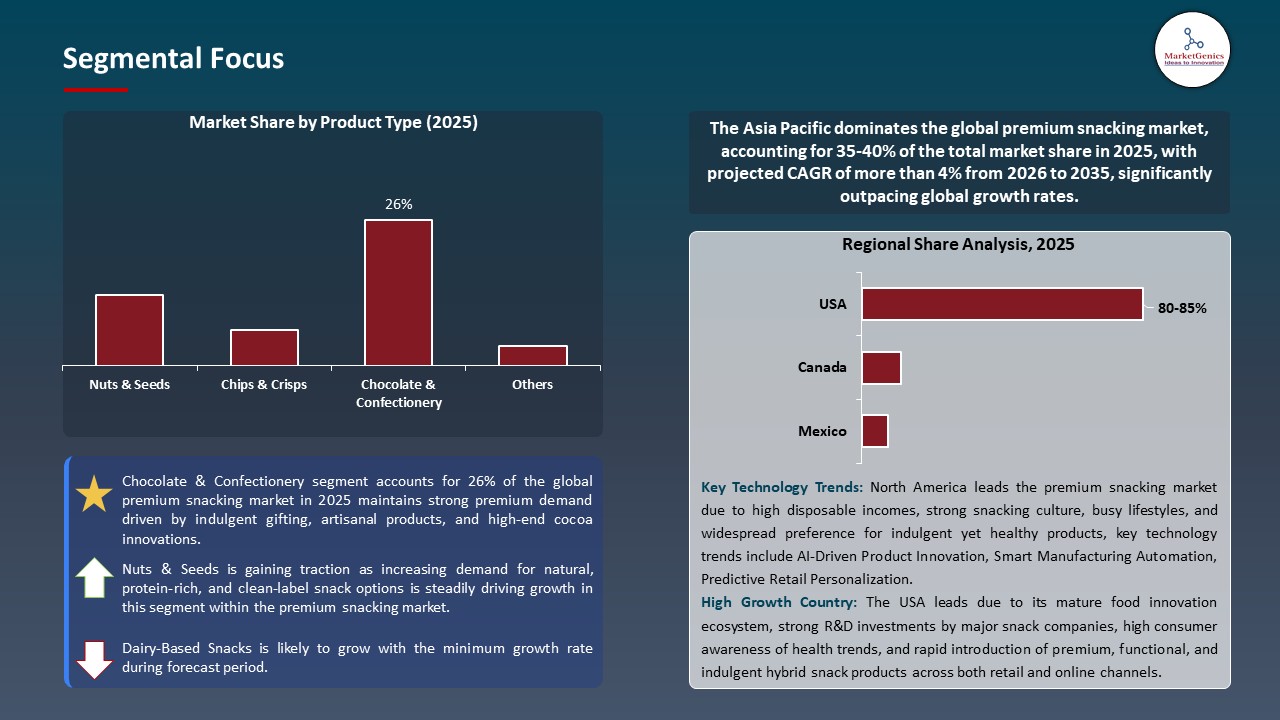
- The chocolate & confectionery segment is the largest and fastest growing premium snacking category, as consumers have a strong appetite for indulgent, sensory and emotionally rewarding snack experiences. The demand for artisanal-style chocolates, seasonal products and high-quality gifting items remains strong, continuing to bring the category to the fore. Ongoing product innovation, with new flavour, texture and superior cocoa sourcing products, further drive consumer engagement on all of the markets.
- Consumers, both old and young, are being drawn by manufacturers to limited edition products, health-inspired varieties, and experiential product formats. It has also helped to boost the brands value and premium positioning by embedding clean label ingredients and sustainable sourcing.
- In 2026, Mondelez International introduced Cadbury Dairy Milk Silk Dubai Chocolate in India with a limited-edition premium confectionery inspired by the hugely popular Kunafa dessert, combining pistachio crème and crunchy kadayif layers to cement experiential indulgence and flavour innovation.
- Chocolate & confectionery is firmly entrenched in premium snacks worldwide thanks to strong indulgence demand and ongoing innovation.
North America Leads Global Premium Snacking Market Demand
- The global premium snacking market is dominated by North America with robust consumer purchasing power, high inclination towards indulgent and functional snacks, and a well-established retail/e-commerce ecosystem. Clean label, protein-rich and low-sugar snack options are in high demand from the region, in line with the rising health awareness and shifting lifestyles.
- Additionally, the region's leading global snack manufacturers, ongoing product innovation, and quick implementation of premiumization strategies further solidify the position of the region. Greater access to digital grocery and personalized nutrition are also improving product access and engagement among various audiences.
- Retail structure and health trends are sustaining North America's premium snacking innovation and growth leadership.
Premium Snacking Market Ecosystem
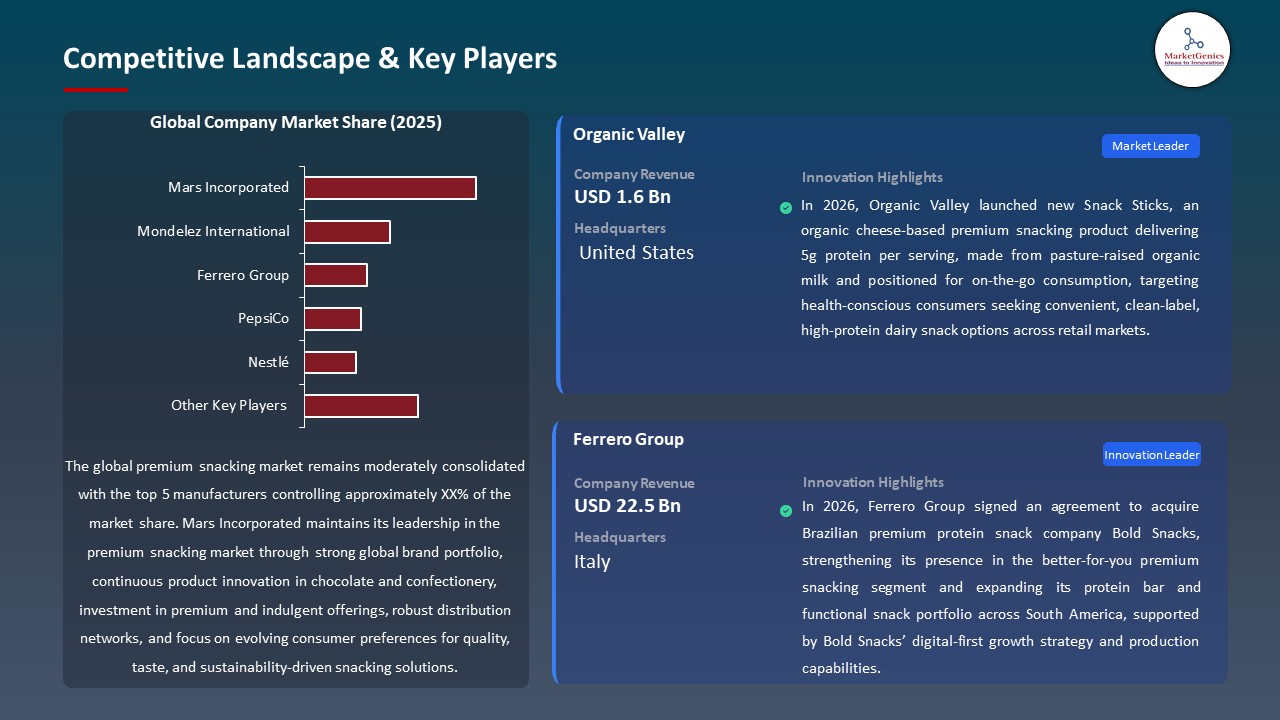
The premium snacking market is fragmented, with leading players such as Mars, Incorporated, Mondelez International, Ferrero Group, PepsiCo, and Nestlé driving innovation through premium chocolate, functional snacks, clean-label confectionery, and better-for-you indulgent product portfolios. These companies are strengthening their competitive positioning through continuous product premiumization, flavor innovation, and expansion into health-oriented snacking categories.
Data-driven consumer insights, AI-powered demand forecasting, and digital retail analytics are becoming integral to advanced product development, helping to fine-tune product launches and improve customer engagement. The manufacturers are also prioritizing sustainable packaging, controlled snack sizes and experiential snacking ideas, which are aligned with the changing lifestyle and wellness trends.
For instance, Mars Incorporated continues to expand its global chocolate and confectionery innovation pipeline. PepsiCo is moving towards protein based and baked higher value snacks, Nestlé is expanding functional and indulgent hybrid snacking formats in the world market. The market is evolving steadily, with competition centered on innovation-led premiumization, health-oriented reformulation, and omnichannel consumer engagement strategies.
Recent Development and Strategic Overview:
- In November 2025, The Hershey Company acquired LesserEvil, an organic better-for-you snack brand, to expand its premium salty snacking portfolio with clean-label, bold-flavor products, strengthening its position in the growing premium snacking and health-focused indulgence segment.
- In December 2025, Jack Link’s partnered with MrBeast to launch a co-branded meat snack line featuring protein-rich beef jerky and meat sticks in multipack formats, targeting Gen Z and Gen Alpha consumers through digitally influenced branding and convenience-focused premium snacking experiences.
Report Scope
|
Detail |
|
|
Market Size in 2025 |
USD 51.8 Bn |
|
Market Forecast Value in 2035 |
USD 96.3 Bn |
|
Growth Rate (CAGR) |
6.4% |
|
Forecast Period |
2026 – 2035 |
|
Historical Data Available for |
2021 – 2024 |
|
Market Size Units |
US$ Billion for Value |
|
Report Format |
Electronic (PDF) + Excel |
|
North America |
Europe |
Asia Pacific |
Middle East |
Africa |
South America |
|
|
|
|
|
|
|
Companies Covered |
|||||
|
|||||
Premium Snacking Market Segmentation and Highlights
|
Segment |
Sub-segment |
|
Premium Snacking Market, By Product Type |
|
|
Premium Snacking Market, By Source |
|
|
Premium Snacking Market, By Flavor Profile |
|
|
Premium Snacking Market, By Packaging Type |
|
|
Premium Snacking Market, By Sales Channel |
|
|
Premium Snacking Market, By End-users |
|
Frequently Asked Questions
Table of Contents
- 1. Research Methodology and Assumptions
- 1.1. Definitions
- 1.2. Research Design and Approach
- 1.3. Data Collection Methods
- 1.4. Base Estimates and Calculations
- 1.5. Forecasting Models
- 1.5.1. Key Forecast Factors & Impact Analysis
- 1.6. Secondary Research
- 1.6.1. Open Sources
- 1.6.2. Paid Databases
- 1.6.3. Associations
- 1.7. Primary Research
- 1.7.1. Primary Sources
- 1.7.2. Primary Interviews with Stakeholders across Ecosystem
- 2. Executive Summary
- 2.1. Global Premium Snacking Market Outlook
- 2.1.1. Premium Snacking Market Size Value (US$ Bn), and Forecasts, 2021-2035
- 2.1.2. Compounded Annual Growth Rate Analysis
- 2.1.3. Growth Opportunity Analysis
- 2.1.4. Segmental Share Analysis
- 2.1.5. Geographical Share Analysis
- 2.2. Market Analysis and Facts
- 2.3. Supply-Demand Analysis
- 2.4. Competitive Benchmarking
- 2.5. Go-to- Market Strategy
- 2.5.1. Customer/ End-use Industry Assessment
- 2.5.2. Growth Opportunity Data, 2026-2035
- 2.5.2.1. Regional Data
- 2.5.2.2. Country Data
- 2.5.2.3. Segmental Data
- 2.5.3. Identification of Potential Market Spaces
- 2.5.4. GAP Analysis
- 2.5.5. Potential Attractive Price Points
- 2.5.6. Prevailing Market Risks & Challenges
- 2.5.7. Preferred Sales & Marketing Strategies
- 2.5.8. Key Recommendations and Analysis
- 2.5.9. A Way Forward
- 2.1. Global Premium Snacking Market Outlook
- 3. Industry Data and Premium Insights
- 3.1. Global Food & Beverages Industry Overview, 2025
- 3.1.1. Food & Beverages Ecosystem Analysis
- 3.1.2. Key Trends for Food & Beverages Industry
- 3.1.3. Regional Distribution for Food & Beverages Industry
- 3.2. Supplier Customer Data
- 3.3. Technology Roadmap and Developments
- 3.4. Trade Analysis
- 3.4.1. Import & Export Analysis, 2025
- 3.4.2. Top Importing Countries
- 3.4.3. Top Exporting Countries
- 3.5. Trump Tariff Impact Analysis
- 3.5.1. Manufacturer
- 3.5.1.1. Based on the component & Raw material
- 3.5.2. Supply Chain
- 3.5.3. End Consumer
- 3.5.1. Manufacturer
- 3.6. Raw Material Analysis
- 3.1. Global Food & Beverages Industry Overview, 2025
- 4. Market Overview
- 4.1. Market Dynamics
- 4.1.1. Drivers
- 4.1.1.1. Rising consumer preference for healthier and premium-quality snacking options
- 4.1.1.2. Growing demand for convenient on-the-go snack products
- 4.1.1.3. Increasing innovation in clean-label, functional, and gourmet snack offerings
- 4.1.2. Restraints
- 4.1.2.1. Premium pricing limiting adoption among price-sensitive consumers
- 4.1.2.2. Volatility in raw material costs and premium ingredient sourcing
- 4.1.1. Drivers
- 4.2. Key Trend Analysis
- 4.3. Regulatory Framework
- 4.3.1. Key Regulations, Norms, and Subsidies, by Key Countries
- 4.3.2. Tariffs and Standards
- 4.3.3. Impact Analysis of Regulations on the Market
- 4.4. Ecosystem Analysis
- 4.5. Porter’s Five Forces Analysis
- 4.6. PESTEL Analysis
- 4.7. Global Premium Snacking Market Demand
- 4.7.1. Historical Market Size – Value (US$ Bn), 2020-2024
- 4.7.2. Current and Future Market Size – Value (US$ Bn), 2026–2035
- 4.7.2.1. Y-o-Y Growth Trends
- 4.7.2.2. Absolute $ Opportunity Assessment
- 4.1. Market Dynamics
- 5. Competition Landscape
- 5.1. Competition structure
- 5.1.1. Fragmented v/s consolidated
- 5.2. Company Share Analysis, 2025
- 5.2.1. Global Company Market Share
- 5.2.2. By Region
- 5.2.2.1. North America
- 5.2.2.2. Europe
- 5.2.2.3. Asia Pacific
- 5.2.2.4. Middle East
- 5.2.2.5. Africa
- 5.2.2.6. South America
- 5.3. Product Comparison Matrix
- 5.3.1. Specifications
- 5.3.2. Market Positioning
- 5.3.3. Pricing
- 5.1. Competition structure
- 6. Global Premium Snacking Market Analysis, by Product Type
- 6.1. Key Segment Analysis
- 6.2. Premium Snacking Market Size Value (US$ Bn), Analysis, and Forecasts, by Product Type, 2021-2035
- 6.2.1. Nuts & Seeds
- 6.2.2. Chips & Crisps
- 6.2.3. Chocolate & Confectionery
- 6.2.4. Meat Snacks
- 6.2.5. Bars & Bites
- 6.2.6. Crackers & Biscuits
- 6.2.7. Dried Fruits & Fruit Snacks
- 6.2.8. Dairy-Based Snacks
- 6.2.9. Others
- 7. Global Premium Snacking Market Analysis, by Source
- 7.1. Key Segment Analysis
- 7.2. Premium Snacking Market Size Value (US$ Bn), Analysis, and Forecasts, by Source, 2021-2035
- 7.2.1. Animal-Based
- 7.2.2. Plant-Based
- 7.2.3. Seafood-Based
- 7.2.4. Insect-Based
- 8. Global Premium Snacking Market Analysis, by Flavor Profile
- 8.1. Key Segment Analysis
- 8.2. Premium Snacking Market Size Value (US$ Bn), Analysis, and Forecasts, by Flavor Profile, 2021-2035
- 8.2.1. Classic/Original
- 8.2.2. Bold & Spicy
- 8.2.3. Sweet & Savory
- 8.2.4. Umami & Savory
- 8.2.5. Herb & Botanical
- 8.2.6. Sweet
- 8.2.7. Others
- 9. Global Premium Snacking Market Analysis, by Packaging Type
- 9.1. Key Segment Analysis
- 9.2. Premium Snacking Market Size Value (US$ Bn), Analysis, and Forecasts, by Packaging Type, 2021-2035
- 9.2.1. On-the-Go Packs
- 9.2.2. Party Packs
- 9.2.3. Resealable Pouches
- 9.2.4. Gift & Specialty Tins
- 9.2.5. Subscription Box Format
- 9.2.6. Multi-Pack Variety Sets
- 10. Global Premium Snacking Market Analysis, by Sales Channel
- 10.1. Key Segment Analysis
- 10.2. Premium Snacking Market Size Value (US$ Bn), Analysis, and Forecasts, by Sales Channel, 2021-2035
- 10.2.1. Offline
- 10.2.2. Online
- 11. Global Premium Snacking Market Analysis, by End-users
- 11.1. Key Segment Analysis
- 11.2. Premium Snacking Market Size Value (US$ Bn), Analysis, and Forecasts, by End-users, 2021-2035
- 11.2.1. Retail & E-Commerce
- 11.2.2. Foodservice & HoReCa
- 11.2.3. Travel & Aviation
- 11.2.4. Corporate & Office Sector
- 11.2.5. Fitness & Recreation Centers
- 11.2.6. Entertainment & Media Venues
- 11.2.7. Luxury & Specialty Retail
- 11.2.8. Other End-users
- 12. Global Premium Snacking Market Analysis and Forecasts, by Region
- 12.1. Key Findings
- 12.2. Premium Snacking Market Size Value (US$ Bn), Analysis, and Forecasts, by Region, 2021-2035
- 12.2.1. North America
- 12.2.2. Europe
- 12.2.3. Asia Pacific
- 12.2.4. Middle East
- 12.2.5. Africa
- 12.2.6. South America
- 13. North America Premium Snacking Market Analysis
- 13.1. Key Segment Analysis
- 13.2. Regional Snapshot
- 13.3. North America Premium Snacking Market Size- Value (US$ Bn), Analysis, and Forecasts, 2021-2035
- 13.3.1. Product Type
- 13.3.2. Source
- 13.3.3. Flavor Profile
- 13.3.4. Packaging Type
- 13.3.5. Sales Channel
- 13.3.6. End-users
- 13.3.7. Country
- 13.3.7.1. USA
- 13.3.7.2. Canada
- 13.3.7.3. Mexico
- 13.4. USA Premium Snacking Market
- 13.4.1. Country Segmental Analysis
- 13.4.2. Product Type
- 13.4.3. Source
- 13.4.4. Flavor Profile
- 13.4.5. Packaging Type
- 13.4.6. Sales Channel
- 13.4.7. End-users
- 13.5. Canada Premium Snacking Market
- 13.5.1. Country Segmental Analysis
- 13.5.2. Product Type
- 13.5.3. Source
- 13.5.4. Flavor Profile
- 13.5.5. Packaging Type
- 13.5.6. Sales Channel
- 13.5.7. End-users
- 13.6. Mexico Premium Snacking Market
- 13.6.1. Country Segmental Analysis
- 13.6.2. Product Type
- 13.6.3. Source
- 13.6.4. Flavor Profile
- 13.6.5. Packaging Type
- 13.6.6. Sales Channel
- 13.6.7. End-users
- 14. Europe Premium Snacking Market Analysis
- 14.1. Key Segment Analysis
- 14.2. Regional Snapshot
- 14.3. Europe Premium Snacking Market Size Value (US$ Bn), Analysis, and Forecasts, 2021-2035
- 14.3.1. Product Type
- 14.3.2. Source
- 14.3.3. Flavor Profile
- 14.3.4. Packaging Type
- 14.3.5. Sales Channel
- 14.3.6. End-users
- 14.3.7. Country
- 14.3.7.1. Germany
- 14.3.7.2. United Kingdom
- 14.3.7.3. France
- 14.3.7.4. Italy
- 14.3.7.5. Spain
- 14.3.7.6. Netherlands
- 14.3.7.7. Nordic Countries
- 14.3.7.8. Poland
- 14.3.7.9. Russia & CIS
- 14.3.7.10. Rest of Europe
- 14.4. Germany Premium Snacking Market
- 14.4.1. Country Segmental Analysis
- 14.4.2. Product Type
- 14.4.3. Source
- 14.4.4. Flavor Profile
- 14.4.5. Packaging Type
- 14.4.6. Sales Channel
- 14.4.7. End-users
- 14.5. United Kingdom Premium Snacking Market
- 14.5.1. Country Segmental Analysis
- 14.5.2. Product Type
- 14.5.3. Source
- 14.5.4. Flavor Profile
- 14.5.5. Packaging Type
- 14.5.6. Sales Channel
- 14.5.7. End-users
- 14.6. France Premium Snacking Market
- 14.6.1. Country Segmental Analysis
- 14.6.2. Product Type
- 14.6.3. Source
- 14.6.4. Flavor Profile
- 14.6.5. Packaging Type
- 14.6.6. Sales Channel
- 14.6.7. End-users
- 14.7. Italy Premium Snacking Market
- 14.7.1. Country Segmental Analysis
- 14.7.2. Product Type
- 14.7.3. Source
- 14.7.4. Flavor Profile
- 14.7.5. Packaging Type
- 14.7.6. Sales Channel
- 14.7.7. End-users
- 14.8. Spain Premium Snacking Market
- 14.8.1. Country Segmental Analysis
- 14.8.2. Product Type
- 14.8.3. Source
- 14.8.4. Flavor Profile
- 14.8.5. Packaging Type
- 14.8.6. Sales Channel
- 14.8.7. End-users
- 14.9. Netherlands Premium Snacking Market
- 14.9.1. Country Segmental Analysis
- 14.9.2. Product Type
- 14.9.3. Source
- 14.9.4. Flavor Profile
- 14.9.5. Packaging Type
- 14.9.6. Sales Channel
- 14.9.7. End-users
- 14.10. Nordic Countries Premium Snacking Market
- 14.10.1. Country Segmental Analysis
- 14.10.2. Product Type
- 14.10.3. Source
- 14.10.4. Flavor Profile
- 14.10.5. Packaging Type
- 14.10.6. Sales Channel
- 14.10.7. End-users
- 14.11. Poland Premium Snacking Market
- 14.11.1. Country Segmental Analysis
- 14.11.2. Product Type
- 14.11.3. Source
- 14.11.4. Flavor Profile
- 14.11.5. Packaging Type
- 14.11.6. Sales Channel
- 14.11.7. End-users
- 14.12. Russia & CIS Premium Snacking Market
- 14.12.1. Country Segmental Analysis
- 14.12.2. Product Type
- 14.12.3. Source
- 14.12.4. Flavor Profile
- 14.12.5. Packaging Type
- 14.12.6. Sales Channel
- 14.12.7. End-users
- 14.13. Rest of Europe Premium Snacking Market
- 14.13.1. Country Segmental Analysis
- 14.13.2. Product Type
- 14.13.3. Source
- 14.13.4. Flavor Profile
- 14.13.5. Packaging Type
- 14.13.6. Sales Channel
- 14.13.7. End-users
- 15. Asia Pacific Premium Snacking Market Analysis
- 15.1. Key Segment Analysis
- 15.2. Regional Snapshot
- 15.3. Asia Pacific Premium Snacking Market Size Value (US$ Bn), Analysis, and Forecasts, 2021-2035
- 15.3.1. Product Type
- 15.3.2. Source
- 15.3.3. Flavor Profile
- 15.3.4. Packaging Type
- 15.3.5. Sales Channel
- 15.3.6. End-users
- 15.3.7. Country
- 15.3.7.1. China
- 15.3.7.2. India
- 15.3.7.3. Japan
- 15.3.7.4. South Korea
- 15.3.7.5. Australia and New Zealand
- 15.3.7.6. Indonesia
- 15.3.7.7. Malaysia
- 15.3.7.8. Thailand
- 15.3.7.9. Vietnam
- 15.3.7.10. Rest of Asia Pacific
- 15.4. China Premium Snacking Market
- 15.4.1. Country Segmental Analysis
- 15.4.2. Product Type
- 15.4.3. Source
- 15.4.4. Flavor Profile
- 15.4.5. Packaging Type
- 15.4.6. Sales Channel
- 15.4.7. End-users
- 15.5. India Premium Snacking Market
- 15.5.1. Country Segmental Analysis
- 15.5.2. Product Type
- 15.5.3. Source
- 15.5.4. Flavor Profile
- 15.5.5. Packaging Type
- 15.5.6. Sales Channel
- 15.5.7. End-users
- 15.6. Japan Premium Snacking Market
- 15.6.1. Country Segmental Analysis
- 15.6.2. Product Type
- 15.6.3. Source
- 15.6.4. Flavor Profile
- 15.6.5. Packaging Type
- 15.6.6. Sales Channel
- 15.6.7. End-users
- 15.7. South Korea Premium Snacking Market
- 15.7.1. Country Segmental Analysis
- 15.7.2. Product Type
- 15.7.3. Source
- 15.7.4. Flavor Profile
- 15.7.5. Packaging Type
- 15.7.6. Sales Channel
- 15.7.7. End-users
- 15.8. Australia and New Zealand Premium Snacking Market
- 15.8.1. Country Segmental Analysis
- 15.8.2. Product Type
- 15.8.3. Source
- 15.8.4. Flavor Profile
- 15.8.5. Packaging Type
- 15.8.6. Sales Channel
- 15.8.7. End-users
- 15.9. Indonesia Premium Snacking Market
- 15.9.1. Country Segmental Analysis
- 15.9.2. Product Type
- 15.9.3. Source
- 15.9.4. Flavor Profile
- 15.9.5. Packaging Type
- 15.9.6. Sales Channel
- 15.9.7. End-users
- 15.10. Malaysia Premium Snacking Market
- 15.10.1. Country Segmental Analysis
- 15.10.2. Product Type
- 15.10.3. Source
- 15.10.4. Flavor Profile
- 15.10.5. Packaging Type
- 15.10.6. Sales Channel
- 15.10.7. End-users
- 15.11. Thailand Premium Snacking Market
- 15.11.1. Country Segmental Analysis
- 15.11.2. Product Type
- 15.11.3. Source
- 15.11.4. Flavor Profile
- 15.11.5. Packaging Type
- 15.11.6. Sales Channel
- 15.11.7. End-users
- 15.12. Vietnam Premium Snacking Market
- 15.12.1. Country Segmental Analysis
- 15.12.2. Product Type
- 15.12.3. Source
- 15.12.4. Flavor Profile
- 15.12.5. Packaging Type
- 15.12.6. Sales Channel
- 15.12.7. End-users
- 15.13. Rest of Asia Pacific Premium Snacking Market
- 15.13.1. Country Segmental Analysis
- 15.13.2. Product Type
- 15.13.3. Source
- 15.13.4. Flavor Profile
- 15.13.5. Packaging Type
- 15.13.6. Sales Channel
- 15.13.7. End-users
- 16. Middle East Premium Snacking Market Analysis
- 16.1. Key Segment Analysis
- 16.2. Regional Snapshot
- 16.3. Middle East Premium Snacking Market Size Value (US$ Bn), Analysis, and Forecasts, 2021-2035
- 16.3.1. Product Type
- 16.3.2. Source
- 16.3.3. Flavor Profile
- 16.3.4. Packaging Type
- 16.3.5. Sales Channel
- 16.3.6. End-users
- 16.3.7. Country
- 16.3.7.1. Turkey
- 16.3.7.2. UAE
- 16.3.7.3. Saudi Arabia
- 16.3.7.4. Israel
- 16.3.7.5. Rest of Middle East
- 16.4. Turkey Premium Snacking Market
- 16.4.1. Country Segmental Analysis
- 16.4.2. Product Type
- 16.4.3. Source
- 16.4.4. Flavor Profile
- 16.4.5. Packaging Type
- 16.4.6. Sales Channel
- 16.4.7. End-users
- 16.5. UAE Premium Snacking Market
- 16.5.1. Country Segmental Analysis
- 16.5.2. Product Type
- 16.5.3. Source
- 16.5.4. Flavor Profile
- 16.5.5. Packaging Type
- 16.5.6. Sales Channel
- 16.5.7. End-users
- 16.6. Saudi Arabia Premium Snacking Market
- 16.6.1. Country Segmental Analysis
- 16.6.2. Product Type
- 16.6.3. Source
- 16.6.4. Flavor Profile
- 16.6.5. Packaging Type
- 16.6.6. Sales Channel
- 16.6.7. End-users
- 16.7. Israel Premium Snacking Market
- 16.7.1. Country Segmental Analysis
- 16.7.2. Product Type
- 16.7.3. Source
- 16.7.4. Flavor Profile
- 16.7.5. Packaging Type
- 16.7.6. Sales Channel
- 16.7.7. End-users
- 16.8. Rest of Middle East Premium Snacking Market
- 16.8.1. Country Segmental Analysis
- 16.8.2. Product Type
- 16.8.3. Source
- 16.8.4. Flavor Profile
- 16.8.5. Packaging Type
- 16.8.6. Sales Channel
- 16.8.7. End-users
- 17. Africa Premium Snacking Market Analysis
- 17.1. Key Segment Analysis
- 17.2. Regional Snapshot
- 17.3. Africa Premium Snacking Market Size Value (US$ Bn), Analysis, and Forecasts, 2021-2035
- 17.3.1. Product Type
- 17.3.2. Source
- 17.3.3. Flavor Profile
- 17.3.4. Packaging Type
- 17.3.5. Sales Channel
- 17.3.6. End-users
- 17.3.7. Country
- 17.3.7.1. South Africa
- 17.3.7.2. Egypt
- 17.3.7.3. Nigeria
- 17.3.7.4. Algeria
- 17.3.7.5. Rest of Africa
- 17.4. South Africa Premium Snacking Market
- 17.4.1. Country Segmental Analysis
- 17.4.2. Product Type
- 17.4.3. Source
- 17.4.4. Flavor Profile
- 17.4.5. Packaging Type
- 17.4.6. Sales Channel
- 17.4.7. End-users
- 17.5. Egypt Premium Snacking Market
- 17.5.1. Country Segmental Analysis
- 17.5.2. Product Type
- 17.5.3. Source
- 17.5.4. Flavor Profile
- 17.5.5. Packaging Type
- 17.5.6. Sales Channel
- 17.5.7. End-users
- 17.6. Nigeria Premium Snacking Market
- 17.6.1. Country Segmental Analysis
- 17.6.2. Product Type
- 17.6.3. Source
- 17.6.4. Flavor Profile
- 17.6.5. Packaging Type
- 17.6.6. Sales Channel
- 17.6.7. End-users
- 17.7. Algeria Premium Snacking Market
- 17.7.1. Country Segmental Analysis
- 17.7.2. Product Type
- 17.7.3. Source
- 17.7.4. Flavor Profile
- 17.7.5. Packaging Type
- 17.7.6. Sales Channel
- 17.7.7. End-users
- 17.8. Rest of Africa Premium Snacking Market
- 17.8.1. Country Segmental Analysis
- 17.8.2. Product Type
- 17.8.3. Source
- 17.8.4. Flavor Profile
- 17.8.5. Packaging Type
- 17.8.6. Sales Channel
- 17.8.7. End-users
- 18. South America Premium Snacking Market Analysis
- 18.1. Key Segment Analysis
- 18.2. Regional Snapshot
- 18.3. South America Premium Snacking Market Size Value (US$ Bn), Analysis, and Forecasts, 2021-2035
- 18.3.1. Product Type
- 18.3.2. Source
- 18.3.3. Flavor Profile
- 18.3.4. Packaging Type
- 18.3.5. Sales Channel
- 18.3.6. End-users
- 18.3.7. Country
- 18.3.7.1. Brazil
- 18.3.7.2. Argentina
- 18.3.7.3. Rest of South America
- 18.4. Brazil Premium Snacking Market
- 18.4.1. Country Segmental Analysis
- 18.4.2. Product Type
- 18.4.3. Source
- 18.4.4. Flavor Profile
- 18.4.5. Packaging Type
- 18.4.6. Sales Channel
- 18.4.7. End-users
- 18.5. Argentina Premium Snacking Market
- 18.5.1. Country Segmental Analysis
- 18.5.2. Product Type
- 18.5.3. Source
- 18.5.4. Flavor Profile
- 18.5.5. Packaging Type
- 18.5.6. Sales Channel
- 18.5.7. End-users
- 18.6. Rest of South America Premium Snacking Market
- 18.6.1. Country Segmental Analysis
- 18.6.2. Product Type
- 18.6.3. Source
- 18.6.4. Flavor Profile
- 18.6.5. Packaging Type
- 18.6.6. Sales Channel
- 18.6.7. End-users
- 19. KeyPlayers/ Company Profile
- 19.1. Bokksu Inc.
- 19.1.1. Company Details/ Overview
- 19.1.2. Company Financials
- 19.1.3. Key Customers and Competitors
- 19.1.4. Business/ Industry Portfolio
- 19.1.5. Product Portfolio/ Specification Details
- 19.1.6. Pricing Data
- 19.1.7. Strategic Overview
- 19.1.8. Recent Developments
- 19.2. Conagra Brands
- 19.3. Danone S.A.
- 19.4. Ferrero Group
- 19.5. General Mills
- 19.6. Hippeas
- 19.7. Jack Link's Protein Snacks
- 19.8. Lesser Evil
- 19.9. Lindt & Sprüngli
- 19.10. Lotus Bakeries NV
- 19.11. Mars Incorporated
- 19.12. Mondelez International
- 19.13. Nestlé
- 19.14. PepsiCo
- 19.15. Siete Family Foods
- 19.16. The Hershey Company
- 19.17. Other Key PlayerS
- 19.1. Bokksu Inc.
Note* - This is just tentative list of players. While providing the report, we will cover more number of players based on their revenue and share for each geography
Research Design
Our research design integrates both demand-side and supply-side analysis through a balanced combination of primary and secondary research methodologies. By utilizing both bottom-up and top-down approaches alongside rigorous data triangulation methods, we deliver robust market intelligence that supports strategic decision-making.
MarketGenics' comprehensive research design framework ensures the delivery of accurate, reliable, and actionable market intelligence. Through the integration of multiple research approaches, rigorous validation processes, and expert analysis, we provide our clients with the insights needed to make informed strategic decisions and capitalize on market opportunities.
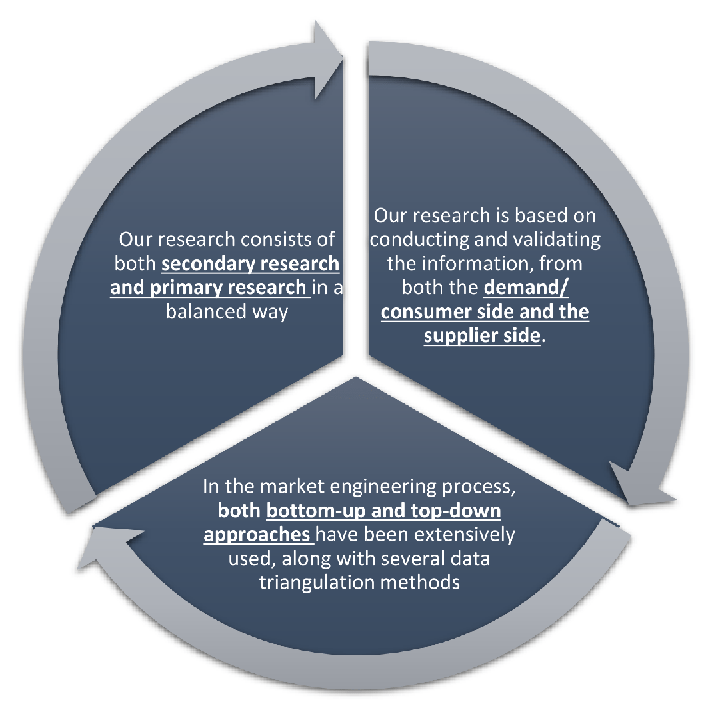
MarketGenics leverages a dedicated industry panel of experts and a comprehensive suite of paid databases to effectively collect, consolidate, and analyze market intelligence.
Our approach has consistently proven to be reliable and effective in generating accurate market insights, identifying key industry trends, and uncovering emerging business opportunities.
Through both primary and secondary research, we capture and analyze critical company-level data such as manufacturing footprints, including technical centers, R&D facilities, sales offices, and headquarters.
Our expert panel further enhances our ability to estimate market size for specific brands based on validated field-level intelligence.
Our data mining techniques incorporate both parametric and non-parametric methods, allowing for structured data collection, sorting, processing, and cleaning.
Demand projections are derived from large-scale data sets analyzed through proprietary algorithms, culminating in robust and reliable market sizing.
Research Approach
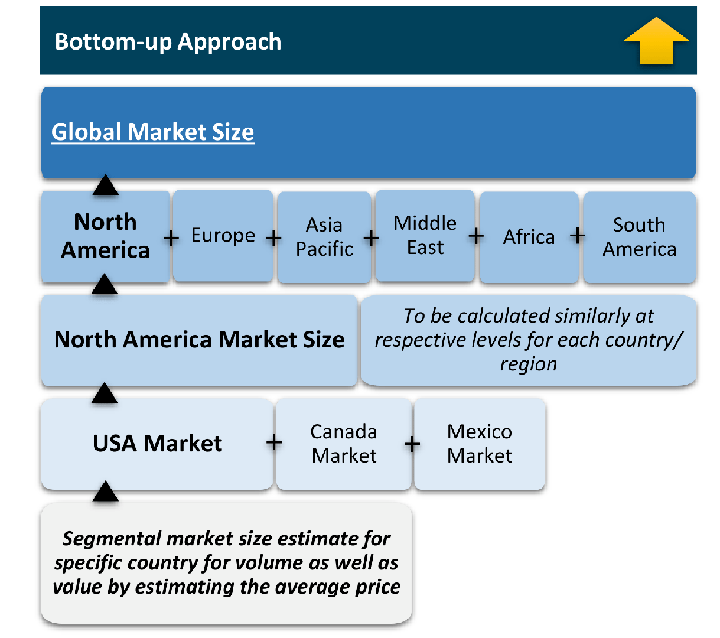
The bottom-up approach builds market estimates by starting with the smallest addressable market units and systematically aggregating them to create comprehensive market size projections.
This method begins with specific, granular data points and builds upward to create the complete market landscape.
Customer Analysis → Segmental Analysis → Geographical Analysis
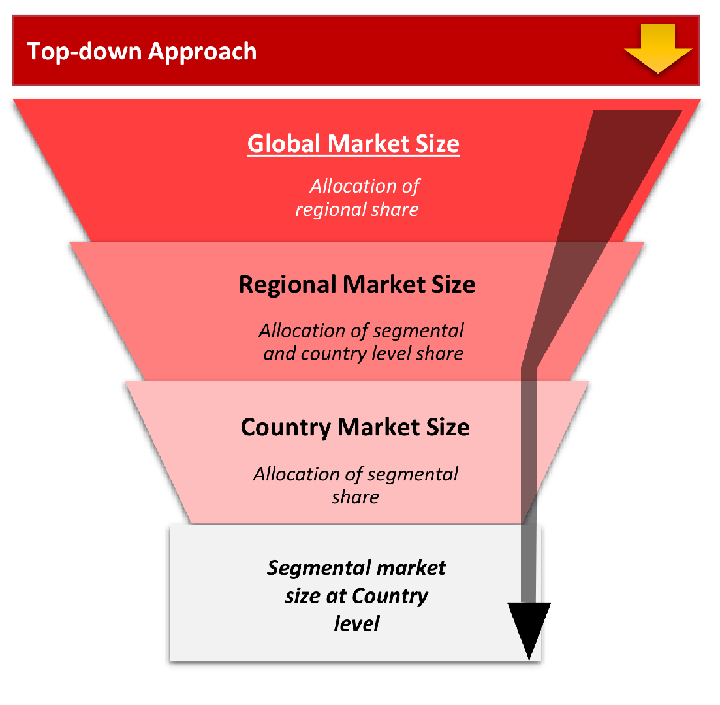
The top-down approach starts with the broadest possible market data and systematically narrows it down through a series of filters and assumptions to arrive at specific market segments or opportunities.
This method begins with the big picture and works downward to increasingly specific market slices.
TAM → SAM → SOM
Research Methods
Desk / Secondary Research
While analysing the market, we extensively study secondary sources, directories, and databases to identify and collect information useful for this technical, market-oriented, and commercial report. Secondary sources that we utilize are not only the public sources, but it is a combination of Open Source, Associations, Paid Databases, MG Repository & Knowledgebase, and others.
- Company websites, annual reports, financial reports, broker reports, and investor presentations
- National government documents, statistical databases and reports
- News articles, press releases and web-casts specific to the companies operating in the market, Magazines, reports, and others
- We gather information from commercial data sources for deriving company specific data such as segmental revenue, share for geography, product revenue, and others
- Internal and external proprietary databases (industry-specific), relevant patent, and regulatory databases
- Governing Bodies, Government Organizations
- Relevant Authorities, Country-specific Associations for Industries
We also employ the model mapping approach to estimate the product level market data through the players' product portfolio
Primary Research
Primary research/ interviews is vital in analyzing the market. Most of the cases involves paid primary interviews. Primary sources include primary interviews through e-mail interactions, telephonic interviews, surveys as well as face-to-face interviews with the different stakeholders across the value chain including several industry experts.
| Type of Respondents | Number of Primaries |
|---|---|
| Tier 2/3 Suppliers | ~20 |
| Tier 1 Suppliers | ~25 |
| End-users | ~25 |
| Industry Expert/ Panel/ Consultant | ~30 |
| Total | ~100 |
MG Knowledgebase
• Repository of industry blog, newsletter and case studies
• Online platform covering detailed market reports, and company profiles
Forecasting Factors and Models
Forecasting Factors
- Historical Trends – Past market patterns, cycles, and major events that shaped how markets behave over time. Understanding past trends helps predict future behavior.
- Industry Factors – Specific characteristics of the industry like structure, regulations, and innovation cycles that affect market dynamics.
- Macroeconomic Factors – Economic conditions like GDP growth, inflation, and employment rates that affect how much money people have to spend.
- Demographic Factors – Population characteristics like age, income, and location that determine who can buy your product.
- Technology Factors – How quickly people adopt new technology and how much technology infrastructure exists.
- Regulatory Factors – Government rules, laws, and policies that can help or restrict market growth.
- Competitive Factors – Analyzing competition structure such as degree of competition and bargaining power of buyers and suppliers.
Forecasting Models / Techniques
Multiple Regression Analysis
- Identify and quantify factors that drive market changes
- Statistical modeling to establish relationships between market drivers and outcomes
Time Series Analysis – Seasonal Patterns
- Understand regular cyclical patterns in market demand
- Advanced statistical techniques to separate trend, seasonal, and irregular components
Time Series Analysis – Trend Analysis
- Identify underlying market growth patterns and momentum
- Statistical analysis of historical data to project future trends
Expert Opinion – Expert Interviews
- Gather deep industry insights and contextual understanding
- In-depth interviews with key industry stakeholders
Multi-Scenario Development
- Prepare for uncertainty by modeling different possible futures
- Creating optimistic, pessimistic, and most likely scenarios
Time Series Analysis – Moving Averages
- Sophisticated forecasting for complex time series data
- Auto-regressive integrated moving average models with seasonal components
Econometric Models
- Apply economic theory to market forecasting
- Sophisticated economic models that account for market interactions
Expert Opinion – Delphi Method
- Harness collective wisdom of industry experts
- Structured, multi-round expert consultation process
Monte Carlo Simulation
- Quantify uncertainty and probability distributions
- Thousands of simulations with varying input parameters
Research Analysis
Our research framework is built upon the fundamental principle of validating market intelligence from both demand and supply perspectives. This dual-sided approach ensures comprehensive market understanding and reduces the risk of single-source bias.
Demand-Side Analysis: We understand end-user/application behavior, preferences, and market needs along with the penetration of the product for specific application.
Supply-Side Analysis: We estimate overall market revenue, analyze the segmental share along with industry capacity, competitive landscape, and market structure.
Validation & Evaluation
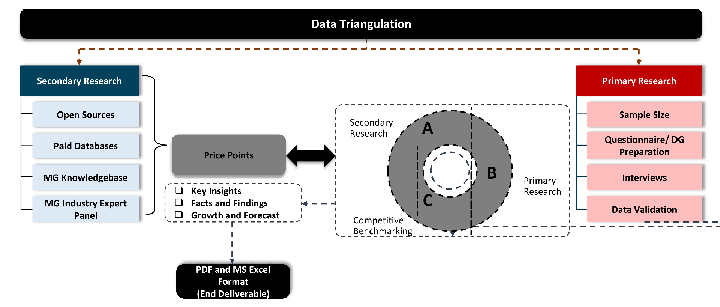
Data triangulation is a validation technique that uses multiple methods, sources, or perspectives to examine the same research question, thereby increasing the credibility and reliability of research findings. In market research, triangulation serves as a quality assurance mechanism that helps identify and minimize bias, validate assumptions, and ensure accuracy in market estimates.
- Data Source Triangulation – Using multiple data sources to examine the same phenomenon
- Methodological Triangulation – Using multiple research methods to study the same research question
- Investigator Triangulation – Using multiple researchers or analysts to examine the same data
- Theoretical Triangulation – Using multiple theoretical perspectives to interpret the same data
Custom Market Research Services
We will customise the research for you, in case the report listed above does not meet your requirements.
Get 10% Free Customisation