Beverage Fortification Market Size, Share & Trends Analysis Report by Ingredient Type (Vitamins, Minerals, Proteins & Amino Acids, Probiotics & Prebiotics, Omega Fatty Acids, Botanicals & Herbal Extracts, Antioxidants, Fiber, Enzymes, Electrolytes, Specialty Nutrients), Beverage Type, Function, Packaging Type, Sales Channel, and Geography (North America, Europe, Asia Pacific, Middle East, Africa, and South America) – Global Industry Data, Trends, and Forecasts, 2026–2035
|
|
|
Segmental Data Insights |
|
|
Demand Trends |
|
|
Competitive Landscape |
|
|
Strategic Development |
|
|
Future Outlook & Opportunities |
|
Beverage Fortification Market Size, Share, and Growth
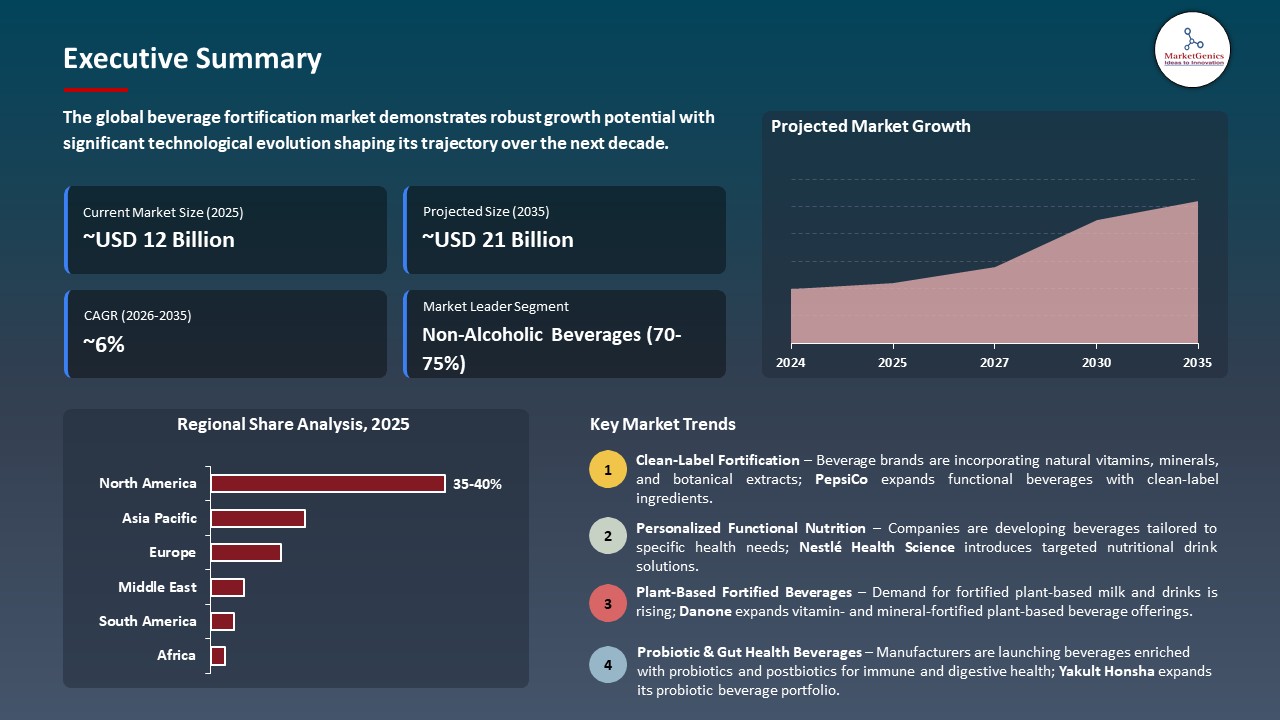
The global beverage fortification market is exhibiting strong growth, with an estimated value of USD 11.6 billion in 2025 and USD 21.2 billion by 2035, achieving a CAGR of 6.2%, during the forecast period. The Beverage Fortification market is rapidly growing in Asia Pacific due to rising health awareness, increasing disposable incomes, expanding urban populations, growing demand for functional beverages, and rapid product innovation by regional and global beverage manufacturers.
Anirban Basu, general manager for Abbott’s nutrition business in India, said, “Feeling strong as we age isn’t driven by a single element, it’s the result of several functions in the body supporting one another, Our scientifically formulated Ensure Strength Pro, helps adults meet their evolving nutritional needs9, especially in the context of common nutrient inadequacies, so they can stay active, engaged, and confident as they age”
The beverage fortification market is being significantly impacted by a growing preference for preventive health and functional nutrition, as consumers demand “fortified” beverages with vitamins and minerals, probiotics, proteins, electrolytes and botanicals that promote immunity, hydration, energy and overall wellness. Beverage companies are racing to innovate and come up with clean label, low sugar and scientifically-designed drinks that appeal to health-conscious consumers of all ages.
In 2025, Kerry furthered its use of Wellmune yeast beta-glucan postbiotic in functional beverages, where the company is introducing fortified non-alcoholic beverages containing Wellmune beta-glucan to support the immune system for various consumer segments, with clinical evidence to back up the health claims. As more investments are made on functional beverage fortification using clinically proven ingredients, Nissin York Co., Ltd. launched Pilkul Immune Style, a functional probiotic drink containing Lactobacillus NY1301 and GK-1 acetic acid bacteria for immunity and gut health in 2025.
Key adjacent opportunities for the beverage fortification market include functional foods, dietary supplements, sports nutrition products, personalized nutrition solutions, and plant-based beverages. These sectors leverage similar bioactive ingredients, health-focused formulations, and wellness-driven consumer demand, creating cross-category innovation, ingredient partnerships, and portfolio expansion opportunities for beverage manufacturers.
Beverage Fortification Market Dynamics and Trends
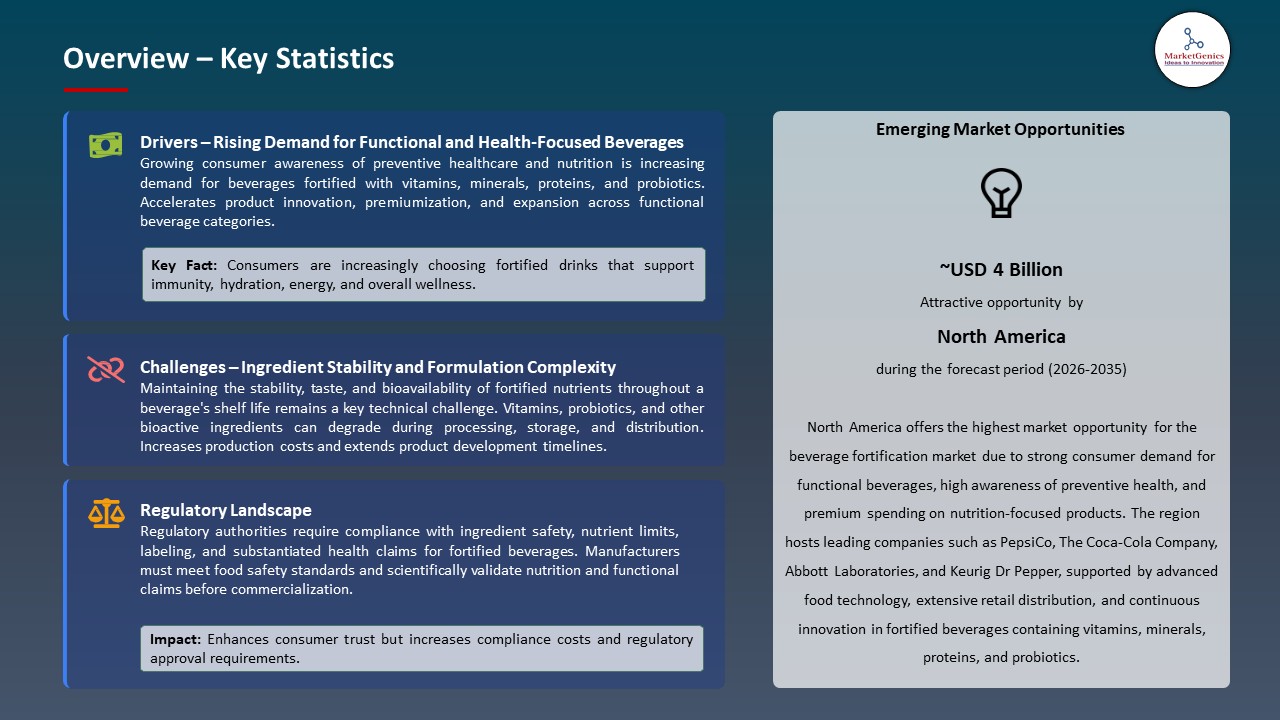
Driver: Increasing Demand for Functional Beverages Supporting Immunity, Hydration, and Energy
- Increasing consumer interest in preventive healt" and active lifestyles is helping to fuel robust demand for fortified beverages market that provide targeted functional benefits other than hydration. Drinkables that contain vitamins, minerals, electrolytes, proteins, probiotics, and botanical extracts that boost immunity, sustain energy, keep them hydrated, aid digestion, and enhance overall physical activity are now more popular than ever.
- This trend is driving beverage brands to diversify portfolios with low sugar, scientifically formulated and ‘clean label' products designed to meet consumer needs such as sports nutrition, health and wellness for the elderly, and wellness.
- Long term growth prospects for beverage fortification continue to be strong, with continuous innovation driving functional ingredient and convenient ready-to-drink formats into products and driving adoption across both developed and emerging markets.
Restraint: Nutrient Stability Challenges During Beverage Processing Complicate Product Quality and Shelf Life
- Stability of fortified nutrients during beverage processing is a challenging issue for the manufacturers. Many vitamins, probiotics, proteins, omega-3 fatty acids and botanicals are heat, light, oxygen, acidity and storage sensitive, which results in loss of nutrients and functional activity. Advanced formulation technologies and specialized processing methods are necessary to preserve nutritional value while maintaining flavor, texture, color and product appearance.
- Manufacturers need to invest in packaging technologies, manufacturing control and long term stability tests to assure that the nutrients are delivered in a consistent manner during the shelf-life of their product. The extra technical requirements will drive up the cost of R&D, production and commercialisation, and make it more challenging to introduce cost-effective fortified beverages across various product categories.
- Nutrient stability requirements add to the complexity and cost of formulation and can reduce the scalability and profitability of innovations in fortified beverages.
Opportunity: Growing Healthy Aging Population Creates Premium Fortified Beverage Innovation Potential Globally
- The growing aging population is providing huge opportunities for beverage companies to offer fortified products that can help support healthy aging, mobility, bone strength, cognitive function and immunity. As consumers age, they are looking for convenient nutritional drinks that are high in protein, calcium, vitamin D, collagen, and minerals.
- The demographic shift is helping to fuel product innovation with high quality, scientific-based fortified drinks designed for age-specific health needs and an increase in distribution channels, such as health, pharmacy and wellness retail stores.
- Abbott introduced Ensure Strength Pro in India in May 2026, a fortified nutritional beverage rich in 31 essential nutrients and 30 g of high-quality protein for maintaining muscles, bones, heart health, immune function, metabolism and nervous system function in elderly adults.
- The global beverage fortification market is witnessing long-term growth prospects with the development of healthy aging trends, which are fueling the innovation of the beverage products.
Key Trend: Precision Fortification Technologies Enable Personalized Functional Beverage Product Development Across Consumer Segments
- Precision fortification is one trend that is gaining significance in the Beverage Fortification market as manufacturers are creating products for specific health benefits, age groups, and lifestyle requirements. Specialized combinations of vitamins, minerals, probiotics, proteins, botanicals and bioactive are being used to create products that will help fortify immunity, nourish hydration, promote brain health, aid digestion, enhance sports performance and help maintain healthy aging.
- The nutritional science advances, new technologies to deliver nutrients and the consumption data from the consumer are allowing more science-based personalization in beverage formulation and product differentiation and premium positioning in global markets.
- Probi in May 2025 introduced the first fermented carrot juice in Japan with added LP299V probiotic, which has been clinically proven, under the brand name My Flora, offering targeted digestive health support.
- Precision fortification is fueling the trend toward highly targeted, value-added and functional beverages that are enhancing consumer engagement and premium market expansion.
Beverage Fortification Market Analysis and Segmental Data
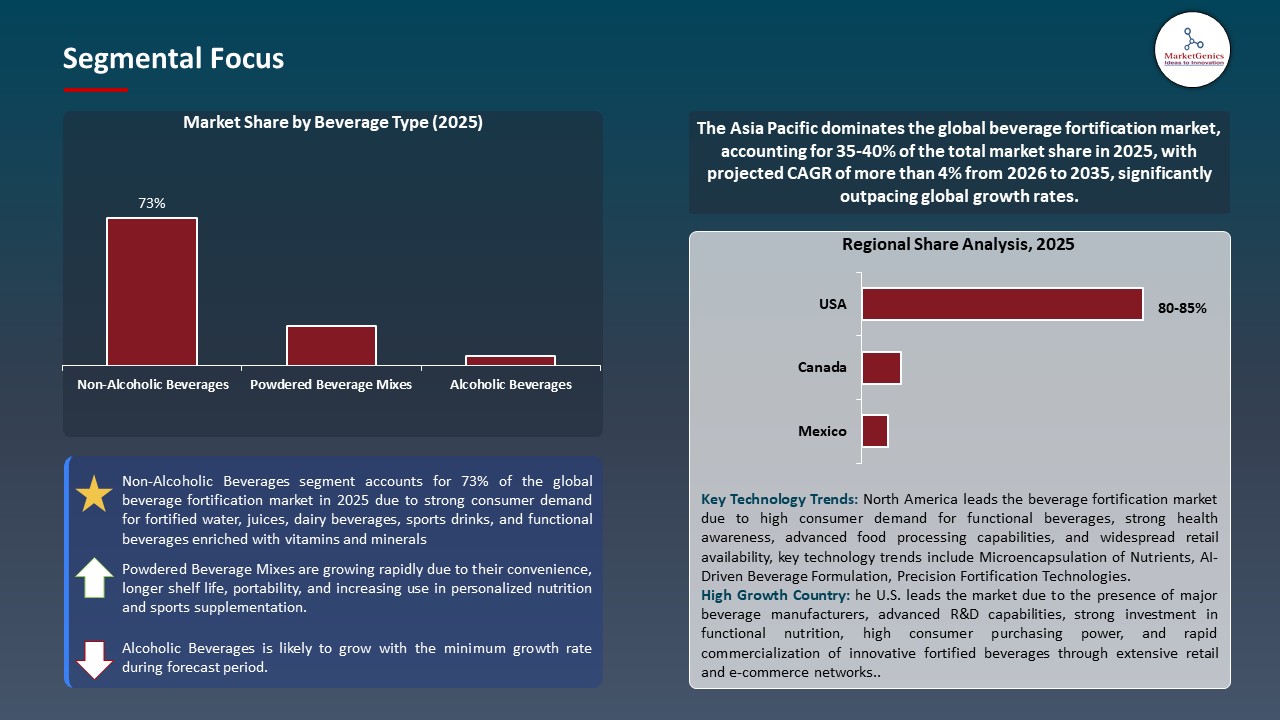
Non-Alcoholic Beverages Dominate Global Beverage Fortification Market
- Non-alcoholic beverages represent the largest segment of the Beverage Fortification market due to its functional benefits, including immunity support, hydration, energy boost, digestive health, and nutrition, boasting strong consumer demand for healthier beverage options.
- Juices, dairy drinks, sports drinks, energy drinks, bottled water and ready-to-drink teas are being enriched with vitamins, minerals, probiotics and plant-based ingredients at an ever-increasing rate.
- In 2025, The Coca-Cola Company introduced its prebiotic soda Simply Pop, which features 6g of prebiotic fiber, Vitamin C and Zinc to support gut and immune health, joining the functional beverage market.
- The global non-alcoholic beverages market is expected to lead the market due to continuous product innovation, increasing preference for low sugar functional beverages, and the wide availability of these beverages in retail and e-commerce outlets.
North America Leads Global Beverage Fortification Market Demand
- The Beverage Fortification market is led by the North America region, as the region's consumers are particularly interested in health beverages and drinks that are fortified with vitamins and minerals to support immunity, hydration and digestive health, energy, and improved overall wellness. A stronger purchasing power, high level of health awareness and general consumerization of functional ingredients have driven the consumption of fortified juices, dairy drinks, sports drinks, energy drinks and ready-to-drink functional drinks.
- Leading food and beverage companies continually innovate the product line within the region, and well-known retail and e-commerce distribution channels ensure the products reach end consumers, while the region's growing adoption of clinically proven ingredients guarantees their quality.
- These factors remain to further strengthen North America's position as a leader in the worldwide Beverage Fortification market and continue to drive premium product growth.
Beverage Fortification Market Ecosystem
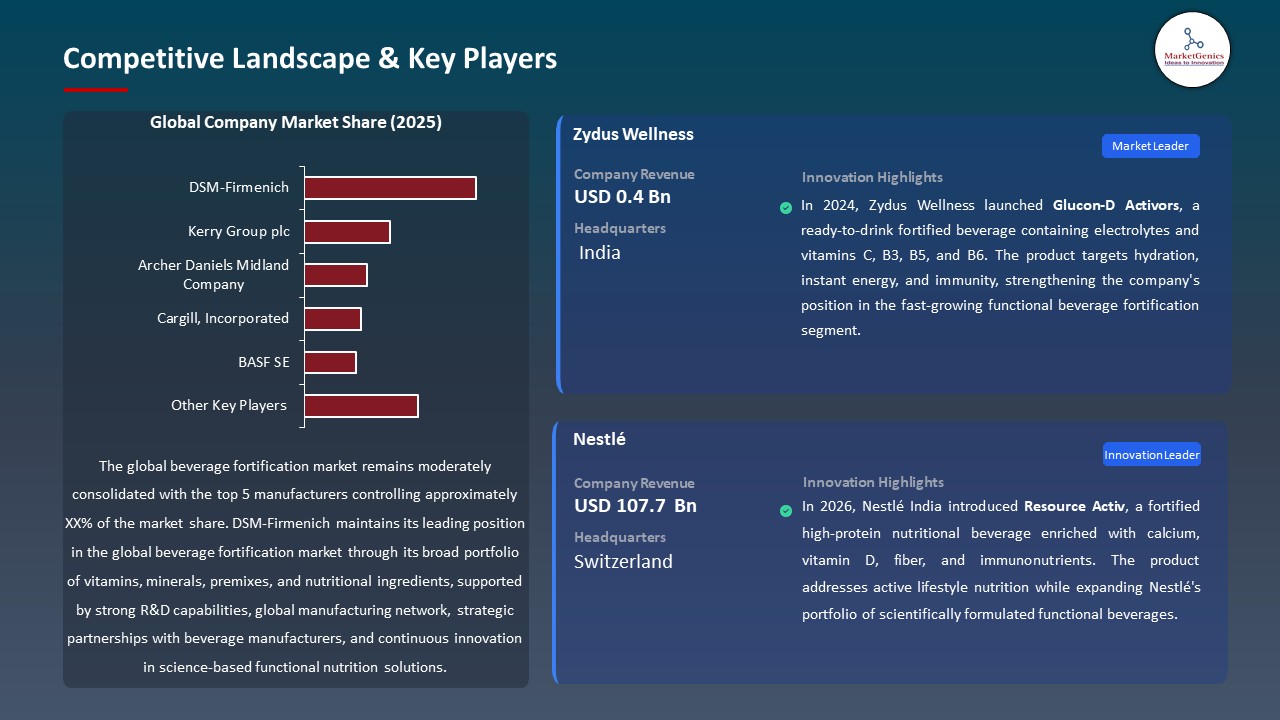
The beverage fortification market is consolidated, with leading players such as DSM-Firmenich, Kerry Group, Archer Daniels Midland Company (ADM), Cargill, Incorporated, and BASF driving innovation through advanced micronutrient systems, functional ingredient solutions, clinically validated probiotics and postbiotics, plant-based nutrition, and customized beverage fortification technologies. These companies are strengthening their competitive positioning by expanding science-backed ingredient portfolios, investing in research and development, and supporting beverage manufacturers with clean-label, stable, and highly bioavailable fortification solutions.
Precision nutrition, ingredient encapsulation technologies, digital formulation platforms, and consumer health insights are becoming increasingly important for developing next-generation fortified beverages that target immunity, hydration, digestive health, cognitive wellness, sports nutrition, and healthy aging. Manufacturers are also emphasizing sustainable ingredient sourcing, improved nutrient stability, sugar reduction, and personalized nutrition solutions to meet evolving regulatory requirements and consumer preferences.
The market is evolving steadily, with competition centered on scientific innovation, customized fortification technologies, clinically validated ingredients, and sustainable nutrition solutions that enable differentiated functional beverage development across global market.
Recent Development and Strategic Overview:
- In February 2025, Archer Daniels Midland (ADM) entered an exclusive distribution agreement with Asahi Group Foods to commercialize the clinically validated postbiotic Lactobacillus gasseri CP2305, enabling beverage manufacturers across North America, Europe, and Asia to develop fortified functional beverages targeting stress, mood, and sleep health.
- In September 2025, Danone's Silk brand launched a new plant-based fortified beverage formula in Mexico containing six essential nutrients, enhanced texture, and improved taste, strengthening its portfolio of nutrient-enriched dairy alternatives to meet growing consumer demand for nutritious and functional beverages.
Report Scope
|
Detail |
|
|
Market Size in 2025 |
USD 11.6 Bn |
|
Market Forecast Value in 2035 |
USD 21.2 Bn |
|
Growth Rate (CAGR) |
6.2% |
|
Forecast Period |
2026 – 2035 |
|
Historical Data Available for |
2021 – 2024 |
|
Market Size Units |
US$ Billion for Value |
|
Report Format |
Electronic (PDF) + Excel |
|
North America |
Europe |
Asia Pacific |
Middle East |
Africa |
South America |
|
|
|
|
|
|
|
Companies Covered |
|||||
|
|||||
Beverage Fortification Market Segmentation and Highlights
|
Segment |
Sub-segment |
|
Beverage Fortification Market, By Ingredient Type |
|
|
Beverage Fortification Market, By Beverage Type |
|
|
Beverage Fortification Market, By Function |
|
|
Beverage Fortification Market, By Packaging Type |
|
|
Beverage Fortification Market, By Sales Channel |
|
Frequently Asked Questions
Table of Contents
- 1. Research Methodology and Assumptions
- 1.1. Definitions
- 1.2. Research Design and Approach
- 1.3. Data Collection Methods
- 1.4. Base Estimates and Calculations
- 1.5. Forecasting Models
- 1.5.1. Key Forecast Factors & Impact Analysis
- 1.6. Secondary Research
- 1.6.1. Open Sources
- 1.6.2. Paid Databases
- 1.6.3. Associations
- 1.7. Primary Research
- 1.7.1. Primary Sources
- 1.7.2. Primary Interviews with Stakeholders across Ecosystem
- 2. Executive Summary
- 2.1. Global Beverage Fortification Market Outlook
- 2.1.1. Beverage Fortification Market Size (Value - US$ Bn), and Forecasts, 2021-2035
- 2.1.2. Compounded Annual Growth Rate Analysis
- 2.1.3. Growth Opportunity Analysis
- 2.1.4. Segmental Share Analysis
- 2.1.5. Geographical Share Analysis
- 2.2. Market Analysis and Facts
- 2.3. Supply-Demand Analysis
- 2.4. Competitive Benchmarking
- 2.5. Go-to- Market Strategy
- 2.5.1. Customer/ End-use Industry Assessment
- 2.5.2. Growth Opportunity Data, 2026-2035
- 2.5.2.1. Regional Data
- 2.5.2.2. Country Data
- 2.5.2.3. Segmental Data
- 2.5.3. Identification of Potential Market Spaces
- 2.5.4. GAP Analysis
- 2.5.5. Potential Attractive Price Points
- 2.5.6. Prevailing Market Risks & Challenges
- 2.5.7. Preferred Sales & Marketing Strategies
- 2.5.8. Key Recommendations and Analysis
- 2.5.9. A Way Forward
- 2.1. Global Beverage Fortification Market Outlook
- 3. Industry Data and Premium Insights
- 3.1. Global Food & Beverages Industry Overview, 2025
- 3.1.1. Food & Beverages Ecosystem Analysis
- 3.1.2. Key Trends for Food & Beverages Industry
- 3.1.3. Regional Distribution for Food & Beverages Industry
- 3.2. Supplier Customer Data
- 3.3. Technology Roadmap and Developments
- 3.4. Trade Analysis
- 3.4.1. Import & Export Analysis, 2025
- 3.4.2. Top Importing Countries
- 3.4.3. Top Exporting Countries
- 3.5. Trump Tariff Impact Analysis
- 3.5.1. Manufacturer
- 3.5.1.1. Based on the component & Raw material
- 3.5.2. Supply Chain
- 3.5.3. End Consumer
- 3.5.1. Manufacturer
- 3.6. Raw Material Analysis
- 3.1. Global Food & Beverages Industry Overview, 2025
- 4. Market Overview
- 4.1. Market Dynamics
- 4.1.1. Drivers
- 4.1.1.1. Rising consumer demand for functional and health-focused beverages
- 4.1.1.2. Increasing adoption of vitamin- and mineral-fortified drinks
- 4.1.1.3. Growing awareness of preventive nutrition and wellness
- 4.1.2. Restraints
- 4.1.2.1. Stringent regulations governing fortification claims and ingredient usage
- 4.1.2.2. High costs associated with premium fortifying ingredients
- 4.1.1. Drivers
- 4.2. Key Trend Analysis
- 4.3. Regulatory Framework
- 4.3.1. Key Regulations, Norms, and Subsidies, by Key Countries
- 4.3.2. Tariffs and Standards
- 4.3.3. Impact Analysis of Regulations on the Market
- 4.4. Value Chain Analysis
- 4.4.1. Raw Material Suppliers
- 4.4.2. Fortification Ingredient Manufacturers
- 4.4.3. Beverage Manufacturers
- 4.4.4. Distributors & Wholesalers
- 4.4.5. Retailers & E-commerce Platforms
- 4.5. Porter’s Five Forces Analysis
- 4.6. PESTEL Analysis
- 4.7. Global Beverage Fortification Market Demand
- 4.7.1. Historical Market Size – in Value (US$ Bn), 2020-2024
- 4.7.2. Current and Future Market Size – in Value (US$ Bn), 2026–2035
- 4.7.2.1. Y-o-Y Growth Trends
- 4.7.2.2. Absolute $ Opportunity Assessment
- 4.1. Market Dynamics
- 5. Competition Landscape
- 5.1. Competition structure
- 5.1.1. Fragmented v/s consolidated
- 5.2. Company Share Analysis, 2025
- 5.2.1. Global Company Market Share
- 5.2.2. By Region
- 5.2.2.1. North America
- 5.2.2.2. Europe
- 5.2.2.3. Asia Pacific
- 5.2.2.4. Middle East
- 5.2.2.5. Africa
- 5.2.2.6. South America
- 5.3. Product Comparison Matrix
- 5.3.1. Specifications
- 5.3.2. Market Positioning
- 5.3.3. Pricing
- 5.1. Competition structure
- 6. Global Beverage Fortification Market Analysis, by Ingredient Type
- 6.1. Key Segment Analysis
- 6.2. Beverage Fortification Market Size (Value - US$ Bn), Analysis, and Forecasts, by Ingredient Type, 2021-2035
- 6.2.1. Vitamins
- 6.2.2. Minerals
- 6.2.3. Proteins & Amino Acids
- 6.2.4. Probiotics & Prebiotics
- 6.2.5. Omega Fatty Acids
- 6.2.6. Botanicals & Herbal Extracts
- 6.2.7. Antioxidants
- 6.2.8. Fiber
- 6.2.9. Enzymes
- 6.2.10. Electrolytes
- 6.2.11. Specialty Nutrients
- 7. Global Beverage Fortification Market Analysis, by Beverage Type
- 7.1. Key Segment Analysis
- 7.2. Beverage Fortification Market Size (Value - US$ Bn), Analysis, and Forecasts, by Beverage Type, 2021-2035
- 7.2.1. Non-Alcoholic Beverages
- 7.2.1.1. Bottled Water
- 7.2.1.2. Fruit Juices & Nectars
- 7.2.1.3. RTD Tea & Coffee
- 7.2.1.4. Energy Drinks
- 7.2.1.5. Others
- 7.2.2. Alcoholic Beverages
- 7.2.2.1. Fortified Wines
- 7.2.2.2. Enhanced Beer & Hard Seltzers
- 7.2.2.3. RTD Cocktails
- 7.2.2.4. Others
- 7.2.3. Powdered Beverage Mixes
- 7.2.1. Non-Alcoholic Beverages
- 8. Global Beverage Fortification Market Analysis, by Function
- 8.1. Key Segment Analysis
- 8.2. Beverage Fortification Market Size (Value - US$ Bn), Analysis, and Forecasts, by Function, 2021-2035
- 8.2.1. Immunity Boosting
- 8.2.2. Energy & Vitality Enhancement
- 8.2.3. Bone & Joint Health
- 8.2.4. Digestive Health
- 8.2.5. Cognitive Health
- 8.2.6. Sports Performance & Recovery
- 8.2.7. Anti-Aging & Longevity
- 8.2.8. Others
- 9. Global Beverage Fortification Market Analysis, by Packaging Type
- 9.1. Key Segment Analysis
- 9.2. Beverage Fortification Market Size (Value - US$ Bn), Analysis, and Forecasts, by Packaging Type, 2021-2035
- 9.2.1. PET Bottles
- 9.2.2. Glass Bottles
- 9.2.3. Aseptic Cartons
- 9.2.4. Aluminium Cans
- 9.2.5. HDPE Bottles
- 9.2.6. Bag-in-Box
- 10. Global Beverage Fortification Market Analysis, by Sales Channel
- 10.1. Key Segment Analysis
- 10.2. Beverage Fortification Market Size (Value - US$ Bn), Analysis, and Forecasts, by Sales Channel, 2021-2035
- 10.2.1. Retail
- 10.2.1.1. Supermarkets & Hypermarkets
- 10.2.1.2. Specialty Health & Wellness Stores
- 10.2.1.3. Convenience Stores
- 10.2.1.4. Others
- 10.2.2. Online & E-Commerce
- 10.2.2.1. Brand D2C Platforms
- 10.2.2.2. Third-Party Marketplaces
- 10.2.3. B2B Supply
- 10.2.1. Retail
- 11. Global Beverage Fortification Market Analysis, by Region
- 11.1. Key Findings
- 11.2. Beverage Fortification Market Size (Value - US$ Bn), Analysis, and Forecasts, by Region, 2021-2035
- 11.2.1. North America
- 11.2.2. Europe
- 11.2.3. Asia Pacific
- 11.2.4. Middle East
- 11.2.5. Africa
- 11.2.6. South America
- 12. North America Beverage Fortification Market Analysis
- 12.1. Key Segment Analysis
- 12.2. Regional Snapshot
- 12.3. North America Beverage Fortification Market Size (Value - US$ Bn), Analysis, and Forecasts, 2021-2035
- 12.3.1. Ingredient Type
- 12.3.2. Beverage Type
- 12.3.3. Function
- 12.3.4. Packaging Type
- 12.3.5. Sales Channel
- 12.3.6. Country
- 12.3.6.1. USA
- 12.3.6.2. Canada
- 12.3.6.3. Mexico
- 12.4. USA Beverage Fortification Market
- 12.4.1. Country Segmental Analysis
- 12.4.2. Ingredient Type
- 12.4.3. Beverage Type
- 12.4.4. Function
- 12.4.5. Packaging Type
- 12.4.6. Sales Channel
- 12.5. Canada Beverage Fortification Market
- 12.5.1. Country Segmental Analysis
- 12.5.2. Ingredient Type
- 12.5.3. Beverage Type
- 12.5.4. Function
- 12.5.5. Packaging Type
- 12.5.6. Sales Channel
- 12.6. Mexico Beverage Fortification Market
- 12.6.1. Country Segmental Analysis
- 12.6.2. Ingredient Type
- 12.6.3. Beverage Type
- 12.6.4. Function
- 12.6.5. Packaging Type
- 12.6.6. Sales Channel
- 13. Europe Beverage Fortification Market Analysis
- 13.1. Key Segment Analysis
- 13.2. Regional Snapshot
- 13.3. Europe Beverage Fortification Market Size (Value - US$ Bn), Analysis, and Forecasts, 2021-2035
- 13.3.1. Ingredient Type
- 13.3.2. Beverage Type
- 13.3.3. Function
- 13.3.4. Packaging Type
- 13.3.5. Sales Channel
- 13.3.6. Country
- 13.3.6.1. Germany
- 13.3.6.2. United Kingdom
- 13.3.6.3. France
- 13.3.6.4. Italy
- 13.3.6.5. Spain
- 13.3.6.6. Netherlands
- 13.3.6.7. Nordic Countries
- 13.3.6.8. Poland
- 13.3.6.9. Russia & CIS
- 13.3.6.10. Rest of Europe
- 13.4. Germany Beverage Fortification Market
- 13.4.1. Country Segmental Analysis
- 13.4.2. Ingredient Type
- 13.4.3. Beverage Type
- 13.4.4. Function
- 13.4.5. Packaging Type
- 13.4.6. Sales Channel
- 13.5. United Kingdom Beverage Fortification Market
- 13.5.1. Country Segmental Analysis
- 13.5.2. Ingredient Type
- 13.5.3. Beverage Type
- 13.5.4. Function
- 13.5.5. Packaging Type
- 13.5.6. Sales Channel
- 13.6. France Beverage Fortification Market
- 13.6.1. Country Segmental Analysis
- 13.6.2. Ingredient Type
- 13.6.3. Beverage Type
- 13.6.4. Function
- 13.6.5. Packaging Type
- 13.6.6. Sales Channel
- 13.7. Italy Beverage Fortification Market
- 13.7.1. Country Segmental Analysis
- 13.7.2. Ingredient Type
- 13.7.3. Beverage Type
- 13.7.4. Function
- 13.7.5. Packaging Type
- 13.7.6. Sales Channel
- 13.8. Spain Beverage Fortification Market
- 13.8.1. Country Segmental Analysis
- 13.8.2. Ingredient Type
- 13.8.3. Beverage Type
- 13.8.4. Function
- 13.8.5. Packaging Type
- 13.8.6. Sales Channel
- 13.9. Netherlands Beverage Fortification Market
- 13.9.1. Country Segmental Analysis
- 13.9.2. Ingredient Type
- 13.9.3. Beverage Type
- 13.9.4. Function
- 13.9.5. Packaging Type
- 13.9.6. Sales Channel
- 13.10. Nordic Countries Beverage Fortification Market
- 13.10.1. Country Segmental Analysis
- 13.10.2. Ingredient Type
- 13.10.3. Beverage Type
- 13.10.4. Function
- 13.10.5. Packaging Type
- 13.10.6. Sales Channel
- 13.11. Poland Beverage Fortification Market
- 13.11.1. Country Segmental Analysis
- 13.11.2. Ingredient Type
- 13.11.3. Beverage Type
- 13.11.4. Function
- 13.11.5. Packaging Type
- 13.11.6. Sales Channel
- 13.12. Russia & CIS Beverage Fortification Market
- 13.12.1. Country Segmental Analysis
- 13.12.2. Ingredient Type
- 13.12.3. Beverage Type
- 13.12.4. Function
- 13.12.5. Packaging Type
- 13.12.6. Sales Channel
- 13.13. Rest of Europe Beverage Fortification Market
- 13.13.1. Country Segmental Analysis
- 13.13.2. Ingredient Type
- 13.13.3. Beverage Type
- 13.13.4. Function
- 13.13.5. Packaging Type
- 13.13.6. Sales Channel
- 14. Asia Pacific Beverage Fortification Market Analysis
- 14.1. Key Segment Analysis
- 14.2. Regional Snapshot
- 14.3. Asia Pacific Beverage Fortification Market Size (Value - US$ Bn), Analysis, and Forecasts, 2021-2035
- 14.3.1. Ingredient Type
- 14.3.2. Beverage Type
- 14.3.3. Function
- 14.3.4. Packaging Type
- 14.3.5. Sales Channel
- 14.3.6. Country
- 14.3.6.1. China
- 14.3.6.2. India
- 14.3.6.3. Japan
- 14.3.6.4. South Korea
- 14.3.6.5. Australia and New Zealand
- 14.3.6.6. Indonesia
- 14.3.6.7. Malaysia
- 14.3.6.8. Thailand
- 14.3.6.9. Vietnam
- 14.3.6.10. Rest of Asia Pacific
- 14.4. China Beverage Fortification Market
- 14.4.1. Country Segmental Analysis
- 14.4.2. Ingredient Type
- 14.4.3. Beverage Type
- 14.4.4. Function
- 14.4.5. Packaging Type
- 14.4.6. Sales Channel
- 14.5. India Beverage Fortification Market
- 14.5.1. Country Segmental Analysis
- 14.5.2. Ingredient Type
- 14.5.3. Beverage Type
- 14.5.4. Function
- 14.5.5. Packaging Type
- 14.5.6. Sales Channel
- 14.6. Japan Beverage Fortification Market
- 14.6.1. Country Segmental Analysis
- 14.6.2. Ingredient Type
- 14.6.3. Beverage Type
- 14.6.4. Function
- 14.6.5. Packaging Type
- 14.6.6. Sales Channel
- 14.7. South Korea Beverage Fortification Market
- 14.7.1. Country Segmental Analysis
- 14.7.2. Ingredient Type
- 14.7.3. Beverage Type
- 14.7.4. Function
- 14.7.5. Packaging Type
- 14.7.6. Sales Channel
- 14.8. Australia and New Zealand Beverage Fortification Market
- 14.8.1. Country Segmental Analysis
- 14.8.2. Ingredient Type
- 14.8.3. Beverage Type
- 14.8.4. Function
- 14.8.5. Packaging Type
- 14.8.6. Sales Channel
- 14.9. Indonesia Beverage Fortification Market
- 14.9.1. Country Segmental Analysis
- 14.9.2. Ingredient Type
- 14.9.3. Beverage Type
- 14.9.4. Function
- 14.9.5. Packaging Type
- 14.9.6. Sales Channel
- 14.10. Malaysia Beverage Fortification Market
- 14.10.1. Country Segmental Analysis
- 14.10.2. Ingredient Type
- 14.10.3. Beverage Type
- 14.10.4. Function
- 14.10.5. Packaging Type
- 14.10.6. Sales Channel
- 14.11. Thailand Beverage Fortification Market
- 14.11.1. Country Segmental Analysis
- 14.11.2. Ingredient Type
- 14.11.3. Beverage Type
- 14.11.4. Function
- 14.11.5. Packaging Type
- 14.11.6. Sales Channel
- 14.12. Vietnam Beverage Fortification Market
- 14.12.1. Country Segmental Analysis
- 14.12.2. Ingredient Type
- 14.12.3. Beverage Type
- 14.12.4. Function
- 14.12.5. Packaging Type
- 14.12.6. Sales Channel
- 14.13. Rest of Asia Pacific Beverage Fortification Market
- 14.13.1. Country Segmental Analysis
- 14.13.2. Ingredient Type
- 14.13.3. Beverage Type
- 14.13.4. Function
- 14.13.5. Packaging Type
- 14.13.6. Sales Channel
- 15. Middle East Beverage Fortification Market Analysis
- 15.1. Key Segment Analysis
- 15.2. Regional Snapshot
- 15.3. Middle East Beverage Fortification Market Size (Value - US$ Bn), Analysis, and Forecasts, 2021-2035
- 15.3.1. Ingredient Type
- 15.3.2. Beverage Type
- 15.3.3. Function
- 15.3.4. Packaging Type
- 15.3.5. Sales Channel
- 15.3.6. Country
- 15.3.6.1. Turkey
- 15.3.6.2. UAE
- 15.3.6.3. Saudi Arabia
- 15.3.6.4. Israel
- 15.3.6.5. Rest of Middle East
- 15.4. Turkey Beverage Fortification Market
- 15.4.1. Country Segmental Analysis
- 15.4.2. Ingredient Type
- 15.4.3. Beverage Type
- 15.4.4. Function
- 15.4.5. Packaging Type
- 15.4.6. Sales Channel
- 15.5. UAE Beverage Fortification Market
- 15.5.1. Country Segmental Analysis
- 15.5.2. Ingredient Type
- 15.5.3. Beverage Type
- 15.5.4. Function
- 15.5.5. Packaging Type
- 15.5.6. Sales Channel
- 15.6. Saudi Arabia Beverage Fortification Market
- 15.6.1. Country Segmental Analysis
- 15.6.2. Ingredient Type
- 15.6.3. Beverage Type
- 15.6.4. Function
- 15.6.5. Packaging Type
- 15.6.6. Sales Channel
- 15.7. Israel Beverage Fortification Market
- 15.7.1. Country Segmental Analysis
- 15.7.2. Ingredient Type
- 15.7.3. Beverage Type
- 15.7.4. Function
- 15.7.5. Packaging Type
- 15.7.6. Sales Channel
- 15.8. Rest of Middle East Beverage Fortification Market
- 15.8.1. Country Segmental Analysis
- 15.8.2. Ingredient Type
- 15.8.3. Beverage Type
- 15.8.4. Function
- 15.8.5. Packaging Type
- 15.8.6. Sales Channel
- 16. Africa Beverage Fortification Market Analysis
- 16.1. Key Segment Analysis
- 16.2. Regional Snapshot
- 16.3. Africa Beverage Fortification Market Size (Value - US$ Bn), Analysis, and Forecasts, 2021-2035
- 16.3.1. Ingredient Type
- 16.3.2. Beverage Type
- 16.3.3. Function
- 16.3.4. Packaging Type
- 16.3.5. Sales Channel
- 16.3.6. Country
- 16.3.6.1. South Africa
- 16.3.6.2. Egypt
- 16.3.6.3. Nigeria
- 16.3.6.4. Algeria
- 16.3.6.5. Rest of Africa
- 16.4. South Africa Beverage Fortification Market
- 16.4.1. Country Segmental Analysis
- 16.4.2. Ingredient Type
- 16.4.3. Beverage Type
- 16.4.4. Function
- 16.4.5. Packaging Type
- 16.4.6. Sales Channel
- 16.5. Egypt Beverage Fortification Market
- 16.5.1. Country Segmental Analysis
- 16.5.2. Ingredient Type
- 16.5.3. Beverage Type
- 16.5.4. Function
- 16.5.5. Packaging Type
- 16.5.6. Sales Channel
- 16.6. Nigeria Beverage Fortification Market
- 16.6.1. Country Segmental Analysis
- 16.6.2. Ingredient Type
- 16.6.3. Beverage Type
- 16.6.4. Function
- 16.6.5. Packaging Type
- 16.6.6. Sales Channel
- 16.7. Algeria Beverage Fortification Market
- 16.7.1. Country Segmental Analysis
- 16.7.2. Ingredient Type
- 16.7.3. Beverage Type
- 16.7.4. Function
- 16.7.5. Packaging Type
- 16.7.6. Sales Channel
- 16.8. Rest of Africa Beverage Fortification Market
- 16.8.1. Country Segmental Analysis
- 16.8.2. Ingredient Type
- 16.8.3. Beverage Type
- 16.8.4. Function
- 16.8.5. Packaging Type
- 16.8.6. Sales Channel
- 17. South America Beverage Fortification Market Analysis
- 17.1. Key Segment Analysis
- 17.2. Regional Snapshot
- 17.3. South America Beverage Fortification Market Size (Value - US$ Bn), Analysis, and Forecasts, 2021-2035
- 17.3.1. Ingredient Type
- 17.3.2. Beverage Type
- 17.3.3. Function
- 17.3.4. Packaging Type
- 17.3.5. Sales Channel
- 17.3.6. Country
- 17.3.6.1. Brazil
- 17.3.6.2. Argentina
- 17.3.6.3. Rest of South America
- 17.4. Brazil Beverage Fortification Market
- 17.4.1. Country Segmental Analysis
- 17.4.2. Ingredient Type
- 17.4.3. Beverage Type
- 17.4.4. Function
- 17.4.5. Packaging Type
- 17.4.6. Sales Channel
- 17.5. Argentina Beverage Fortification Market
- 17.5.1. Country Segmental Analysis
- 17.5.2. Ingredient Type
- 17.5.3. Beverage Type
- 17.5.4. Function
- 17.5.5. Packaging Type
- 17.5.6. Sales Channel
- 17.6. Rest of South America Beverage Fortification Market
- 17.6.1. Country Segmental Analysis
- 17.6.2. Ingredient Type
- 17.6.3. Beverage Type
- 17.6.4. Function
- 17.6.5. Packaging Type
- 17.6.6. Sales Channel
- 18. Key Players/ Company Profile
- 18.1. Archer Daniels Midland Company
- 18.1.1. Company Details/ Overview
- 18.1.2. Company Financials
- 18.1.3. Key Customers and Competitors
- 18.1.4. Business/ Industry Portfolio
- 18.1.5. Product Portfolio/ Specification Details
- 18.1.6. Pricing Data
- 18.1.7. Strategic Overview
- 18.1.8. Recent Developments
- 18.2. Balchem Corporation
- 18.3. BASF SE
- 18.4. Cargill, Incorporated
- 18.5. Corbion N.V.
- 18.6. Döhler Group
- 18.7. DSM-Firmenich
- 18.8. Givaudan SA
- 18.9. Glanbia plc
- 18.10. Ingredion Incorporated
- 18.11. Kerry Group plc
- 18.12. Lonza Group AG
- 18.13. Roquette Frères
- 18.14. Tate & Lyle PLC
- 18.15. Other Key Players
- 18.1. Archer Daniels Midland Company
Note* - This is just tentative list of players. While providing the report, we will cover more number of players based on their revenue and share for each geography
Research Design
Our research design integrates both demand-side and supply-side analysis through a balanced combination of primary and secondary research methodologies. By utilizing both bottom-up and top-down approaches alongside rigorous data triangulation methods, we deliver robust market intelligence that supports strategic decision-making.
MarketGenics' comprehensive research design framework ensures the delivery of accurate, reliable, and actionable market intelligence. Through the integration of multiple research approaches, rigorous validation processes, and expert analysis, we provide our clients with the insights needed to make informed strategic decisions and capitalize on market opportunities.
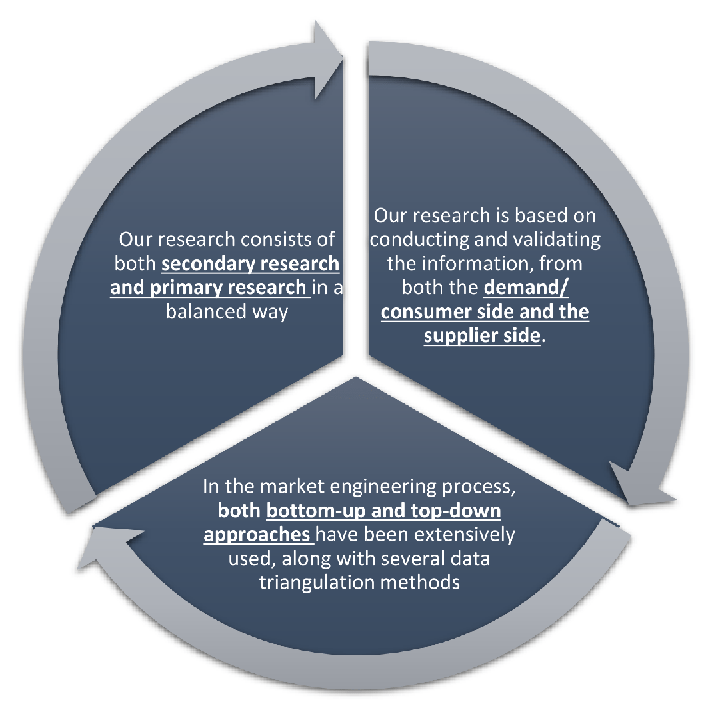
MarketGenics leverages a dedicated industry panel of experts and a comprehensive suite of paid databases to effectively collect, consolidate, and analyze market intelligence.
Our approach has consistently proven to be reliable and effective in generating accurate market insights, identifying key industry trends, and uncovering emerging business opportunities.
Through both primary and secondary research, we capture and analyze critical company-level data such as manufacturing footprints, including technical centers, R&D facilities, sales offices, and headquarters.
Our expert panel further enhances our ability to estimate market size for specific brands based on validated field-level intelligence.
Our data mining techniques incorporate both parametric and non-parametric methods, allowing for structured data collection, sorting, processing, and cleaning.
Demand projections are derived from large-scale data sets analyzed through proprietary algorithms, culminating in robust and reliable market sizing.
Research Approach
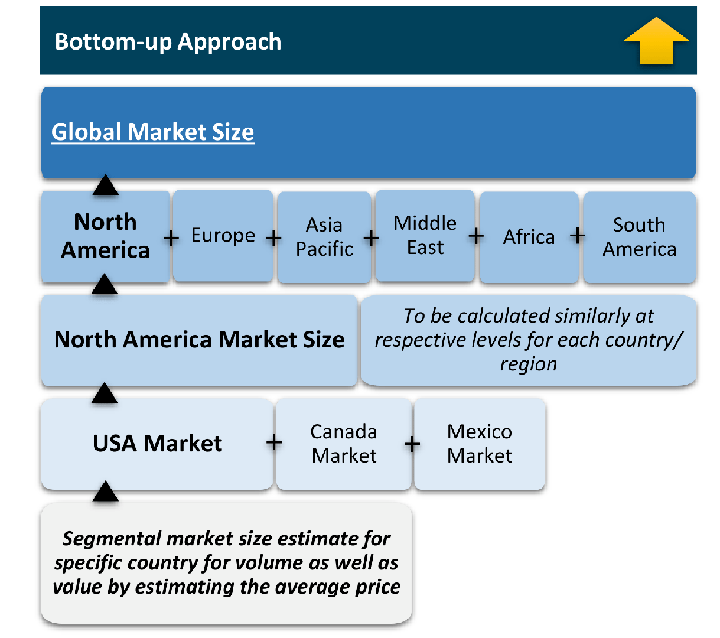
The bottom-up approach builds market estimates by starting with the smallest addressable market units and systematically aggregating them to create comprehensive market size projections.
This method begins with specific, granular data points and builds upward to create the complete market landscape.
Customer Analysis → Segmental Analysis → Geographical Analysis
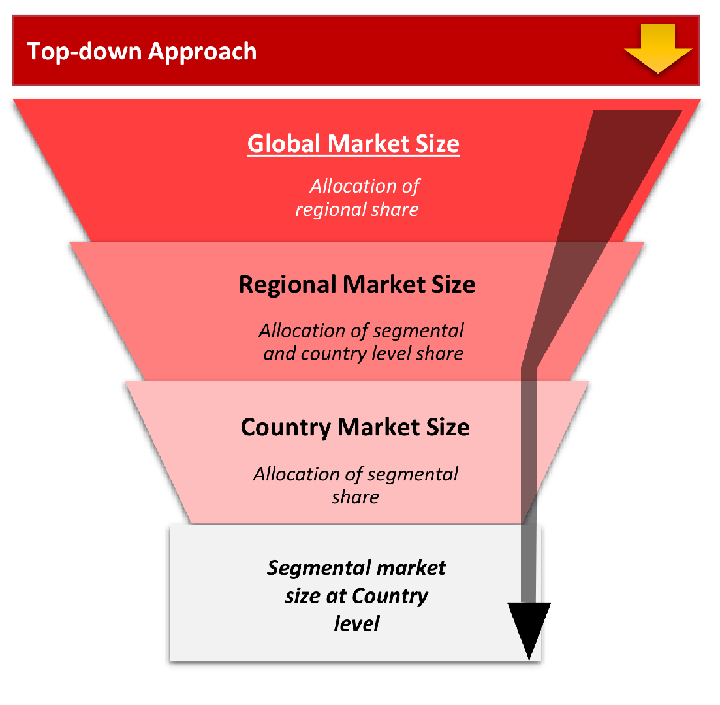
The top-down approach starts with the broadest possible market data and systematically narrows it down through a series of filters and assumptions to arrive at specific market segments or opportunities.
This method begins with the big picture and works downward to increasingly specific market slices.
TAM → SAM → SOM
Research Methods
Desk / Secondary Research
While analysing the market, we extensively study secondary sources, directories, and databases to identify and collect information useful for this technical, market-oriented, and commercial report. Secondary sources that we utilize are not only the public sources, but it is a combination of Open Source, Associations, Paid Databases, MG Repository & Knowledgebase, and others.
- Company websites, annual reports, financial reports, broker reports, and investor presentations
- National government documents, statistical databases and reports
- News articles, press releases and web-casts specific to the companies operating in the market, Magazines, reports, and others
- We gather information from commercial data sources for deriving company specific data such as segmental revenue, share for geography, product revenue, and others
- Internal and external proprietary databases (industry-specific), relevant patent, and regulatory databases
- Governing Bodies, Government Organizations
- Relevant Authorities, Country-specific Associations for Industries
We also employ the model mapping approach to estimate the product level market data through the players' product portfolio
Primary Research
Primary research/ interviews is vital in analyzing the market. Most of the cases involves paid primary interviews. Primary sources include primary interviews through e-mail interactions, telephonic interviews, surveys as well as face-to-face interviews with the different stakeholders across the value chain including several industry experts.
| Type of Respondents | Number of Primaries |
|---|---|
| Tier 2/3 Suppliers | ~20 |
| Tier 1 Suppliers | ~25 |
| End-users | ~25 |
| Industry Expert/ Panel/ Consultant | ~30 |
| Total | ~100 |
MG Knowledgebase
• Repository of industry blog, newsletter and case studies
• Online platform covering detailed market reports, and company profiles
Forecasting Factors and Models
Forecasting Factors
- Historical Trends – Past market patterns, cycles, and major events that shaped how markets behave over time. Understanding past trends helps predict future behavior.
- Industry Factors – Specific characteristics of the industry like structure, regulations, and innovation cycles that affect market dynamics.
- Macroeconomic Factors – Economic conditions like GDP growth, inflation, and employment rates that affect how much money people have to spend.
- Demographic Factors – Population characteristics like age, income, and location that determine who can buy your product.
- Technology Factors – How quickly people adopt new technology and how much technology infrastructure exists.
- Regulatory Factors – Government rules, laws, and policies that can help or restrict market growth.
- Competitive Factors – Analyzing competition structure such as degree of competition and bargaining power of buyers and suppliers.
Forecasting Models / Techniques
Multiple Regression Analysis
- Identify and quantify factors that drive market changes
- Statistical modeling to establish relationships between market drivers and outcomes
Time Series Analysis – Seasonal Patterns
- Understand regular cyclical patterns in market demand
- Advanced statistical techniques to separate trend, seasonal, and irregular components
Time Series Analysis – Trend Analysis
- Identify underlying market growth patterns and momentum
- Statistical analysis of historical data to project future trends
Expert Opinion – Expert Interviews
- Gather deep industry insights and contextual understanding
- In-depth interviews with key industry stakeholders
Multi-Scenario Development
- Prepare for uncertainty by modeling different possible futures
- Creating optimistic, pessimistic, and most likely scenarios
Time Series Analysis – Moving Averages
- Sophisticated forecasting for complex time series data
- Auto-regressive integrated moving average models with seasonal components
Econometric Models
- Apply economic theory to market forecasting
- Sophisticated economic models that account for market interactions
Expert Opinion – Delphi Method
- Harness collective wisdom of industry experts
- Structured, multi-round expert consultation process
Monte Carlo Simulation
- Quantify uncertainty and probability distributions
- Thousands of simulations with varying input parameters
Research Analysis
Our research framework is built upon the fundamental principle of validating market intelligence from both demand and supply perspectives. This dual-sided approach ensures comprehensive market understanding and reduces the risk of single-source bias.
Demand-Side Analysis: We understand end-user/application behavior, preferences, and market needs along with the penetration of the product for specific application.
Supply-Side Analysis: We estimate overall market revenue, analyze the segmental share along with industry capacity, competitive landscape, and market structure.
Validation & Evaluation
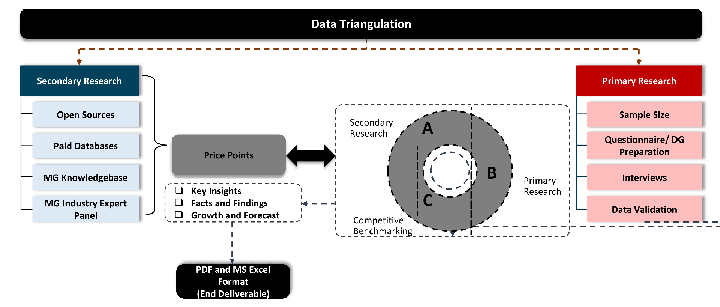
Data triangulation is a validation technique that uses multiple methods, sources, or perspectives to examine the same research question, thereby increasing the credibility and reliability of research findings. In market research, triangulation serves as a quality assurance mechanism that helps identify and minimize bias, validate assumptions, and ensure accuracy in market estimates.
- Data Source Triangulation – Using multiple data sources to examine the same phenomenon
- Methodological Triangulation – Using multiple research methods to study the same research question
- Investigator Triangulation – Using multiple researchers or analysts to examine the same data
- Theoretical Triangulation – Using multiple theoretical perspectives to interpret the same data
Custom Market Research Services
We will customise the research for you, in case the report listed above does not meet your requirements.
Get 10% Free Customisation