Ready-to-Drink (RTD) Beverages Market Size, Share & Trends Analysis Report by Product Type (Alcoholic RTD Beverages, Non-Alcoholic RTD Beverages), Packaging Type, Packaging Size, Formulation, Distribution Channel, Target Consumer Demographics, End-Use Industry and Geography (North America, Europe, Asia Pacific, Middle East, Africa, and South America) – Global Industry Data, Trends, and Forecasts, 2026–2035
|
|
|
Segmental Data Insights |
|
|
Demand Trends |
|
|
Competitive Landscape |
|
|
Strategic Development |
|
|
Future Outlook & Opportunities |
|
Ready-to-Drink (RTD) Beverages Market Size, Share, and Growth
The global ready-to-drink (RTD) beverages market is witnessing strong growth, valued at USD 309.1 billion in 2025 and projected to reach USD 484.6 billion by 2035, expanding at a CAGR of 4.6% during the forecast period. North America is the fastest-growing region for the ready-to-drink (RTD) beverages market due to rising consumer demand for convenient, functional, health-focused beverages and continuous product innovation across premium and low-sugar categories.
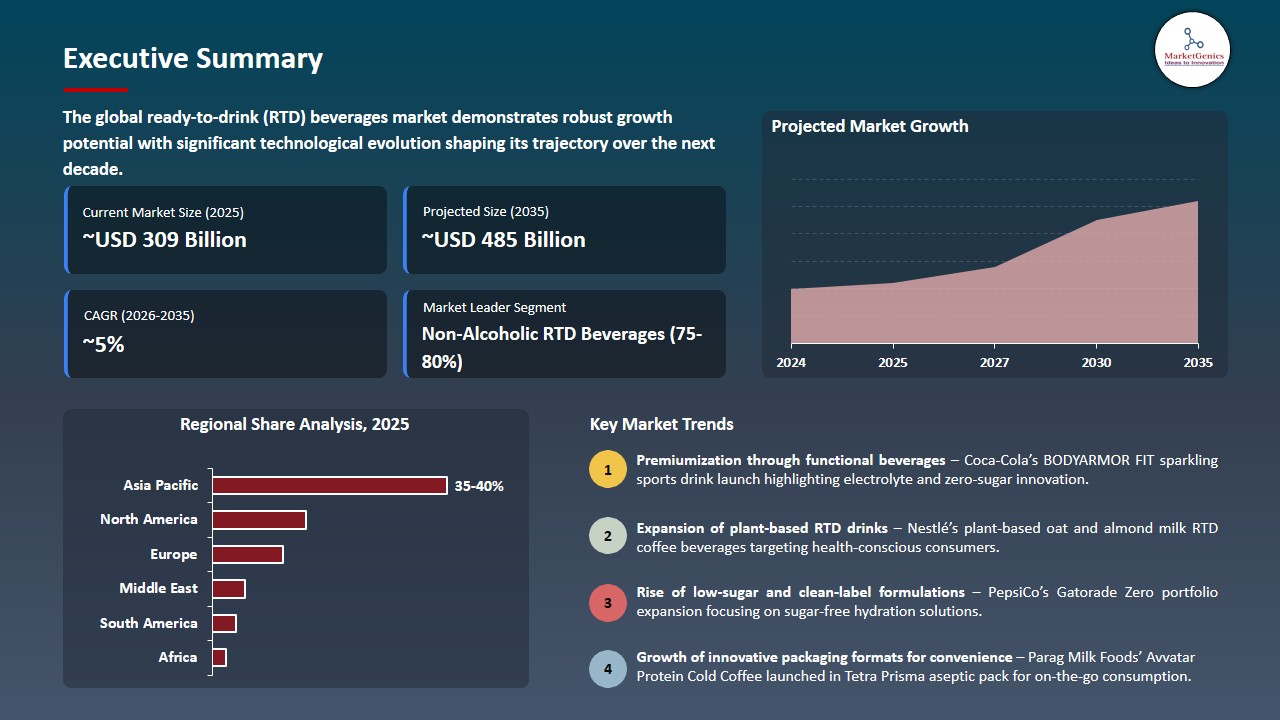
Sara Weaver, VP of Brand Marketing, BODYARMOR, said “BODYARMOR FIT represents a natural evolution of our portfolio as we continue to meet consumers where they are, People are staying active in different ways throughout the day, and BODYARMOR FIT was designed to fit seamlessly into those routines with a new sparkling format that still delivers the functional hydration expected from us”
The ready-to-drink (RTD) beverages market is expanding rapidly as consumers increasingly prefer convenient, on-the-go drinks that combine taste, functionality, and health benefits. Rising demand for low-sugar, high-protein, energy, hydration, and prebiotic beverages is encouraging manufacturers to diversify their portfolios with premium and wellness-oriented offerings. Product innovation, flavor diversification, sustainable packaging, and expanding retail and e-commerce distribution are further strengthening market growth.
PepsiCo reinforced its position in the functional RTD segment by introducing Pepsi Prebiotic Cola, combining traditional cola taste with prebiotic fiber to meet evolving wellness preferences, while The Coca-Cola Company partnered with Bacardi to launch BACARDÍ Mixed with Coca-Cola RTD, expanding its presence in the fast-growing premium ready-to-drink cocktail category through a convenient canned format.
Adjacent opportunities for the ready-to-drink (RTD) beverages market include functional beverages, sports and hydration drinks, plant-based beverages, ready-to-drink coffee and tea, and hard RTD alcoholic beverages, driven by evolving consumer preferences for convenience, health-focused nutrition, premiumization, and on-the-go consumption across diverse beverage categories.
Ready-to-Drink (RTD) Beverages Market Dynamics and Trends
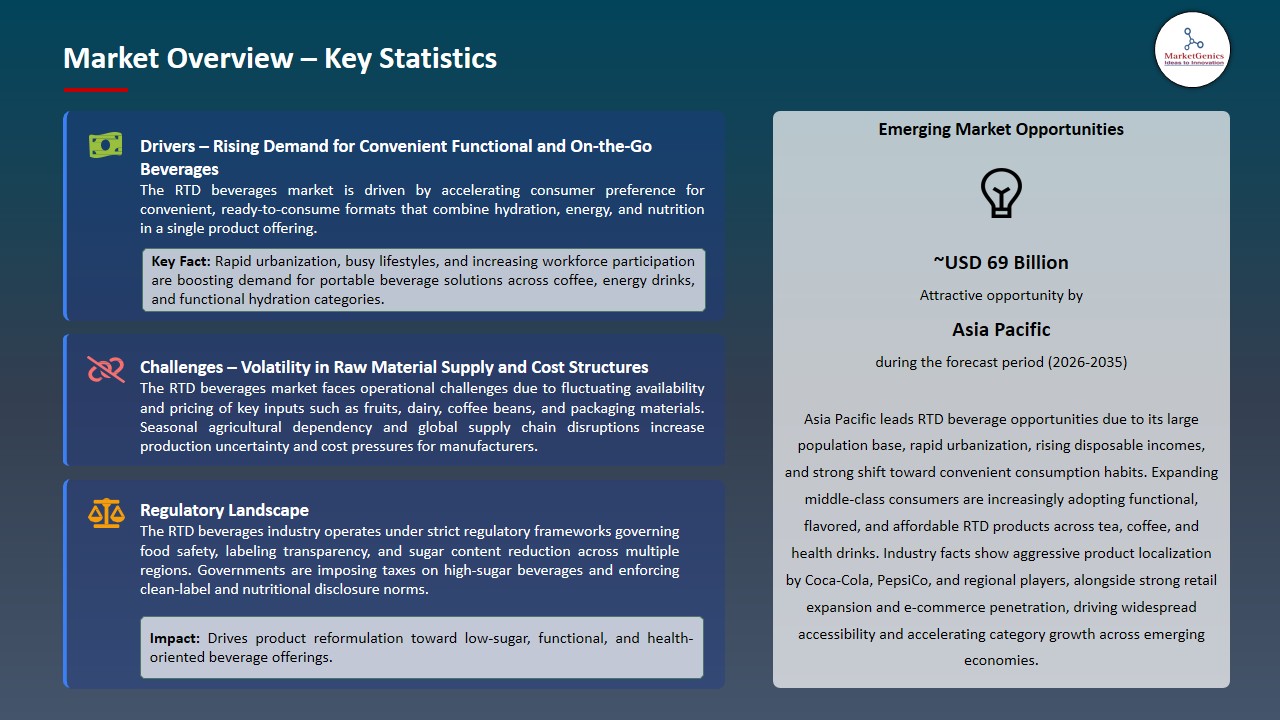
Driver: Rising Demand for Convenient On-the-Go Beverage Consumption
- Consumers are looking for ready-to-drink drinks that are easy to use and can be consumed on the spot, and this demand is rising as today's consumers are more inclined to drink beverages that are ready to use and drinkable on the go. Portable, convenient drink choices are gaining momentum as the preference is driven by urbanization, hectic work schedules and mobile ways of drinking.
- In response to these shifts, manufacturers are introducing new and novel packages, flavors, and functional formulations in RTD products to address the changing needs of consumers in retail, convenience stores, and online.
- Hindustan Unilever Limited introduced its new product, Horlick Milkshake, a ready-to-drink nutrition beverage designed for the Gen-Z age group and infused with 10 key nutrients and 40% less sugar in June 2026.
- The global RTD beverages market is rapidly growing due to the need for on the go consumption, which is driving innovation and market development.
Restraint: Rising Raw Material and Sustainable Packaging Costs Pressuring Product Profitability
- The ready-to-drink (RTD) beverages market is constantly challenged by the volatility of the prices of key raw materials like coffee beans, tea leaves, fruit concentrates, dairy ingredients, sweeteners, and functional additives. The procurement uncertainty and increased manufacturing costs are also driven by supply chain disruptions, and climate-related production impacts.
- Meanwhile, brands are investing in sustainable packaging, light materials and sustainable manufacturing to meet consumer and environmental demand and regulation. These extra costs can squeeze the profit margin, especially in competitive markets where price hikes come at a cost, and are not easily passed on to buyers, thereby stifling product innovation and expansion possibilities.
- Increase in input costs and sustainable packaging costs remain to be the major challenges for profitability and pricing flexibility in the global RTD beverages market.
Opportunity: Premium Functional Hydration and Wellness Beverage Categories Creating New Revenue Streams
- The rising consumer demand for health, fitness and preventive nutrition is providing ample space for premium RTD beverages with added electrolytes, vitamins, probiotics, botanicals, adaptogens and protein. Consumers are willing to pay more for easy-to-drink drinks that provide functional benefits and refreshment.
- The transition is driving manufacturers to further diversify wellness categories and create new product formulations to suit the needs of those with an active lifestyle, targeted nutrition, and clean label, opening up new lines of revenue in both retail and foodservice.
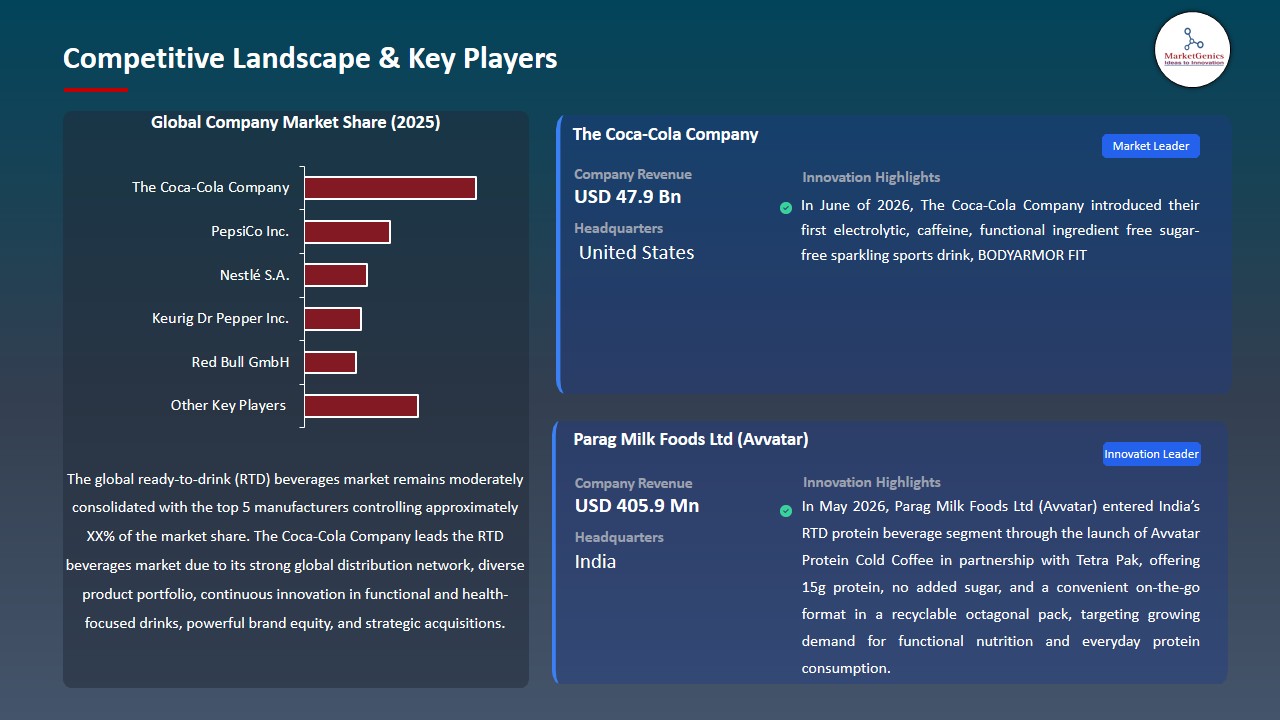
- In June of 2026, The Coca-Cola Company introduced their first electrolytic, caffeine, functional ingredient free sugar-free sparkling sports drink, BODYARMOR FIT.
- The global RTD beverages market is gaining momentum with premium functional hydration and wellness drinks expanding growth prospects and driving value creation.
Key Trend: Integration of Sustainable Materials and Advanced Tire Compounds Transforming Product Development Strategies
- Plant-based drinks are gaining traction in the Ready-to-Drink (RTD) beverages market, as consumers are seeking dairy alternatives to meet their health, sustainability and vegan lifestyles. Oat, almond, soy, coconut and other plant-based drinks are becoming more popular because they are nutritious and eco-friendly.
- Consumers are demanding plant-based RTD options with enhanced flavor, nutritional value, and a clean label, and manufacturers are delivering these products at their plants to reach a larger market and capitalize on changing consumer diets.
- Beyond Meat also made its debut in the RTD beverage category in January 2026 with Beyond Immerse, its plant-based protein-rich drink with fiber, antioxidants and electrolytes.
- Plant-based RTD beverages are gaining traction in the market and offering opportunities for product diversification and new growth opportunities globally.
Ready-to-Drink (RTD) Beverages Market Analysis and Segmental Data
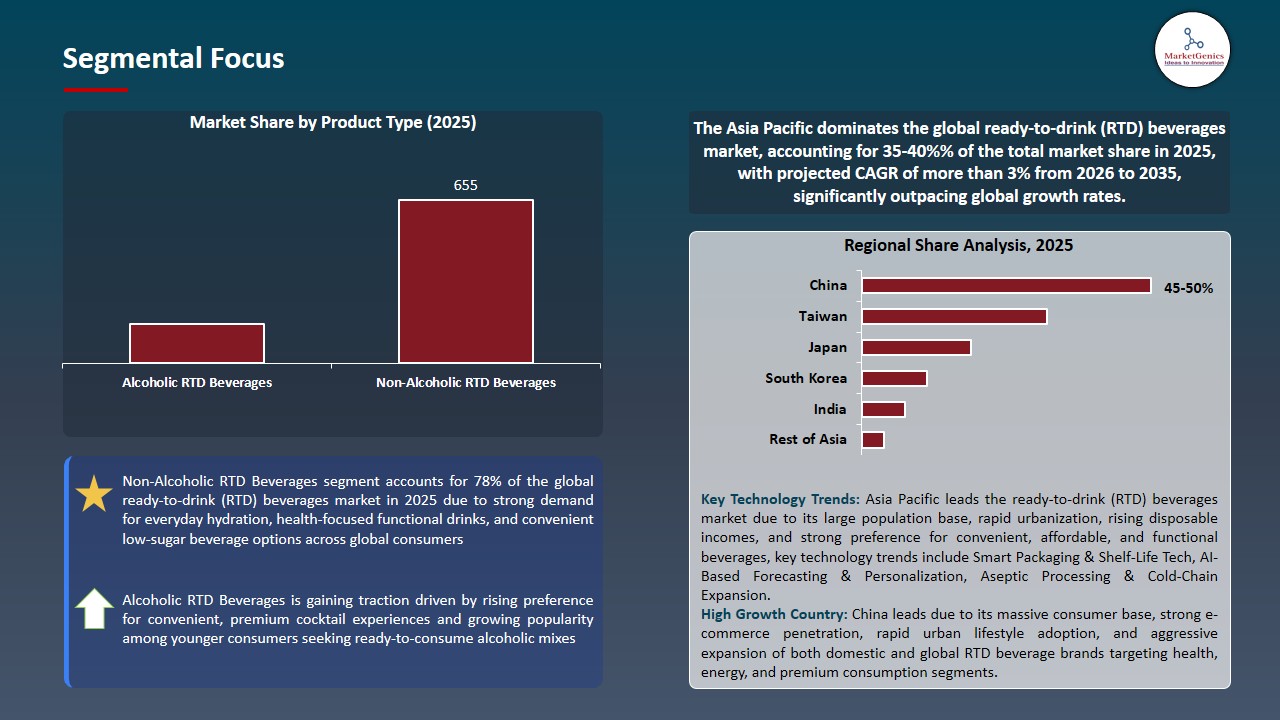
Non-Alcoholic RTD Beverages Dominate Global Ready-to-Drink (RTD) Beverages Market
- The non-alcoholic RTD segment dominates the global market because the beverages are well accepted by consumers, across all age groups, and the demand for health-oriented, convenient refreshment has been rising. Ready to drink teas, coffees, juices, functional drinks, and hydration drinks are all products that have a high frequency of consumption and are widely available in retail outlets.
- Moreover, the segment's leadership is further enhanced with continuous innovation in low-sugar formulations, functional ingredients, premium flavors and sustainable packaging, which are appealing to consumers looking at wellness and convenience.
- PepsiCo continues to grow its non-alcoholic ready-to-drink beverages portfolio, with the increase of distribution of Starbucks ready-to-drink coffee and Frappuccino products in the global market in 2025.
- Global dominance of non-alcoholic RTD beverages is being further reinforced by strong consumer demand and continued product innovation.
Asia Pacific Leads Global Ready-to-Drink (RTD) Beverages Market Demand
- Asia Pacific is the largest market for ready-to-drink (RTD) beverages as the countries are densely populated, have high population growth rate, and high disposable income, which drives the demand for convenience and affordability of beverages. The region is seeing rising product availability and frequency of use thanks to expanding retail networks, rising convenience retail penetration and the rise of ecommerce channels.
- The changing lifestyle of the consumer is boosting the demand for functional, low sugar, and high-end ready to drink drinks like energy drinks and juices as well as teas and coffees. Global and regional players are making a strong pitch for market dominance with robust product localization approach and marketing initiatives. Robust product localization approach and marketing by global and regional players further bolsters market dominance.
- Asia Pacific continues to be a big consumer base, with changing lifestyle trends, therefore leading the global RTD beverages market.
Ready-to-Drink (RTD) Beverages Market Ecosystem
The global ready-to-drink (RTD) Beverages market is consolidated, led by key players such as Coca-Cola Company, PepsiCo, Nestlé, Keurig Dr Pepper, and Red Bull, these companies operate in various segments of the RTD market, such as carbonated soft drinks, bottled water, juices, ready-to-drink coffee and tea, functional beverages and energy drinks, which provide them with good competitive positions. They continue to provide market leadership by consistently innovating new product lines, implementing premiumization strategies, sugar reduction programs and functional and wellness beverages. Their distribution strength, brand loyalty, and strategic retail, foodservice and ecommerce ties further bolster their market lead in developed and emerging markets.
Sourcing is the first step in the value chain, starting with the procurement of the key raw materials ranging from water, fruits, and tea leaves to coffee beans and dairy ingredients, sweeteners, natural flavors, packaging materials, and functional additives. This goes from making the beverage, processing, pasteurizing or carbonating, blending and putting into bottles, cans or cartons. After being processed, finished RTD beverages are subjected to rigorous quality control testing for taste, health, shelf life and nutritional standards before being sold through supermarket, convenience store outlets, vending machines and online channels. Post-sales activities include brand marketing, product innovation feedback loops, recycling initiatives and sustainable packaging management all aimed at increasing lifecycle value and consumer engagement.
High production scalability requirements, rigorous food safety standards, high capital investment in production and packaging lines, and constant innovation in formulation and packaging technology are all key characteristics of the RTD beverages industry. The competition in the market is very strong as incumbent companies have proprietary formulation, advanced manufacturing facilities, global supply chains and long-term relationships with retailers and distributors, resulting in high entry barriers in the global market.
 Recent Development and Strategic Overview:
- In May 2026, Parag Milk Foods Ltd (Avvatar) entered India’s RTD protein beverage segment through the launch of Avvatar Protein Cold Coffee in partnership with Tetra Pak, offering 15g protein, no added sugar, and a convenient on-the-go format in a recyclable octagonal pack, targeting growing demand for functional nutrition and everyday protein consumption.
- In March 2026, Chilco River Holdings Inc. acquired Excuse Mix Inc. to launch the Excuse Mixers ready-to-drink cocktail brand, expanding its beverage alcohol portfolio into the fast-growing RTD segment driven by rising consumer demand for convenient, flavor-forward, premium cocktail experiences and increasing industry investment in RTD beverages.
Report Scope
|
Detail |
|
|
Market Size in 2025 |
USD 309.1 Bn |
|
Market Forecast Value in 2035 |
USD 484.6 Bn |
|
Growth Rate (CAGR) |
4.6% |
|
Forecast Period |
2026 – 2035 |
|
Historical Data Available for |
2021 – 2024 |
|
Market Size Units |
US$ Billion for Value Million Units for Volume |
|
Report Format |
Electronic (PDF) + Excel |
|
North America |
Europe |
Asia Pacific |
Middle East |
Africa |
South America |
|
|
|
|
|
|
|
Companies Covered |
|||||
|
|||||
Ready-to-Drink (RTD) Beverages S Market Segmentation and Highlights
|
Segment |
Sub-segment |
|
Ready-to-Drink (RTD) Beverages Market, By Product Type |
|
|
Ready-to-Drink (RTD) Beverages Market, By Packaging Type |
|
|
Ready-to-Drink (RTD) Beverages Market, By Packaging Size |
|
|
Ready-to-Drink (RTD) Beverages Market, By Formulation |
|
|
Ready-to-Drink (RTD) Beverages Market, By Distribution Channel |
|
|
Ready-to-Drink (RTD) Beverages Market, By Target Consumer Demographics |
|
|
Ready-to-Drink (RTD) Beverages Market, By End-Use Industry |
|
Frequently Asked Questions
Table of Contents
- 1. Research Methodology and Assumptions
- 1.1. Definitions
- 1.2. Research Design and Approach
- 1.3. Data Collection Methods
- 1.4. Base Estimates and Calculations
- 1.5. Forecasting Models
- 1.5.1. Key Forecast Factors & Impact Analysis
- 1.6. Secondary Research
- 1.6.1. Open Sources
- 1.6.2. Paid Databases
- 1.6.3. Associations
- 1.7. Primary Research
- 1.7.1. Primary Sources
- 1.7.2. Primary Interviews with Stakeholders across Ecosystem
- 2. Executive Summary
- 2.1. Global Ready-to-Drink (RTD) Beverages Market Outlook
- 2.1.1. Ready-to-Drink (RTD) Beverages Market Size Volume (Million Units) and Value (US$ Bn), and Forecasts, 2021-2035
- 2.1.2. Compounded Annual Growth Rate Analysis
- 2.1.3. Growth Opportunity Analysis
- 2.1.4. Segmental Share Analysis
- 2.1.5. Geographical Share Analysis
- 2.2. Market Analysis and Facts
- 2.3. Supply-Demand Analysis
- 2.4. Competitive Benchmarking
- 2.5. Go-to- Market Strategy
- 2.5.1. Customer/ End-use Industry Assessment
- 2.5.2. Growth Opportunity Data, 2026-2035
- 2.5.2.1. Regional Data
- 2.5.2.2. Country Data
- 2.5.2.3. Segmental Data
- 2.5.3. Identification of Potential Market Spaces
- 2.5.4. GAP Analysis
- 2.5.5. Potential Attractive Price Points
- 2.5.6. Prevailing Market Risks & Challenges
- 2.5.7. Preferred Sales & Marketing Strategies
- 2.5.8. Key Recommendations and Analysis
- 2.5.9. A Way Forward
- 2.1. Global Ready-to-Drink (RTD) Beverages Market Outlook
- 3. Industry Data and Premium Insights
- 3.1. Global Food & Beverages Industry Overview, 2025
- 3.1.1. Food & Beverages Ecosystem Analysis
- 3.1.2. Key Trends for Food & Beverages Industry
- 3.1.3. Regional Distribution for Food & Beverages Industry
- 3.2. Supplier Customer Data
- 3.3. Technology Roadmap and Developments
- 3.4. Trade Analysis
- 3.4.1. Import & Export Analysis, 2025
- 3.4.2. Top Importing Countries
- 3.4.3. Top Exporting Countries
- 3.5. Trump Tariff Impact Analysis
- 3.5.1. Manufacturer
- 3.5.1.1. Based on the component & Raw material
- 3.5.2. Supply Chain
- 3.5.3. End Consumer
- 3.5.1. Manufacturer
- 3.6. Raw Material Analysis
- 3.1. Global Food & Beverages Industry Overview, 2025
- 4. Market Overview
- 4.1. Market Dynamics
- 4.1.1. Drivers
- 4.1.1.1. Rising demand for convenient on-the-go beverage consumption
- 4.1.1.2. Increasing health consciousness driving functional and low-sugar RTD products
- 4.1.1.3. Expansion of premiumization and innovative flavor offerings
- 4.1.2. Restraints
- 4.1.2.1. High raw material and packaging cost volatility impacting margins
- 4.1.2.2. Strict regulatory standards and labeling compliance requirements
- 4.1.1. Drivers
- 4.2. Key Trend Analysis
- 4.3. Regulatory Framework
- 4.3.1. Key Regulations, Norms, and Subsidies, by Key Countries
- 4.3.2. Tariffs and Standards
- 4.3.3. Impact Analysis of Regulations on the Market
- 4.4. Value Chain Analysis
- 4.4.1. Raw Material Suppliers
- 4.4.2. RTD Beverage Producers
- 4.4.3. Dealers & Distribution Providers
- 4.4.4. End Users
- 4.5. Cost Structure Analysis
- 4.5.1. Parameter’s Share for Cost Associated
- 4.5.2. COGP vs COGS
- 4.5.3. Profit Margin Analysis
- 4.6. Pricing Analysis
- 4.6.1. Regional Pricing Analysis
- 4.6.2. Segmental Pricing Trends
- 4.6.3. Factors Influencing Pricing
- 4.7. Porter’s Five Forces Analysis
- 4.8. PESTEL Analysis
- 4.9. Global Ready-to-Drink (RTD) Beverages Market Demand
- 4.9.1. Historical Market Size – Volume (Million Units) and Value (US$ Bn), 2020-2024
- 4.9.2. Current and Future Market Size – Volume (Million Units) and Value (US$ Bn), 2026–2035
- 4.9.2.1. Y-o-Y Growth Trends
- 4.9.2.2. Absolute $ Opportunity Assessment
- 4.1. Market Dynamics
- 5. Competition Landscape
- 5.1. Competition structure
- 5.1.1. Fragmented v/s consolidated
- 5.2. Company Share Analysis, 2025
- 5.2.1. Global Company Market Share
- 5.2.2. By Region
- 5.2.2.1. North America
- 5.2.2.2. Europe
- 5.2.2.3. Asia Pacific
- 5.2.2.4. Middle East
- 5.2.2.5. Africa
- 5.2.2.6. South America
- 5.3. Product Comparison Matrix
- 5.3.1. Specifications
- 5.3.2. Market Positioning
- 5.3.3. Pricing
- 5.1. Competition structure
- 6. Global Ready-to-Drink (RTD) Beverages Market Analysis, by Product Type
- 6.1. Key Segment Analysis
- 6.2. Ready-to-Drink (RTD) Beverages Market Size Volume (Million Units) and Value (US$ Bn), Analysis, and Forecasts, by Product Type, 2021-2035
- 6.2.1. Alcoholic RTD Beverages
- 6.2.1.1. Hard Seltzers
- 6.2.1.2. Ready-to-Drink Cocktails
- 6.2.1.3. Hard Kombucha
- 6.2.1.4. Flavored Malt Beverages (FMBs)
- 6.2.1.5. RTD Wine
- 6.2.1.6. RTD Spirits-Based Drinks
- 6.2.1.7. Hard Ciders
- 6.2.1.8. Others
- 6.2.2. Non-Alcoholic RTD Beverages
- 6.2.2.1. RTD Coffee
- 6.2.2.2. RTD Tea
- 6.2.2.3. Carbonated Soft Drinks (CSDs)
- 6.2.2.4. Energy Drinks
- 6.2.2.5. Sports & Electrolyte Drinks
- 6.2.2.6. Juices & Juice-Based Drinks
- 6.2.2.7. Dairy & Plant-Based RTD Beverages
- 6.2.2.8. Functional & Wellness Drinks
- 6.2.2.9. Water & Enhanced Water
- 6.2.2.10. Others
- 6.2.1. Alcoholic RTD Beverages
- 7. Global Ready-to-Drink (RTD) Beverages Market Analysis, by Packaging Type
- 7.1. Key Segment Analysis
- 7.2. Ready-to-Drink (RTD) Beverages Market Size Volume (Million Units) and Value (US$ Bn), Analysis, and Forecasts, by Packaging Type, 2021-2035
- 7.2.1. Cans
- 7.2.2. Bottles
- 7.2.3. Cartons & Pouches
- 7.2.4. Bag-in-Box
- 7.2.5. Kegs & Draught Formats
- 8. Global Ready-to-Drink (RTD) Beverages Market Analysis, by Packaging Size
- 8.1. Key Segment Analysis
- 8.2. Ready-to-Drink (RTD) Beverages Market Size Volume (Million Units) and Value (US$ Bn), Analysis, and Forecasts, by Packaging Size, 2021-2035
- 8.2.1. Below 200 ml
- 8.2.2. 200 ml – 350 ml
- 8.2.3. 351 ml – 500 ml
- 8.2.4. 501 ml – 1,000 ml
- 8.2.5. Above 1,000 ml
- 9. Global Ready-to-Drink (RTD) Beverages Market Analysis, by Formulation
- 9.1. Key Segment Analysis
- 9.2. Ready-to-Drink (RTD) Beverages Market Size Volume (Million Units) and Value (US$ Bn), Analysis, and Forecasts, Formulation, 2021-2035
- 9.2.1. Standard
- 9.2.1.1. Functional/Fortified
- 9.2.1.2. High Protein
- 9.2.1.3. High Fiber
- 9.2.1.4. Immunity Boosting
- 9.2.1.5. Anti-Inflammatory
- 9.2.1.6. Sleep & Relaxation
- 9.2.1.7. Others
- 9.2.2. Organic & Natural
- 9.2.3. Vegan & Plant-Based Certified
- 9.2.4. Keto & Low-Carb
- 9.2.5. Gluten-Free
- 9.2.6. Others
- 9.2.1. Standard
- 10. Global Ready-to-Drink (RTD) Beverages Market Analysis, by Distribution Channel
- 10.1. Key Segment Analysis
- 10.2. Ready-to-Drink (RTD) Beverages Market Size Volume (Million Units) and Value (US$ Bn), Analysis, and Forecasts, by Distribution Channel, 2021-2035
- 10.2.1. Off-Trade (Retail)
- 10.2.1.1. Supermarkets & Hypermarkets
- 10.2.1.2. Online Retail & Direct-to-Consumer (DTC)
- 10.2.1.3. Drug Stores & Pharmacies
- 10.2.1.4. Convenience Stores
- 10.2.1.5. Others
- 10.2.2. On-Trade (Out-of-Home)
- 10.2.2.1. Bars, Pubs & Nightclubs
- 10.2.2.2. Restaurants & Quick Service Restaurants (QSR)
- 10.2.2.3. Cafés & Coffee Chains
- 10.2.2.4. Resorts & Hospitality Venues
- 10.2.2.5. Stadiums & Entertainment Venues
- 10.2.2.6. Airlines & Travel Retail
- 10.2.2.7. Vending Machines
- 10.2.2.8. Others
- 10.2.1. Off-Trade (Retail)
- 11. Global Ready-to-Drink (RTD) Beverages Market Analysis and Forecasts, by Target Consumer Demographics
- 11.1. Key Findings
- 11.2. Ready-to-Drink (RTD) Beverages Market Size Volume (Million Units) and Value (US$ Bn), Analysis, and Forecasts, by Target Consumer Demographics, 2021-2035
- 11.2.1. By Age Group
- 11.2.1.1. Children (Below 12 years)
- 11.2.1.2. Teenagers & Gen Z (13–24 years)
- 11.2.1.3. Millennials (25–40 years)
- 11.2.1.4. Gen X (41–56 years)
- 11.2.1.5. Baby Boomers & Seniors (57+ years)
- 11.2.2. By Gender
- 11.2.2.1. Male-Oriented Products
- 11.2.2.2. Female-Oriented Products
- 11.2.1. By Age Group
- 12. Global Ready-to-Drink (RTD) Beverages Market Analysis and Forecasts, by End-Use Industry
- 12.1. Key Findings
- 12.2. Ready-to-Drink (RTD) Beverages Market Size Volume (Million Units) and Value (US$ Bn), Analysis, and Forecasts, by End-Use Industry, 2021-2035
- 12.2.1. Food & Beverage
- 12.2.2. Sports, Fitness & Recreation
- 12.2.3. Healthcare & Nutraceuticals
- 12.2.4. Hospitality & Travel
- 12.2.5. Retail & E-Commerce
- 12.2.6. Entertainment, Media & Live Events
- 12.2.7. Corporate & Workplace
- 12.2.8. Others
- 13. Global Ready-to-Drink (RTD) Beverages Market Analysis and Forecasts, by Region
- 13.1. Key Findings
- 13.2. Ready-to-Drink (RTD) Beverages Market Size Volume (Million Units) and Value (US$ Bn), Analysis, and Forecasts, by Region, 2021-2035
- 13.2.1. North America
- 13.2.2. Europe
- 13.2.3. Asia Pacific
- 13.2.4. Middle East
- 13.2.5. Africa
- 13.2.6. South America
- 14. North America Ready-to-Drink (RTD) Beverages Market Analysis
- 14.1. Key Segment Analysis
- 14.2. Regional Snapshot
- 14.3. North America Ready-to-Drink (RTD) Beverages Market Size Volume (Million Units) and Value (US$ Bn), Analysis, and Forecasts, 2021-2035
- 14.3.1. Product Type
- 14.3.2. Packaging Size
- 14.3.3. Formulation
- 14.3.4. Distribution Channel
- 14.3.5. Target Consumer Demographics
- 14.3.6. End-Use Industry
- 14.3.7. Country
- 14.3.7.1. USA
- 14.3.7.2. Canada
- 14.3.7.3. Mexico
- 14.4. USA Ready-to-Drink (RTD) Beverages Market
- 14.4.1. Country Segmental Analysis
- 14.4.2. Product Type
- 14.4.3. Packaging Size
- 14.4.4. Formulation
- 14.4.5. Distribution Channel
- 14.4.6. Target Consumer Demographics
- 14.4.7. End-Use Industry
- 14.5. Canada Ready-to-Drink (RTD) Beverages Market
- 14.5.1. Country Segmental Analysis
- 14.5.2. Product Type
- 14.5.3. Packaging Size
- 14.5.4. Formulation
- 14.5.5. Distribution Channel
- 14.5.6. Target Consumer Demographics
- 14.5.7. End-Use Industry
- 14.6. Mexico Ready-to-Drink (RTD) Beverages Market
- 14.6.1. Country Segmental Analysis
- 14.6.2. Product Type
- 14.6.3. Packaging Size
- 14.6.4. Formulation
- 14.6.5. Distribution Channel
- 14.6.6. Target Consumer Demographics
- 14.6.7. End-Use Industry
- 15. Europe Ready-to-Drink (RTD) Beverages Market Analysis
- 15.1. Key Segment Analysis
- 15.2. Regional Snapshot
- 15.3. Europe Ready-to-Drink (RTD) Beverages Market Size Volume (Million Units) and Value (US$ Bn), Analysis, and Forecasts, 2021-2035
- 15.3.1. Product Type
- 15.3.2. Packaging Size
- 15.3.3. Formulation
- 15.3.4. Distribution Channel
- 15.3.5. Target Consumer Demographics
- 15.3.6. End-Use Industry
- 15.3.7. Country
- 15.3.7.1. Germany
- 15.3.7.2. United Kingdom
- 15.3.7.3. France
- 15.3.7.4. Italy
- 15.3.7.5. Spain
- 15.3.7.6. Netherlands
- 15.3.7.7. Nordic Countries
- 15.3.7.8. Poland
- 15.3.7.9. Russia & CIS
- 15.3.7.10. Rest of Europe
- 15.4. Germany Ready-to-Drink (RTD) Beverages Market
- 15.4.1. Country Segmental Analysis
- 15.4.2. Product Type
- 15.4.3. Packaging Size
- 15.4.4. Formulation
- 15.4.5. Distribution Channel
- 15.4.6. Target Consumer Demographics
- 15.4.7. End-Use Industry
- 15.5. United Kingdom Ready-to-Drink (RTD) Beverages Market
- 15.5.1. Country Segmental Analysis
- 15.5.2. Product Type
- 15.5.3. Packaging Size
- 15.5.4. Formulation
- 15.5.5. Distribution Channel
- 15.5.6. Target Consumer Demographics
- 15.5.7. End-Use Industry
- 15.6. France Ready-to-Drink (RTD) Beverages Market
- 15.6.1. Country Segmental Analysis
- 15.6.2. Product Type
- 15.6.3. Packaging Size
- 15.6.4. Formulation
- 15.6.5. Distribution Channel
- 15.6.6. Target Consumer Demographics
- 15.6.7. End-Use Industry
- 15.7. Italy Ready-to-Drink (RTD) Beverages Market
- 15.7.1. Country Segmental Analysis
- 15.7.2. Product Type
- 15.7.3. Packaging Size
- 15.7.4. Formulation
- 15.7.5. Distribution Channel
- 15.7.6. Target Consumer Demographics
- 15.7.7. End-Use Industry
- 15.8. Spain Ready-to-Drink (RTD) Beverages Market
- 15.8.1. Country Segmental Analysis
- 15.8.2. Product Type
- 15.8.3. Packaging Size
- 15.8.4. Formulation
- 15.8.5. Distribution Channel
- 15.8.6. Target Consumer Demographics
- 15.8.7. End-Use Industry
- 15.9. Netherlands Ready-to-Drink (RTD) Beverages Market
- 15.9.1. Country Segmental Analysis
- 15.9.2. Product Type
- 15.9.3. Packaging Size
- 15.9.4. Formulation
- 15.9.5. Distribution Channel
- 15.9.6. Target Consumer Demographics
- 15.9.7. End-Use Industry
- 15.10. Nordic Countries Ready-to-Drink (RTD) Beverages Market
- 15.10.1. Country Segmental Analysis
- 15.10.2. Product Type
- 15.10.3. Packaging Size
- 15.10.4. Formulation
- 15.10.5. Distribution Channel
- 15.10.6. Target Consumer Demographics
- 15.10.7. End-Use Industry
- 15.11. Poland Ready-to-Drink (RTD) Beverages Market
- 15.11.1. Country Segmental Analysis
- 15.11.2. Product Type
- 15.11.3. Packaging Size
- 15.11.4. Formulation
- 15.11.5. Distribution Channel
- 15.11.6. Target Consumer Demographics
- 15.11.7. End-Use Industry
- 15.12. Russia & CIS Ready-to-Drink (RTD) Beverages Market
- 15.12.1. Country Segmental Analysis
- 15.12.2. Product Type
- 15.12.3. Packaging Size
- 15.12.4. Formulation
- 15.12.5. Distribution Channel
- 15.12.6. Target Consumer Demographics
- 15.12.7. End-Use Industry
- 15.13. Rest of Europe Ready-to-Drink (RTD) Beverages Market
- 15.13.1. Country Segmental Analysis
- 15.13.2. Product Type
- 15.13.3. Packaging Size
- 15.13.4. Formulation
- 15.13.5. Distribution Channel
- 15.13.6. Target Consumer Demographics
- 15.13.7. End-Use Industry
- 16. Asia Pacific Ready-to-Drink (RTD) Beverages Market Analysis
- 16.1. Key Segment Analysis
- 16.2. Regional Snapshot
- 16.3. Asia Pacific Ready-to-Drink (RTD) Beverages Market Size Volume (Million Units) and Value (US$ Bn), Analysis, and Forecasts, 2021-2035
- 16.3.1. Product Type
- 16.3.2. Packaging Size
- 16.3.3. Formulation
- 16.3.4. Distribution Channel
- 16.3.5. Target Consumer Demographics
- 16.3.6. End-Use Industry
- 16.3.7. Country
- 16.3.7.1. China
- 16.3.7.2. India
- 16.3.7.3. Japan
- 16.3.7.4. South Korea
- 16.3.7.5. Australia and New Zealand
- 16.3.7.6. Indonesia
- 16.3.7.7. Malaysia
- 16.3.7.8. Thailand
- 16.3.7.9. Vietnam
- 16.3.7.10. Rest of Asia Pacific
- 16.4. China Ready-to-Drink (RTD) Beverages Market
- 16.4.1. Country Segmental Analysis
- 16.4.2. Product Type
- 16.4.3. Packaging Size
- 16.4.4. Formulation
- 16.4.5. Distribution Channel
- 16.4.6. Target Consumer Demographics
- 16.4.7. End-Use Industry
- 16.5. India Ready-to-Drink (RTD) Beverages Market
- 16.5.1. Country Segmental Analysis
- 16.5.2. Product Type
- 16.5.3. Packaging Size
- 16.5.4. Formulation
- 16.5.5. Distribution Channel
- 16.5.6. Target Consumer Demographics
- 16.5.7. End-Use Industry
- 16.6. Japan Ready-to-Drink (RTD) Beverages Market
- 16.6.1. Country Segmental Analysis
- 16.6.2. Product Type
- 16.6.3. Packaging Size
- 16.6.4. Formulation
- 16.6.5. Distribution Channel
- 16.6.6. Target Consumer Demographics
- 16.6.7. End-Use Industry
- 16.7. South Korea Ready-to-Drink (RTD) Beverages Market
- 16.7.1. Country Segmental Analysis
- 16.7.2. Product Type
- 16.7.3. Packaging Size
- 16.7.4. Formulation
- 16.7.5. Distribution Channel
- 16.7.6. Target Consumer Demographics
- 16.7.7. End-Use Industry
- 16.8. Australia and New Zealand Ready-to-Drink (RTD) Beverages Market
- 16.8.1. Country Segmental Analysis
- 16.8.2. Product Type
- 16.8.3. Packaging Size
- 16.8.4. Formulation
- 16.8.5. Distribution Channel
- 16.8.6. Target Consumer Demographics
- 16.8.7. End-Use Industry
- 16.9. Indonesia Ready-to-Drink (RTD) Beverages Market
- 16.9.1. Country Segmental Analysis
- 16.9.2. Product Type
- 16.9.3. Packaging Size
- 16.9.4. Formulation
- 16.9.5. Distribution Channel
- 16.9.6. Target Consumer Demographics
- 16.9.7. End-Use Industry
- 16.10. Malaysia Ready-to-Drink (RTD) Beverages Market
- 16.10.1. Country Segmental Analysis
- 16.10.2. Product Type
- 16.10.3. Packaging Size
- 16.10.4. Formulation
- 16.10.5. Distribution Channel
- 16.10.6. Target Consumer Demographics
- 16.10.7. End-Use Industry
- 16.11. Thailand Ready-to-Drink (RTD) Beverages Market
- 16.11.1. Country Segmental Analysis
- 16.11.2. Product Type
- 16.11.3. Packaging Size
- 16.11.4. Formulation
- 16.11.5. Distribution Channel
- 16.11.6. Target Consumer Demographics
- 16.11.7. End-Use Industry
- 16.12. Vietnam Ready-to-Drink (RTD) Beverages Market
- 16.12.1. Country Segmental Analysis
- 16.12.2. Product Type
- 16.12.3. Packaging Size
- 16.12.4. Formulation
- 16.12.5. Distribution Channel
- 16.12.6. Target Consumer Demographics
- 16.12.7. End-Use Industry
- 16.13. Rest of Asia Pacific Ready-to-Drink (RTD) Beverages Market
- 16.13.1. Country Segmental Analysis
- 16.13.2. Product Type
- 16.13.3. Packaging Size
- 16.13.4. Formulation
- 16.13.5. Distribution Channel
- 16.13.6. Target Consumer Demographics
- 16.13.7. End-Use Industry
- 17. Middle East Ready-to-Drink (RTD) Beverages Market Analysis
- 17.1. Key Segment Analysis
- 17.2. Regional Snapshot
- 17.3. Middle East Ready-to-Drink (RTD) Beverages Market Size Volume (Million Units) and Value (US$ Bn), Analysis, and Forecasts, 2021-2035
- 17.3.1. Product Type
- 17.3.2. Packaging Size
- 17.3.3. Formulation
- 17.3.4. Distribution Channel
- 17.3.5. Target Consumer Demographics
- 17.3.6. End-Use Industry
- 17.3.7. Country
- 17.3.7.1. Turkey
- 17.3.7.2. UAE
- 17.3.7.3. Saudi Arabia
- 17.3.7.4. Israel
- 17.3.7.5. Rest of Middle East
- 17.4. Turkey Ready-to-Drink (RTD) Beverages Market
- 17.4.1. Country Segmental Analysis
- 17.4.2. Product Type
- 17.4.3. Packaging Size
- 17.4.4. Formulation
- 17.4.5. Distribution Channel
- 17.4.6. Target Consumer Demographics
- 17.4.7. End-Use Industry
- 17.5. UAE Ready-to-Drink (RTD) Beverages Market
- 17.5.1. Country Segmental Analysis
- 17.5.2. Product Type
- 17.5.3. Packaging Size
- 17.5.4. Formulation
- 17.5.5. Distribution Channel
- 17.5.6. Target Consumer Demographics
- 17.5.7. End-Use Industry
- 17.6. Saudi Arabia Ready-to-Drink (RTD) Beverages Market
- 17.6.1. Country Segmental Analysis
- 17.6.2. Product Type
- 17.6.3. Packaging Size
- 17.6.4. Formulation
- 17.6.5. Distribution Channel
- 17.6.6. Target Consumer Demographics
- 17.6.7. End-Use Industry
- 17.7. Israel Ready-to-Drink (RTD) Beverages Market
- 17.7.1. Country Segmental Analysis
- 17.7.2. Product Type
- 17.7.3. Packaging Size
- 17.7.4. Formulation
- 17.7.5. Distribution Channel
- 17.7.6. Target Consumer Demographics
- 17.7.7. End-Use Industry
- 17.8. Rest of Middle East Ready-to-Drink (RTD) Beverages Market
- 17.8.1. Country Segmental Analysis
- 17.8.2. Product Type
- 17.8.3. Packaging Size
- 17.8.4. Formulation
- 17.8.5. Distribution Channel
- 17.8.6. Target Consumer Demographics
- 17.8.7. End-Use Industry
- 18. Africa Ready-to-Drink (RTD) Beverages Market Analysis
- 18.1. Key Segment Analysis
- 18.2. Regional Snapshot
- 18.3. Africa Ready-to-Drink (RTD) Beverages Market Size Volume (Million Units) and Value (US$ Bn), Analysis, and Forecasts, 2021-2035
- 18.3.1. Product Type
- 18.3.2. Packaging Size
- 18.3.3. Formulation
- 18.3.4. Distribution Channel
- 18.3.5. Target Consumer Demographics
- 18.3.6. End-Use Industry
- 18.3.7. Country
- 18.3.7.1. South Africa
- 18.3.7.2. Egypt
- 18.3.7.3. Nigeria
- 18.3.7.4. Algeria
- 18.3.7.5. Rest of Africa
- 18.4. South Africa Ready-to-Drink (RTD) Beverages Market
- 18.4.1. Country Segmental Analysis
- 18.4.2. Product Type
- 18.4.3. Packaging Size
- 18.4.4. Formulation
- 18.4.5. Distribution Channel
- 18.4.6. Target Consumer Demographics
- 18.4.7. End-Use Industry
- 18.5. Egypt Ready-to-Drink (RTD) Beverages Market
- 18.5.1. Country Segmental Analysis
- 18.5.2. Product Type
- 18.5.3. Packaging Size
- 18.5.4. Formulation
- 18.5.5. Distribution Channel
- 18.5.6. Target Consumer Demographics
- 18.5.7. End-Use Industry
- 18.6. Nigeria Ready-to-Drink (RTD) Beverages Market
- 18.6.1. Country Segmental Analysis
- 18.6.2. Product Type
- 18.6.3. Packaging Size
- 18.6.4. Formulation
- 18.6.5. Distribution Channel
- 18.6.6. Target Consumer Demographics
- 18.6.7. End-Use Industry
- 18.7. Algeria Ready-to-Drink (RTD) Beverages Market
- 18.7.1. Country Segmental Analysis
- 18.7.2. Product Type
- 18.7.3. Packaging Size
- 18.7.4. Formulation
- 18.7.5. Distribution Channel
- 18.7.6. Target Consumer Demographics
- 18.7.7. End-Use Industry
- 18.8. Rest of Africa Ready-to-Drink (RTD) Beverages Market
- 18.8.1. Country Segmental Analysis
- 18.8.2. Product Type
- 18.8.3. Packaging Size
- 18.8.4. Formulation
- 18.8.5. Distribution Channel
- 18.8.6. Target Consumer Demographics
- 18.8.7. End-Use Industry
- 19. South America Ready-to-Drink (RTD) Beverages Market Analysis
- 19.1. Key Segment Analysis
- 19.2. Regional Snapshot
- 19.3. South America Ready-to-Drink (RTD) Beverages Market Size Volume (Million Units) and Value (US$ Bn), Analysis, and Forecasts, 2021-2035
- 19.3.1. Product Type
- 19.3.2. Packaging Size
- 19.3.3. Formulation
- 19.3.4. Distribution Channel
- 19.3.5. Target Consumer Demographics
- 19.3.6. End-Use Industry
- 19.3.7. Country
- 19.3.7.1. Brazil
- 19.3.7.2. Argentina
- 19.3.7.3. Rest of South America
- 19.4. Brazil Ready-to-Drink (RTD) Beverages Market
- 19.4.1. Country Segmental Analysis
- 19.4.2. Product Type
- 19.4.3. Packaging Size
- 19.4.4. Formulation
- 19.4.5. Distribution Channel
- 19.4.6. Target Consumer Demographics
- 19.4.7. End-Use Industry
- 19.5. Argentina Ready-to-Drink (RTD) Beverages Market
- 19.5.1. Country Segmental Analysis
- 19.5.2. Product Type
- 19.5.3. Packaging Size
- 19.5.4. Formulation
- 19.5.5. Distribution Channel
- 19.5.6. Target Consumer Demographics
- 19.5.7. End-Use Industry
- 19.6. Rest of South America Ready-to-Drink (RTD) Beverages Market
- 19.6.1. Country Segmental Analysis
- 19.6.2. Product Type
- 19.6.3. Packaging Size
- 19.6.4. Formulation
- 19.6.5. Distribution Channel
- 19.6.6. Target Consumer Demographics
- 19.6.7. End-Use Industry
- 20. Key Players/ Company Profile
- 20.1. Arizona Beverage Company
- 20.1.1. Company Details/ Overview
- 20.1.2. Company Financials
- 20.1.3. Key Customers and Competitors
- 20.1.4. Business/ Industry Portfolio
- 20.1.5. Product Portfolio/ Specification Details
- 20.1.6. Pricing Data
- 20.1.7. Strategic Overview
- 20.1.8. Recent Developments
- 20.2. Fever-Tree Drinks plc
- 20.3. Hector Beverages Private Ltd.
- 20.4. Heineken N.V.
- 20.5. Keurig Dr Pepper Inc.
- 20.6. Monster Beverage Corporation
- 20.7. Nestlé S.A.
- 20.8. PepsiCo Inc.
- 20.9. Red Bull GmbH
- 20.10. Starbucks Corporation
- 20.11. The Coca-Cola Company
- 20.12. Other Key Players
- 20.1. Arizona Beverage Company
Note* - This is just tentative list of players. While providing the report, we will cover more number of players based on their revenue and share for each geography
Research Design
Our research design integrates both demand-side and supply-side analysis through a balanced combination of primary and secondary research methodologies. By utilizing both bottom-up and top-down approaches alongside rigorous data triangulation methods, we deliver robust market intelligence that supports strategic decision-making.
MarketGenics' comprehensive research design framework ensures the delivery of accurate, reliable, and actionable market intelligence. Through the integration of multiple research approaches, rigorous validation processes, and expert analysis, we provide our clients with the insights needed to make informed strategic decisions and capitalize on market opportunities.

MarketGenics leverages a dedicated industry panel of experts and a comprehensive suite of paid databases to effectively collect, consolidate, and analyze market intelligence.
Our approach has consistently proven to be reliable and effective in generating accurate market insights, identifying key industry trends, and uncovering emerging business opportunities.
Through both primary and secondary research, we capture and analyze critical company-level data such as manufacturing footprints, including technical centers, R&D facilities, sales offices, and headquarters.
Our expert panel further enhances our ability to estimate market size for specific brands based on validated field-level intelligence.
Our data mining techniques incorporate both parametric and non-parametric methods, allowing for structured data collection, sorting, processing, and cleaning.
Demand projections are derived from large-scale data sets analyzed through proprietary algorithms, culminating in robust and reliable market sizing.
Research Approach
The bottom-up approach builds market estimates by starting with the smallest addressable market units and systematically aggregating them to create comprehensive market size projections.
This method begins with specific, granular data points and builds upward to create the complete market landscape.
Customer Analysis → Segmental Analysis → Geographical Analysis
The top-down approach starts with the broadest possible market data and systematically narrows it down through a series of filters and assumptions to arrive at specific market segments or opportunities.
This method begins with the big picture and works downward to increasingly specific market slices.
TAM → SAM → SOM


Research Methods
Desk / Secondary Research
While analysing the market, we extensively study secondary sources, directories, and databases to identify and collect information useful for this technical, market-oriented, and commercial report. Secondary sources that we utilize are not only the public sources, but it is a combination of Open Source, Associations, Paid Databases, MG Repository & Knowledgebase, and others.
- Company websites, annual reports, financial reports, broker reports, and investor presentations
- National government documents, statistical databases and reports
- News articles, press releases and web-casts specific to the companies operating in the market, Magazines, reports, and others
- We gather information from commercial data sources for deriving company specific data such as segmental revenue, share for geography, product revenue, and others
- Internal and external proprietary databases (industry-specific), relevant patent, and regulatory databases
- Governing Bodies, Government Organizations
- Relevant Authorities, Country-specific Associations for Industries
We also employ the model mapping approach to estimate the product level market data through the players' product portfolio
Primary Research
Primary research/ interviews is vital in analyzing the market. Most of the cases involves paid primary interviews. Primary sources include primary interviews through e-mail interactions, telephonic interviews, surveys as well as face-to-face interviews with the different stakeholders across the value chain including several industry experts.
| Type of Respondents | Number of Primaries |
|---|---|
| Tier 2/3 Suppliers | ~20 |
| Tier 1 Suppliers | ~25 |
| End-users | ~25 |
| Industry Expert/ Panel/ Consultant | ~30 |
| Total | ~100 |
MG Knowledgebase
• Repository of industry blog, newsletter and case studies
• Online platform covering detailed market reports, and company profiles
Forecasting Factors and Models
Forecasting Factors
- Historical Trends – Past market patterns, cycles, and major events that shaped how markets behave over time. Understanding past trends helps predict future behavior.
- Industry Factors – Specific characteristics of the industry like structure, regulations, and innovation cycles that affect market dynamics.
- Macroeconomic Factors – Economic conditions like GDP growth, inflation, and employment rates that affect how much money people have to spend.
- Demographic Factors – Population characteristics like age, income, and location that determine who can buy your product.
- Technology Factors – How quickly people adopt new technology and how much technology infrastructure exists.
- Regulatory Factors – Government rules, laws, and policies that can help or restrict market growth.
- Competitive Factors – Analyzing competition structure such as degree of competition and bargaining power of buyers and suppliers.
Forecasting Models / Techniques
Multiple Regression Analysis
- Identify and quantify factors that drive market changes
- Statistical modeling to establish relationships between market drivers and outcomes
Time Series Analysis – Seasonal Patterns
- Understand regular cyclical patterns in market demand
- Advanced statistical techniques to separate trend, seasonal, and irregular components
Time Series Analysis – Trend Analysis
- Identify underlying market growth patterns and momentum
- Statistical analysis of historical data to project future trends
Expert Opinion – Expert Interviews
- Gather deep industry insights and contextual understanding
- In-depth interviews with key industry stakeholders
Multi-Scenario Development
- Prepare for uncertainty by modeling different possible futures
- Creating optimistic, pessimistic, and most likely scenarios
Time Series Analysis – Moving Averages
- Sophisticated forecasting for complex time series data
- Auto-regressive integrated moving average models with seasonal components
Econometric Models
- Apply economic theory to market forecasting
- Sophisticated economic models that account for market interactions
Expert Opinion – Delphi Method
- Harness collective wisdom of industry experts
- Structured, multi-round expert consultation process
Monte Carlo Simulation
- Quantify uncertainty and probability distributions
- Thousands of simulations with varying input parameters
Research Analysis
Our research framework is built upon the fundamental principle of validating market intelligence from both demand and supply perspectives. This dual-sided approach ensures comprehensive market understanding and reduces the risk of single-source bias.
Demand-Side Analysis: We understand end-user/application behavior, preferences, and market needs along with the penetration of the product for specific application.
Supply-Side Analysis: We estimate overall market revenue, analyze the segmental share along with industry capacity, competitive landscape, and market structure.
Validation & Evaluation
Data triangulation is a validation technique that uses multiple methods, sources, or perspectives to examine the same research question, thereby increasing the credibility and reliability of research findings. In market research, triangulation serves as a quality assurance mechanism that helps identify and minimize bias, validate assumptions, and ensure accuracy in market estimates.
- Data Source Triangulation – Using multiple data sources to examine the same phenomenon
- Methodological Triangulation – Using multiple research methods to study the same research question
- Investigator Triangulation – Using multiple researchers or analysts to examine the same data
- Theoretical Triangulation – Using multiple theoretical perspectives to interpret the same data

Custom Market Research Services
We will customise the research for you, in case the report listed above does not meet your requirements.
Get 10% Free Customisation