Interactive Entertainment Devices Market Size, Share & Trends Analysis Report by Product Type (Gaming Consoles, Virtual Reality (VR) Devices, Augmented Reality (AR) Devices, Mixed Reality (MR) Devices, Interactive Displays & Smart TVs, Motion Sensing & Gesture Control Devices, Interactive Toys & Robotic Devices, Wearable Entertainment Devices, Arcade & Location-Based Entertainment Devices, Gaming Accessories, Other Products), Technology, Platform, Connectivity, Distribution Channel, End-users and Geography (North America, Europe, Asia Pacific, Middle East, Africa and South America) – Global Industry Data, Trends and Forecasts, 2026–2035
|
|
|
Segmental Data Insights |
|
|
Demand Trends |
|
|
Competitive Landscape |
|
|
Strategic Development |
|
|
Future Outlook & Opportunities |
|
Interactive Entertainment Devices Market Size, Share, and Growth
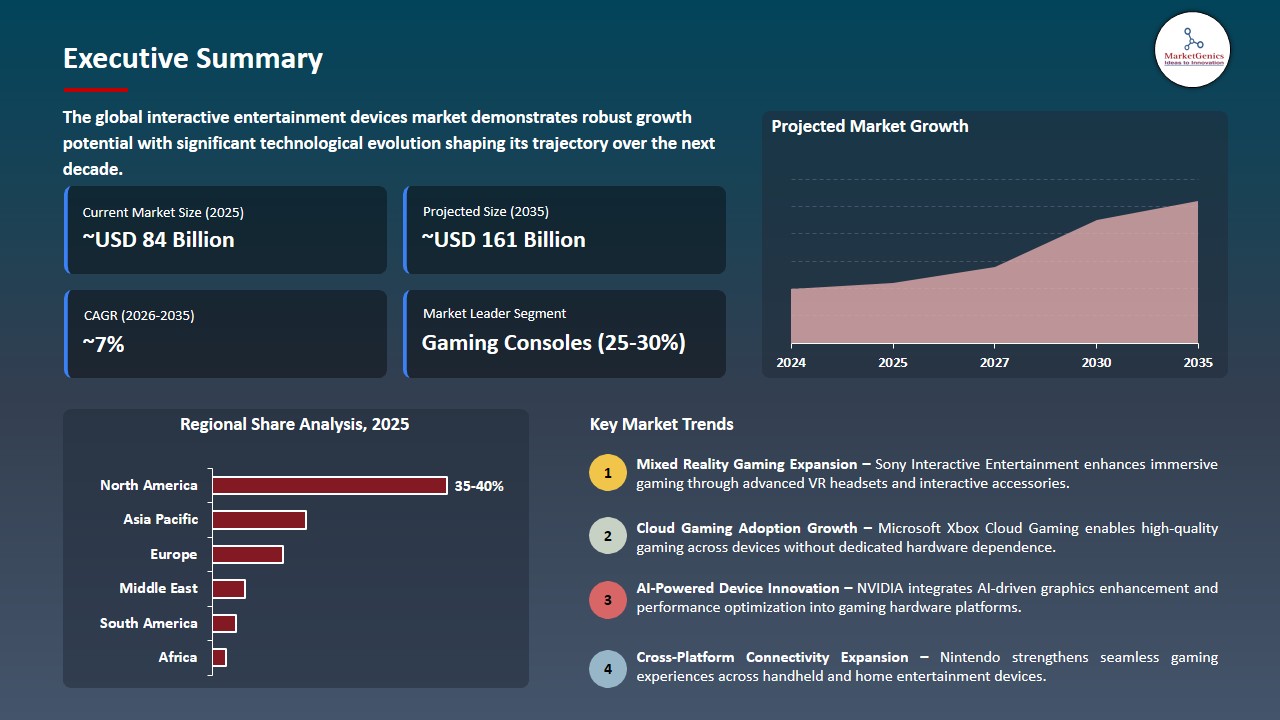
The global interactive entertainment devices market is exhibiting strong growth, with an estimated value of USD 83.9 billion in 2025 and USD 160.5 billion by 2035, achieving a CAGR of 6.7%, during the forecast period. Asia Pacific is the fastest-growing region in the interactive entertainment devices market due to expanding gaming populations, rising disposable incomes, widespread smartphone adoption, growing esports participation, and increasing investments in immersive gaming technologies and digital infrastructure.
Andrew Bowell, CEO of Iconic, said, “Our voice-driven gameplay experience is transforming traditional entertainment, utilising novel technology and innovative digital systems to enhance creativity, revolutionise the player experience, and redefine the boundaries of gaming. We are excited to announce our successful seed round led by Kindred and Northzone, with further support from leading industry players, including Google, a testimony to Iconic building the next iteration of interactive entertainment.”
The adoption of next-generation interactive entertainment devices is being boosted by consumer demand for immersive gaming experiences via advanced VR and motion-enabled devices, which are driving growth across the gaming console, VR headset and accessories segment. For instance, PlayStation VR2 features 4K HDR graphics, eye tracking, haptics, adaptive triggers, and 3D audio, which are expected to drive up demand for premium gaming hardware. Drives high-end device growth and boosts market revenue.
Moreover, the consumer preference for hybrid gaming in home and mobile settings is fueling innovation and the adoption of multi-modal interactive entertainment devices. For instance, Nintendo launched the Nintendo Switch 2, which features upgraded controllers, in addition to a better display and enhanced performance, an expanded storage capacity, and GameChat functionality. Increases demand for flexible gaming devices and connected entertainment ecosystems.
The adjacent opportunities for the global interactive entertainment devices market include cloud gaming subscriptions, mixed reality headsets and content, haptic accessories, mobile gaming peripherals, and cross-device social play platforms, as major brands are expanding play-anywhere streaming, immersive VR/MR, tactile feedback, portable gear, and collaborative experiences across devices. These adjacent markets broaden revenue streams and strengthen long-term device ecosystem growth.
Interactive Entertainment Devices Market Dynamics and Trends
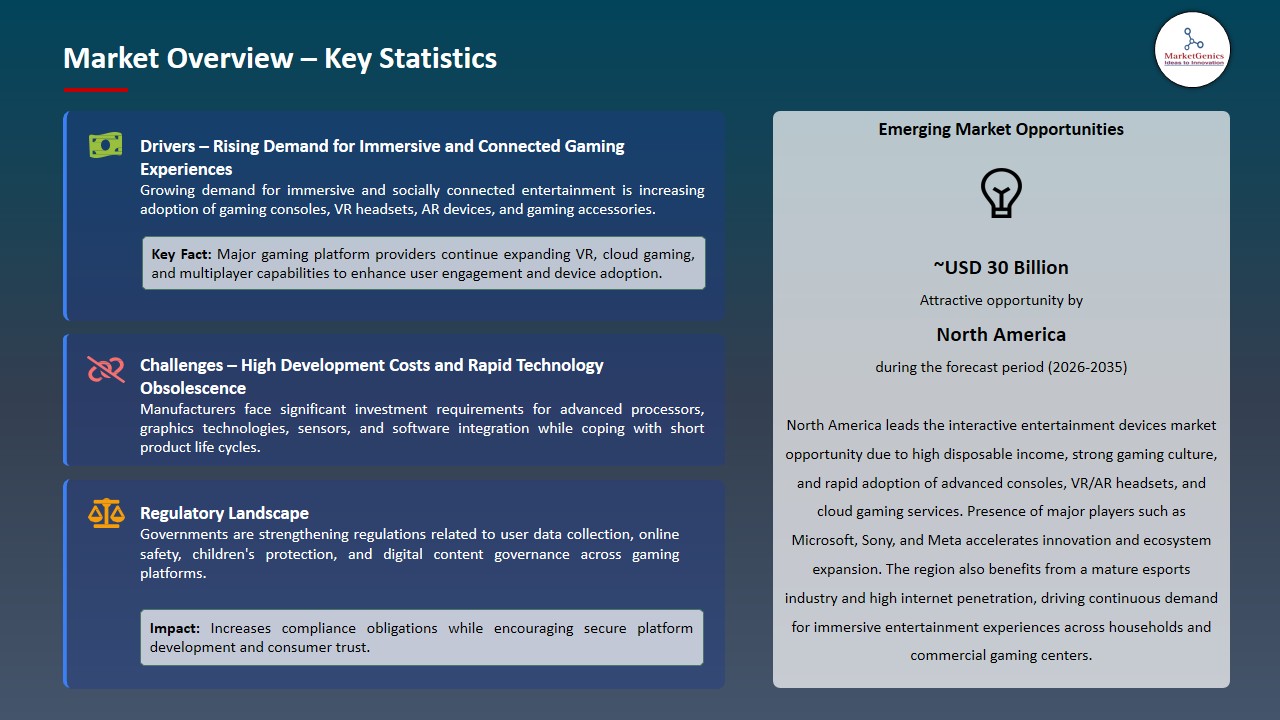
Driver: Expansion of Cloud Gaming Ecosystems Enhancing Multi-Device Entertainment Accessibility
- Cloud gaming platforms are bolstering the interactive entertainment devices market by providing easy access to gaming content on consoles, PCs, handheld devices and smartphones. This shift decreases reliance on hardware and increases participation in gaming ecosystems, which drives demand for accessories and connected devices.
- For instance, Microsoft's Xbox Cloud Gaming and Xbox Play Anywhere projects this direction, allowing Xbox users to play across a variety of devices and improving the interoperability and flexibility of devices.
- The growing emphasis on cross-platform accessibility is encouraging manufacturers to develop hardware solutions that deliver consistent performance across diverse entertainment settings. This change is driving more consumer engagement, higher device usage rates, and deeper connected entertainment ecosystems' value proposition.
- Facilitates the entrance of the ecosystem and maintains demand for connected gaming hardware and accessories.
Restraint: Premium Device Pricing Structures Limiting Broader Consumer Market Penetration
- The high acquisition costs are a major hurdle for the interactive entertainment devices industry, especially in emerging segments like spatial computing and mixed-reality devices. Premium pricing slows the spread of adoption among mainstream users and focuses demand among more affluent user groups and early adopters.
- For instance, Apple's Vision Pro, which introduces sophisticated spatial computing features in a higher price segment that's out of reach for many consumers. The device illustrates the potential challenges posed by the adoption of cutting-edge innovation, where affordability is restricted.
- As technology becomes more sophisticated, high expenses may create barriers for quick and widespread market adoption, and high replacement prices may lengthen replacement cycles. These price constraints persist and are hindering broad market penetration.
- Restricts mass-market uptake and restricts volume growth in premium device categories.
Opportunity: Increasing Availability of Affordable Mixed-Reality Devices Expanding Consumer Reach
- The emergence of affordable MR devices is generating significant growth potential by expanding the reach of immersive entertainment technologies. The more affordable hardware options will help manufacturers tap into new market segments that were turned off by the high cost of the more sophisticated virtual and mixed reality devices.
- For instance, Meta's Quest 3S presents the opportunity as an accessible price point for delivering mixed-reality functionality – as opposed to the higher-end options. The product is part of a wider industry trend to offer immersive experiences to a larger audience and to increase market penetration.
- Immersive entertainment experiences will have more users on the installed base as the affordability of these experiences grows, generating more revenue for software, digital content, accessories, and subscription-based options through the interactive entertainment value chain.
- Increases the number of consumers and increases the sustainability of ecosystem revenue.
Key Trend: Growing Adoption of Advanced Haptic and Cross-Platform Gaming Accessories
- Advanced haptic technologies and cross-platform support in gaming accessories are becoming more commonplace in the interactive entertainment devices market. With consumers' expectations changing, manufacturers are prioritizing delivering an immersive, low-latency, and seamless experience on consoles, PC, mobile devices, and cloud gaming platforms.
- For instance, Razer's new gaming controls and mobile gaming peripherals are notable for their use of advanced haptic feedback, multi-device support and responsiveness. These innovations are helping to create more connected and immersive gaming experiences, and accessories are playing a larger part in the greater entertainment hardware scene.
- Increases access to game content and improve the engagement of the players in the various ecosystems.
Interactive Entertainment Devices Market Analysis and Segmental Data
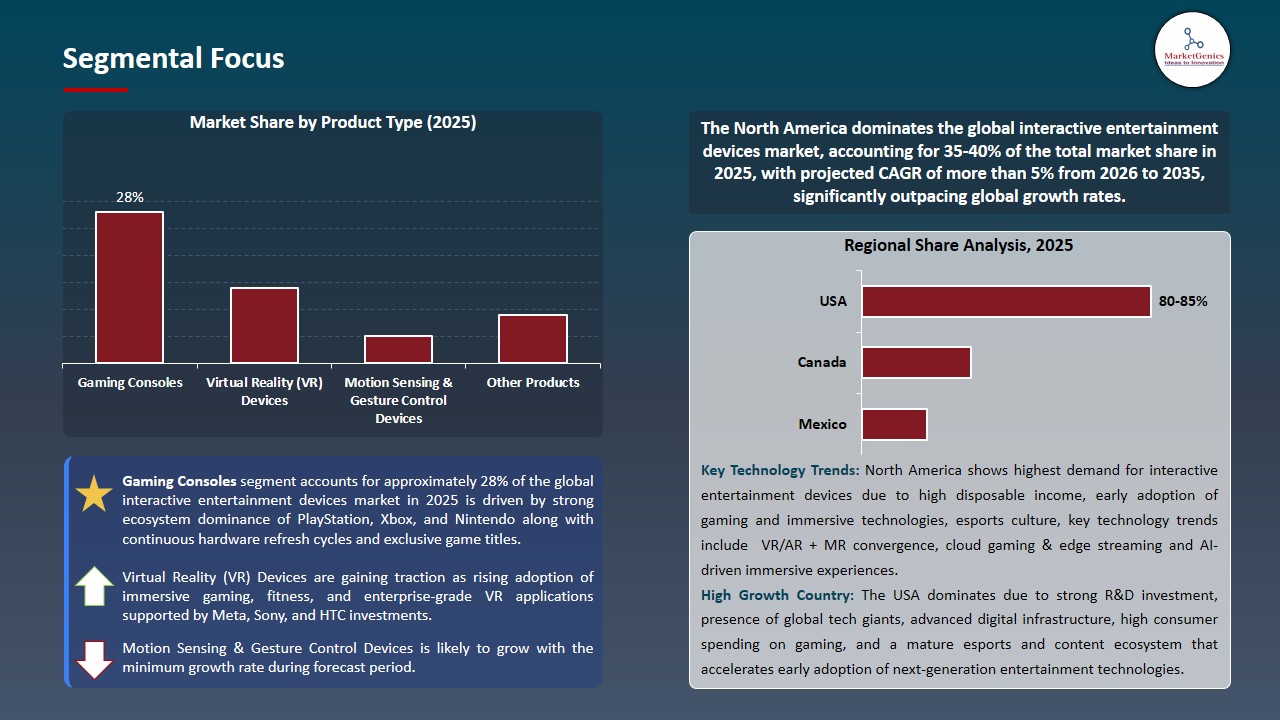
Gaming Consoles Dominate Global Interactive Entertainment Devices Market
- The gaming consoles segment dominates the global interactive entertainment devices market because of their high-performance gaming features, exclusive games, online connectivity, and the immersive experience. The demand for dedicated gaming platforms around the globe is still growing thanks to the improvements in graphics, cloud gaming and subscription services.
- Also, the segment has several strengths such as brand loyalty, a large library of games, regular hardware upgrades and participation in esports. Leading manufacturers are still investing in the next generation of console features, which are improving the quality of the games, and increasing digital content environments that fuel ongoing consumer spending and also growing interactive gaming market.
- For example, Sony Interactive Entertainment announced in their company website that 93 million PlayStation 5 units have been sold worldwide since its launch.
- The strong console adoption is further driving sales of software and digital subscriptions as well as expanding the console ecosystem, sustaining gaming consoles as the key revenue driver in the global interactive entertainment devices market.
North America Leads Global Interactive Entertainment Devices Market Demand
- North America dominate the interactive entertainment devices market due to high consumer spending on gaming hardware, premium entertainment technologies, and subscription-based gaming services continues to drive strong demand for interactive entertainment devices across North America.
- Furthermore, the region’s growth is bolstered by the presence of key technology and gaming firms, advanced broadband and cloud infrastructure, and widespread involvement in esports and adoption of new technologies. The integration of cloud gaming, AI, and VR/AR features remains a key driver of device uptake and is further consolidating North America's dominance as the world's largest interactive entertainment device market.
- North America's digital ecosystem, technological dominance and level of consumer engagement will remain strong, fostering innovation, rapid adoption of next-generation entertainment devices, and maintaining its leadership in the global interactive entertainment devices market.
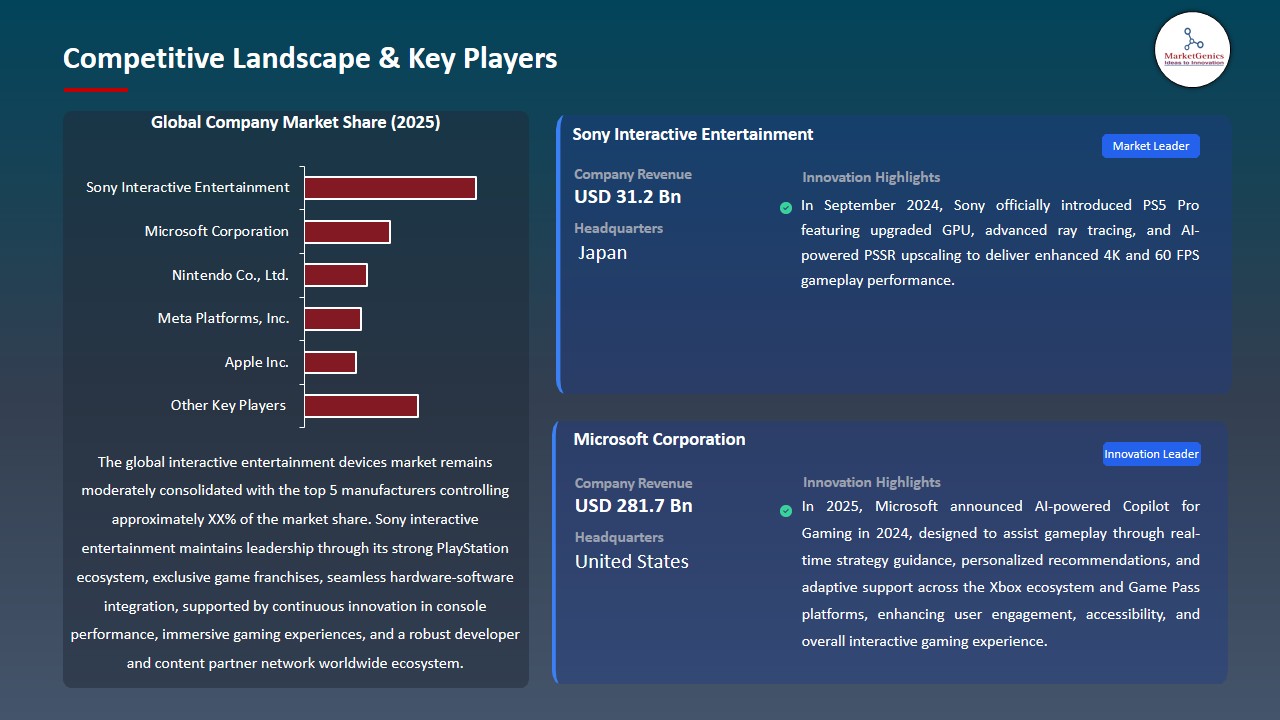
Interactive Entertainment Devices Market Ecosystem
The global interactive entertainment devices market is moderately consolidated, with leading players such as Sony Interactive Entertainment, Microsoft Corporation, Nintendo Co., Ltd., Meta Platforms, Inc., and Apple Inc. dominating global competition with their cutting-edge gaming ecosystems, immersive devices, and AI-powered interactive technologies, respectively. These companies collectively control a significant share of the market by integrating high-performance consoles, VR/AR headsets, and cloud-based entertainment platforms.
The key players are shifting their attention to niche and specialized technologies to facilitate innovation, including Sony's PlayStation VR2 ecosystem for immersive gaming, Microsoft's Xbox Cloud Gaming with AI-driven Copilot capabilities, Meta's mixed reality Vision Pro headset for social VR, Nintendo's hybrid console design and Apple's spatial computing capabilities with the Vision Pro headset. These specialized solutions improve user interaction and bring applications out of the gaming area and into education, fitness, and amusement.
This continuous innovation, growth of the ecosystem, and its increasing penetration into the global market is making the competitive landscape tougher for key players and leading to more robust home entertainment device market growth by improving user engagement and cross-platform integration.
 Recent Development and Strategic Overview:
- In February 2026, Haveli Investments agreed to acquire Budge Studios, a children's digital interactive entertainment developer with over 2 billion mobile game downloads across more than 200 countries, highlighting growing investment in interactive entertainment content and gaming ecosystems.
- In December 2025, Amazon expanded its Luna cloud gaming service to Comcast X1 and Xfinity Xumo Stream Box devices, enabling Prime members to access AAA games without purchasing dedicated gaming consoles, highlighting the growing adoption of cloud-based interactive entertainment ecosystems.
Report Scope
|
Detail |
|
|
Market Size in 2025 |
USD 83.9 Bn |
|
Market Forecast Value in 2035 |
USD 160.5 Bn |
|
Growth Rate (CAGR) |
6.7% |
|
Forecast Period |
2026 – 2035 |
|
Historical Data Available for |
2021 – 2024 |
|
Market Size Units |
US$ Billion for Value Thousands for Volume |
|
Report Format |
Electronic (PDF) + Excel |
|
North America |
Europe |
Asia Pacific |
Middle East |
Africa |
South America |
|
|
|
|
|
|
|
Companies Covered |
|||||
|
|
|
||||
Interactive Entertainment Devices Market Segmentation and Highlights
|
Segment |
Sub-segment |
|
Interactive Entertainment Devices Market, By Product Type |
|
|
Interactive Entertainment Devices Market, By Technology |
|
|
Interactive Entertainment Devices Market, By Platform |
|
|
Interactive Entertainment Devices Market, By Connectivity |
|
|
Interactive Entertainment Devices Market, By Distribution Channel |
|
|
Interactive Entertainment Devices Market, By End-users |
|
Frequently Asked Questions
Table of Contents
- 1. Research Methodology and Assumptions
- 1.1. Definitions
- 1.2. Research Design and Approach
- 1.3. Data Collection Methods
- 1.4. Base Estimates and Calculations
- 1.5. Forecasting Models
- 1.5.1. Key Forecast Factors & Impact Analysis
- 1.6. Secondary Research
- 1.6.1. Open Sources
- 1.6.2. Paid Databases
- 1.6.3. Associations
- 1.7. Primary Research
- 1.7.1. Primary Sources
- 1.7.2. Primary Interviews with Stakeholders across Ecosystem
- 2. Executive Summary
- 2.1. Global Interactive Entertainment Devices Market Outlook
- 2.1.1. Interactive Entertainment Devices Market Size (Volume - Thousand Units & Value - US$ Bn), and Forecasts, 2021-2035
- 2.1.2. Compounded Annual Growth Rate Analysis
- 2.1.3. Growth Opportunity Analysis
- 2.1.4. Segmental Share Analysis
- 2.1.5. Geographical Share Analysis
- 2.2. Market Analysis and Facts
- 2.3. Supply-Demand Analysis
- 2.4. Competitive Benchmarking
- 2.5. Go-to- Market Strategy
- 2.5.1. Customer/ End-use Industry Assessment
- 2.5.2. Growth Opportunity Data, 2026-2035
- 2.5.2.1. Regional Data
- 2.5.2.2. Country Data
- 2.5.2.3. Segmental Data
- 2.5.3. Identification of Potential Market Spaces
- 2.5.4. GAP Analysis
- 2.5.5. Potential Attractive Price Points
- 2.5.6. Prevailing Market Risks & Challenges
- 2.5.7. Preferred Sales & Marketing Strategies
- 2.5.8. Key Recommendations and Analysis
- 2.5.9. A Way Forward
- 2.1. Global Interactive Entertainment Devices Market Outlook
- 3. Industry Data and Premium Insights
- 3.1. Global Consumer Goods & Services Industry Overview, 2025
- 3.1.1. Consumer Goods & Services Ecosystem Analysis
- 3.1.2. Key Trends for Consumer Goods & Services Industry
- 3.1.3. Regional Distribution for Consumer Goods & Services Industry
- 3.2. Supplier Customer Data
- 3.3. Technology Roadmap and Developments
- 3.4. Trade Analysis
- 3.4.1. Import & Export Analysis, 2025
- 3.4.2. Top Importing Countries
- 3.4.3. Top Exporting Countries
- 3.5. Trump Tariff Impact Analysis
- 3.5.1. Manufacturer
- 3.5.1.1. Based on the component & Raw material
- 3.5.2. Supply Chain
- 3.5.3. End Consumer
- 3.5.1. Manufacturer
- 3.1. Global Consumer Goods & Services Industry Overview, 2025
- 4. Market Overview
- 4.1. Market Dynamics
- 4.1.1. Drivers
- 4.1.1.1. Rising Adoption of VR and AR Gaming Technologies
- 4.1.1.2. Growing Demand for Connected Entertainment Experiences
- 4.1.1.3. Expansion of Cloud Gaming and High-Speed Networks
- 4.1.2. Restraints
- 4.1.2.1. High Device Costs and Frequent Upgrade Requirements
- 4.1.2.2. Data Privacy and Cybersecurity Concerns in Gaming Platforms
- 4.1.1. Drivers
- 4.2. Key Trend Analysis
- 4.3. Regulatory Framework
- 4.3.1. Key Regulations, Norms, and Subsidies, by Key Countries
- 4.3.2. Tariffs and Standards
- 4.3.3. Impact Analysis of Regulations on the Market
- 4.4. Value Chain Analysis
- 4.4.1. Component Supplier
- 4.4.2. Device Manufacturers
- 4.4.3. Distributors & Retailers
- 4.4.4. End Users and Consumers
- 4.5. Porter’s Five Forces Analysis
- 4.6. PESTEL Analysis
- 4.7. Global Interactive Entertainment Devices Market Demand
- 4.7.1. Historical Market Size – in Volume (Thousand Units) and Value (US$ Bn), 2020-2024
- 4.7.2. Current and Future Market Size – in Volume (Thousand Units) and Value (US$ Bn), 2026–2035
- 4.7.2.1. Y-o-Y Growth Trends
- 4.7.2.2. Absolute $ Opportunity Assessment
- 4.1. Market Dynamics
- 5. Competition Landscape
- 5.1. Competition structure
- 5.1.1. Fragmented v/s consolidated
- 5.2. Company Share Analysis, 2025
- 5.2.1. Global Company Market Share
- 5.2.2. By Region
- 5.2.2.1. North America
- 5.2.2.2. Europe
- 5.2.2.3. Asia Pacific
- 5.2.2.4. Middle East
- 5.2.2.5. Africa
- 5.2.2.6. South America
- 5.3. Product Comparison Matrix
- 5.3.1. Specifications
- 5.3.2. Market Positioning
- 5.3.3. Pricing
- 5.1. Competition structure
- 6. Global Interactive Entertainment Devices Market Analysis, by Product Type
- 6.1. Key Segment Analysis
- 6.2. Interactive Entertainment Devices Market Size (Volume - Thousand Units & Value - US$ Bn), Analysis, and Forecasts, by Product Type, 2021-2035
- 6.2.1. Gaming Consoles
- 6.2.2. Virtual Reality (VR) Devices
- 6.2.3. Augmented Reality (AR) Devices
- 6.2.4. Mixed Reality (MR) Devices
- 6.2.5. Interactive Displays & Smart TVs
- 6.2.6. Motion Sensing & Gesture Control Devices
- 6.2.7. Interactive Toys & Robotic Devices
- 6.2.8. Wearable Entertainment Devices
- 6.2.9. Arcade & Location-Based Entertainment Devices
- 6.2.10. Gaming Accessories
- 6.2.11. Other Products
- 7. Global Interactive Entertainment Devices Market Analysis, by Technology
- 7.1. Key Segment Analysis
- 7.2. Interactive Entertainment Devices Market Size (Volume - Thousand Units & Value - US$ Bn), Analysis, and Forecasts, by Technology, 2021-2035
- 7.2.1. Haptic Feedback Technology
- 7.2.2. Eye-Tracking Technology
- 7.2.3. Spatial Audio & 3D Sound Technology
- 7.2.4. Blockchain & NFT Integration
- 7.2.5. Computer Vision & Depth Sensing
- 7.2.6. Others
- 8. Global Interactive Entertainment Devices Market Analysis, by Platform
- 8.1. Key Segment Analysis
- 8.2. Interactive Entertainment Devices Market Size (Volume - Thousand Units & Value - US$ Bn), Analysis, and Forecasts, by Platform, 2021-2035
- 8.2.1. Console-based
- 8.2.2. PC-based
- 8.2.3. Mobile-based
- 8.2.4. Game Streaming Platforms
- 8.2.5. Dedicated Devices
- 8.2.6. Cross-platform Compatible Devices
- 9. Global Interactive Entertainment Devices Market Analysis, by Connectivity
- 9.1. Key Segment Analysis
- 9.2. Interactive Entertainment Devices Market Size (Volume - Thousand Units & Value - US$ Bn), Analysis, and Forecasts, by Connectivity, 2021-2035
- 9.2.1. Wired
- 9.2.1.1. USB / USB-C Connected
- 9.2.1.2. HDMI / Display Port Connected
- 9.2.2. Wireless
- 9.2.2.1. Bluetooth
- 9.2.2.2. Wi-Fi / Wi-Fi 6E
- 9.2.2.3. 5G / Cellular Network
- 9.2.2.4. RF-based Connectivity
- 9.2.2.5. Others
- 9.2.3. Hybrid (Wired + Wireless)
- 9.2.1. Wired
- 10. Global Interactive Entertainment Devices Market Analysis, by Distribution Channel
- 10.1. Key Segment Analysis
- 10.2. Interactive Entertainment Devices Market Size (Volume - Thousand Units & Value - US$ Bn), Analysis, and Forecasts, by Distribution Channel, 2021-2035
- 10.2.1. Online Channels
- 10.2.2. Offline Channels
- 10.2.3. B2B/Direct Sales
- 11. Global Interactive Entertainment Devices Market Analysis, by End-users
- 11.1. Key Segment Analysis
- 11.2. Interactive Entertainment Devices Market Size (Volume - Thousand Units & Value - US$ Bn), Analysis, and Forecasts, by End-users, 2021-2035
- 11.2.1. Gaming & Entertainment
- 11.2.2. Education & E-Learning
- 11.2.3. Media & Broadcasting
- 11.2.4. Retail & Advertising
- 11.2.5. Sports & Fitness
- 11.2.6. Tourism & Hospitality
- 11.2.7. Education & E-Learning
- 11.2.8. Others
- 12. Global Interactive Entertainment Devices Market Analysis, by Region
- 12.1. Key Findings
- 12.2. Interactive Entertainment Devices Market Size (Volume - Thousand Units & Value - US$ Bn), Analysis, and Forecasts, by Region, 2021-2035
- 12.2.1. North America
- 12.2.2. Europe
- 12.2.3. Asia Pacific
- 12.2.4. Middle East
- 12.2.5. Africa
- 12.2.6. South America
- 13. North America Interactive Entertainment Devices Market Analysis
- 13.1. Key Segment Analysis
- 13.2. Regional Snapshot
- 13.3. North America Interactive Entertainment Devices Market Size (Volume - Thousand Units & Value - US$ Bn), Analysis, and Forecasts, 2021-2035
- 13.3.1. Product Type
- 13.3.2. Technology
- 13.3.3. Platform
- 13.3.4. Connectivity
- 13.3.5. Distribution Channel
- 13.3.6. End-users
- 13.3.7. Country
- 13.3.7.1. USA
- 13.3.7.2. Canada
- 13.3.7.3. Mexico
- 13.4. USA Interactive Entertainment Devices Market
- 13.4.1. Country Segmental Analysis
- 13.4.2. Product Type
- 13.4.3. Technology
- 13.4.4. Platform
- 13.4.5. Connectivity
- 13.4.6. Distribution Channel
- 13.4.7. End-users
- 13.5. Canada Interactive Entertainment Devices Market
- 13.5.1. Country Segmental Analysis
- 13.5.2. Product Type
- 13.5.3. Technology
- 13.5.4. Platform
- 13.5.5. Connectivity
- 13.5.6. Distribution Channel
- 13.5.7. End-users
- 13.6. Mexico Interactive Entertainment Devices Market
- 13.6.1. Country Segmental Analysis
- 13.6.2. Product Type
- 13.6.3. Technology
- 13.6.4. Platform
- 13.6.5. Connectivity
- 13.6.6. Distribution Channel
- 13.6.7. End-users
- 14. Europe Interactive Entertainment Devices Market Analysis
- 14.1. Key Segment Analysis
- 14.2. Regional Snapshot
- 14.3. Europe Interactive Entertainment Devices Market Size (Volume - Thousand Units & Value - US$ Bn), Analysis, and Forecasts, 2021-2035
- 14.3.1. Product Type
- 14.3.2. Technology
- 14.3.3. Platform
- 14.3.4. Connectivity
- 14.3.5. Distribution Channel
- 14.3.6. End-users
- 14.3.7. Country
- 14.3.7.1. Germany
- 14.3.7.2. United Kingdom
- 14.3.7.3. France
- 14.3.7.4. Italy
- 14.3.7.5. Spain
- 14.3.7.6. Netherlands
- 14.3.7.7. Nordic Countries
- 14.3.7.8. Poland
- 14.3.7.9. Russia & CIS
- 14.3.7.10. Rest of Europe
- 14.4. Germany Interactive Entertainment Devices Market
- 14.4.1. Country Segmental Analysis
- 14.4.2. Product Type
- 14.4.3. Technology
- 14.4.4. Platform
- 14.4.5. Connectivity
- 14.4.6. Distribution Channel
- 14.4.7. End-users
- 14.5. United Kingdom Interactive Entertainment Devices Market
- 14.5.1. Country Segmental Analysis
- 14.5.2. Product Type
- 14.5.3. Technology
- 14.5.4. Platform
- 14.5.5. Connectivity
- 14.5.6. Distribution Channel
- 14.5.7. End-users
- 14.6. France Interactive Entertainment Devices Market
- 14.6.1. Country Segmental Analysis
- 14.6.2. Product Type
- 14.6.3. Technology
- 14.6.4. Platform
- 14.6.5. Connectivity
- 14.6.6. Distribution Channel
- 14.6.7. End-users
- 14.7. Italy Interactive Entertainment Devices Market
- 14.7.1. Country Segmental Analysis
- 14.7.2. Product Type
- 14.7.3. Technology
- 14.7.4. Platform
- 14.7.5. Connectivity
- 14.7.6. Distribution Channel
- 14.7.7. End-users
- 14.8. Spain Interactive Entertainment Devices Market
- 14.8.1. Country Segmental Analysis
- 14.8.2. Product Type
- 14.8.3. Technology
- 14.8.4. Platform
- 14.8.5. Connectivity
- 14.8.6. Distribution Channel
- 14.8.7. End-users
- 14.9. Netherlands Interactive Entertainment Devices Market
- 14.9.1. Country Segmental Analysis
- 14.9.2. Product Type
- 14.9.3. Technology
- 14.9.4. Platform
- 14.9.5. Connectivity
- 14.9.6. Distribution Channel
- 14.9.7. End-users
- 14.10. Nordic Countries Interactive Entertainment Devices Market
- 14.10.1. Country Segmental Analysis
- 14.10.2. Product Type
- 14.10.3. Technology
- 14.10.4. Platform
- 14.10.5. Connectivity
- 14.10.6. Distribution Channel
- 14.10.7. End-users
- 14.11. Poland Interactive Entertainment Devices Market
- 14.11.1. Country Segmental Analysis
- 14.11.2. Product Type
- 14.11.3. Technology
- 14.11.4. Platform
- 14.11.5. Connectivity
- 14.11.6. Distribution Channel
- 14.11.7. End-users
- 14.12. Russia & CIS Interactive Entertainment Devices Market
- 14.12.1. Country Segmental Analysis
- 14.12.2. Product Type
- 14.12.3. Technology
- 14.12.4. Platform
- 14.12.5. Connectivity
- 14.12.6. Distribution Channel
- 14.12.7. End-users
- 14.13. Rest of Europe Interactive Entertainment Devices Market
- 14.13.1. Country Segmental Analysis
- 14.13.2. Product Type
- 14.13.3. Technology
- 14.13.4. Platform
- 14.13.5. Connectivity
- 14.13.6. Distribution Channel
- 14.13.7. End-users
- 15. Asia Pacific Interactive Entertainment Devices Market Analysis
- 15.1. Key Segment Analysis
- 15.2. Regional Snapshot
- 15.3. Asia Pacific Interactive Entertainment Devices Market Size (Volume - Thousand Units & Value - US$ Bn), Analysis, and Forecasts, 2021-2035
- 15.3.1. Product Type
- 15.3.2. Technology
- 15.3.3. Platform
- 15.3.4. Connectivity
- 15.3.5. Distribution Channel
- 15.3.6. End-users
- 15.3.7. Country
- 15.3.7.1. China
- 15.3.7.2. India
- 15.3.7.3. Japan
- 15.3.7.4. South Korea
- 15.3.7.5. Australia and New Zealand
- 15.3.7.6. Indonesia
- 15.3.7.7. Malaysia
- 15.3.7.8. Thailand
- 15.3.7.9. Vietnam
- 15.3.7.10. Rest of Asia Pacific
- 15.4. China Interactive Entertainment Devices Market
- 15.4.1. Country Segmental Analysis
- 15.4.2. Product Type
- 15.4.3. Technology
- 15.4.4. Platform
- 15.4.5. Connectivity
- 15.4.6. Distribution Channel
- 15.4.7. End-users
- 15.5. India Interactive Entertainment Devices Market
- 15.5.1. Country Segmental Analysis
- 15.5.2. Product Type
- 15.5.3. Technology
- 15.5.4. Platform
- 15.5.5. Connectivity
- 15.5.6. Distribution Channel
- 15.5.7. End-users
- 15.6. Japan Interactive Entertainment Devices Market
- 15.6.1. Country Segmental Analysis
- 15.6.2. Product Type
- 15.6.3. Technology
- 15.6.4. Platform
- 15.6.5. Connectivity
- 15.6.6. Distribution Channel
- 15.6.7. End-users
- 15.7. South Korea Interactive Entertainment Devices Market
- 15.7.1. Country Segmental Analysis
- 15.7.2. Product Type
- 15.7.3. Technology
- 15.7.4. Platform
- 15.7.5. Connectivity
- 15.7.6. Distribution Channel
- 15.7.7. End-users
- 15.8. Australia and New Zealand Interactive Entertainment Devices Market
- 15.8.1. Country Segmental Analysis
- 15.8.2. Product Type
- 15.8.3. Technology
- 15.8.4. Platform
- 15.8.5. Connectivity
- 15.8.6. Distribution Channel
- 15.8.7. End-users
- 15.9. Indonesia Interactive Entertainment Devices Market
- 15.9.1. Country Segmental Analysis
- 15.9.2. Product Type
- 15.9.3. Technology
- 15.9.4. Platform
- 15.9.5. Connectivity
- 15.9.6. Distribution Channel
- 15.9.7. End-users
- 15.10. Malaysia Interactive Entertainment Devices Market
- 15.10.1. Country Segmental Analysis
- 15.10.2. Product Type
- 15.10.3. Technology
- 15.10.4. Platform
- 15.10.5. Connectivity
- 15.10.6. Distribution Channel
- 15.10.7. End-users
- 15.11. Thailand Interactive Entertainment Devices Market
- 15.11.1. Country Segmental Analysis
- 15.11.2. Product Type
- 15.11.3. Technology
- 15.11.4. Platform
- 15.11.5. Connectivity
- 15.11.6. Distribution Channel
- 15.11.7. End-users
- 15.12. Vietnam Interactive Entertainment Devices Market
- 15.12.1. Country Segmental Analysis
- 15.12.2. Product Type
- 15.12.3. Technology
- 15.12.4. Platform
- 15.12.5. Connectivity
- 15.12.6. Distribution Channel
- 15.12.7. End-users
- 15.13. Rest of Asia Pacific Interactive Entertainment Devices Market
- 15.13.1. Country Segmental Analysis
- 15.13.2. Product Type
- 15.13.3. Technology
- 15.13.4. Platform
- 15.13.5. Connectivity
- 15.13.6. Distribution Channel
- 15.13.7. End-users
- 16. Middle East Interactive Entertainment Devices Market Analysis
- 16.1. Key Segment Analysis
- 16.2. Regional Snapshot
- 16.3. Middle East Interactive Entertainment Devices Market Size (Volume - Thousand Units & Value - US$ Bn), Analysis, and Forecasts, 2021-2035
- 16.3.1. Product Type
- 16.3.2. Technology
- 16.3.3. Platform
- 16.3.4. Connectivity
- 16.3.5. Distribution Channel
- 16.3.6. End-users
- 16.3.7. Country
- 16.3.7.1. Turkey
- 16.3.7.2. UAE
- 16.3.7.3. Saudi Arabia
- 16.3.7.4. Israel
- 16.3.7.5. Rest of Middle East
- 16.4. Turkey Interactive Entertainment Devices Market
- 16.4.1. Country Segmental Analysis
- 16.4.2. Product Type
- 16.4.3. Technology
- 16.4.4. Platform
- 16.4.5. Connectivity
- 16.4.6. Distribution Channel
- 16.4.7. End-users
- 16.5. UAE Interactive Entertainment Devices Market
- 16.5.1. Country Segmental Analysis
- 16.5.2. Product Type
- 16.5.3. Technology
- 16.5.4. Platform
- 16.5.5. Connectivity
- 16.5.6. Distribution Channel
- 16.5.7. End-users
- 16.6. Saudi Arabia Interactive Entertainment Devices Market
- 16.6.1. Country Segmental Analysis
- 16.6.2. Product Type
- 16.6.3. Technology
- 16.6.4. Platform
- 16.6.5. Connectivity
- 16.6.6. Distribution Channel
- 16.6.7. End-users
- 16.7. Israel Interactive Entertainment Devices Market
- 16.7.1. Country Segmental Analysis
- 16.7.2. Product Type
- 16.7.3. Technology
- 16.7.4. Platform
- 16.7.5. Connectivity
- 16.7.6. Distribution Channel
- 16.7.7. End-users
- 16.8. Rest of Middle East Interactive Entertainment Devices Market
- 16.8.1. Country Segmental Analysis
- 16.8.2. Product Type
- 16.8.3. Technology
- 16.8.4. Platform
- 16.8.5. Connectivity
- 16.8.6. Distribution Channel
- 16.8.7. End-users
- 17. Africa Interactive Entertainment Devices Market Analysis
- 17.1. Key Segment Analysis
- 17.2. Regional Snapshot
- 17.3. Africa Interactive Entertainment Devices Market Size (Volume - Thousand Units & Value - US$ Bn), Analysis, and Forecasts, 2021-2035
- 17.3.1. Product Type
- 17.3.2. Technology
- 17.3.3. Platform
- 17.3.4. Connectivity
- 17.3.5. Distribution Channel
- 17.3.6. End-users
- 17.3.7. Country
- 17.3.7.1. South Africa
- 17.3.7.2. Egypt
- 17.3.7.3. Nigeria
- 17.3.7.4. Algeria
- 17.3.7.5. Rest of Africa
- 17.4. South Africa Interactive Entertainment Devices Market
- 17.4.1. Country Segmental Analysis
- 17.4.2. Product Type
- 17.4.3. Technology
- 17.4.4. Platform
- 17.4.5. Connectivity
- 17.4.6. Distribution Channel
- 17.4.7. End-users
- 17.5. Egypt Interactive Entertainment Devices Market
- 17.5.1. Country Segmental Analysis
- 17.5.2. Product Type
- 17.5.3. Technology
- 17.5.4. Platform
- 17.5.5. Connectivity
- 17.5.6. Distribution Channel
- 17.5.7. End-users
- 17.6. Nigeria Interactive Entertainment Devices Market
- 17.6.1. Country Segmental Analysis
- 17.6.2. Product Type
- 17.6.3. Technology
- 17.6.4. Platform
- 17.6.5. Connectivity
- 17.6.6. Distribution Channel
- 17.6.7. End-users
- 17.7. Algeria Interactive Entertainment Devices Market
- 17.7.1. Country Segmental Analysis
- 17.7.2. Product Type
- 17.7.3. Technology
- 17.7.4. Platform
- 17.7.5. Connectivity
- 17.7.6. Distribution Channel
- 17.7.7. End-users
- 17.8. Rest of Africa Interactive Entertainment Devices Market
- 17.8.1. Country Segmental Analysis
- 17.8.2. Product Type
- 17.8.3. Technology
- 17.8.4. Platform
- 17.8.5. Connectivity
- 17.8.6. Distribution Channel
- 17.8.7. End-users
- 18. South America Interactive Entertainment Devices Market Analysis
- 18.1. Key Segment Analysis
- 18.2. Regional Snapshot
- 18.3. South America Interactive Entertainment Devices Market Size (Volume - Thousand Units & Value - US$ Bn), Analysis, and Forecasts, 2021-2035
- 18.3.1. Product Type
- 18.3.2. Technology
- 18.3.3. Platform
- 18.3.4. Connectivity
- 18.3.5. Distribution Channel
- 18.3.6. End-users
- 18.3.7. Country
- 18.3.7.1. Brazil
- 18.3.7.2. Argentina
- 18.3.7.3. Rest of South America
- 18.4. Brazil Interactive Entertainment Devices Market
- 18.4.1. Country Segmental Analysis
- 18.4.2. Product Type
- 18.4.3. Technology
- 18.4.4. Platform
- 18.4.5. Connectivity
- 18.4.6. Distribution Channel
- 18.4.7. End-users
- 18.5. Argentina Interactive Entertainment Devices Market
- 18.5.1. Country Segmental Analysis
- 18.5.2. Product Type
- 18.5.3. Technology
- 18.5.4. Platform
- 18.5.5. Connectivity
- 18.5.6. Distribution Channel
- 18.5.7. End-users
- 18.6. Rest of South America Interactive Entertainment Devices Market
- 18.6.1. Country Segmental Analysis
- 18.6.2. Product Type
- 18.6.3. Technology
- 18.6.4. Platform
- 18.6.5. Connectivity
- 18.6.6. Distribution Channel
- 18.6.7. End-users
- 19. Key Players/ Company Profile
- 19.1. Apple Inc.
- 19.1.1. Company Details/ Overview
- 19.1.2. Company Financials
- 19.1.3. Key Customers and Competitors
- 19.1.4. Business/ Industry Portfolio
- 19.1.5. Product Portfolio/ Specification Details
- 19.1.6. Pricing Data
- 19.1.7. Strategic Overview
- 19.1.8. Recent Developments
- 19.2. HTC Corporation (VIVE Division)
- 19.3. Meta Platforms, Inc.
- 19.4. Microsoft Corporation
- 19.5. Nintendo Co., Ltd.
- 19.6. PICO (a division of ByteDance)
- 19.7. Samsung Electronics Co., Ltd.
- 19.8. Sony Interactive Entertainment
- 19.9. Turtle Beach Corporation
- 19.10. Valve Corporation
- 19.11. XREAL, Inc.
- 19.12. Other Key Players
- 19.1. Apple Inc.
Note* - This is just tentative list of players. While providing the report, we will cover more number of players based on their revenue and share for each geography
Research Design
Our research design integrates both demand-side and supply-side analysis through a balanced combination of primary and secondary research methodologies. By utilizing both bottom-up and top-down approaches alongside rigorous data triangulation methods, we deliver robust market intelligence that supports strategic decision-making.
MarketGenics' comprehensive research design framework ensures the delivery of accurate, reliable, and actionable market intelligence. Through the integration of multiple research approaches, rigorous validation processes, and expert analysis, we provide our clients with the insights needed to make informed strategic decisions and capitalize on market opportunities.

MarketGenics leverages a dedicated industry panel of experts and a comprehensive suite of paid databases to effectively collect, consolidate, and analyze market intelligence.
Our approach has consistently proven to be reliable and effective in generating accurate market insights, identifying key industry trends, and uncovering emerging business opportunities.
Through both primary and secondary research, we capture and analyze critical company-level data such as manufacturing footprints, including technical centers, R&D facilities, sales offices, and headquarters.
Our expert panel further enhances our ability to estimate market size for specific brands based on validated field-level intelligence.
Our data mining techniques incorporate both parametric and non-parametric methods, allowing for structured data collection, sorting, processing, and cleaning.
Demand projections are derived from large-scale data sets analyzed through proprietary algorithms, culminating in robust and reliable market sizing.
Research Approach
The bottom-up approach builds market estimates by starting with the smallest addressable market units and systematically aggregating them to create comprehensive market size projections.
This method begins with specific, granular data points and builds upward to create the complete market landscape.
Customer Analysis → Segmental Analysis → Geographical Analysis
The top-down approach starts with the broadest possible market data and systematically narrows it down through a series of filters and assumptions to arrive at specific market segments or opportunities.
This method begins with the big picture and works downward to increasingly specific market slices.
TAM → SAM → SOM


Research Methods
Desk / Secondary Research
While analysing the market, we extensively study secondary sources, directories, and databases to identify and collect information useful for this technical, market-oriented, and commercial report. Secondary sources that we utilize are not only the public sources, but it is a combination of Open Source, Associations, Paid Databases, MG Repository & Knowledgebase, and others.
- Company websites, annual reports, financial reports, broker reports, and investor presentations
- National government documents, statistical databases and reports
- News articles, press releases and web-casts specific to the companies operating in the market, Magazines, reports, and others
- We gather information from commercial data sources for deriving company specific data such as segmental revenue, share for geography, product revenue, and others
- Internal and external proprietary databases (industry-specific), relevant patent, and regulatory databases
- Governing Bodies, Government Organizations
- Relevant Authorities, Country-specific Associations for Industries
We also employ the model mapping approach to estimate the product level market data through the players' product portfolio
Primary Research
Primary research/ interviews is vital in analyzing the market. Most of the cases involves paid primary interviews. Primary sources include primary interviews through e-mail interactions, telephonic interviews, surveys as well as face-to-face interviews with the different stakeholders across the value chain including several industry experts.
| Type of Respondents | Number of Primaries |
|---|---|
| Tier 2/3 Suppliers | ~20 |
| Tier 1 Suppliers | ~25 |
| End-users | ~25 |
| Industry Expert/ Panel/ Consultant | ~30 |
| Total | ~100 |
MG Knowledgebase
• Repository of industry blog, newsletter and case studies
• Online platform covering detailed market reports, and company profiles
Forecasting Factors and Models
Forecasting Factors
- Historical Trends – Past market patterns, cycles, and major events that shaped how markets behave over time. Understanding past trends helps predict future behavior.
- Industry Factors – Specific characteristics of the industry like structure, regulations, and innovation cycles that affect market dynamics.
- Macroeconomic Factors – Economic conditions like GDP growth, inflation, and employment rates that affect how much money people have to spend.
- Demographic Factors – Population characteristics like age, income, and location that determine who can buy your product.
- Technology Factors – How quickly people adopt new technology and how much technology infrastructure exists.
- Regulatory Factors – Government rules, laws, and policies that can help or restrict market growth.
- Competitive Factors – Analyzing competition structure such as degree of competition and bargaining power of buyers and suppliers.
Forecasting Models / Techniques
Multiple Regression Analysis
- Identify and quantify factors that drive market changes
- Statistical modeling to establish relationships between market drivers and outcomes
Time Series Analysis – Seasonal Patterns
- Understand regular cyclical patterns in market demand
- Advanced statistical techniques to separate trend, seasonal, and irregular components
Time Series Analysis – Trend Analysis
- Identify underlying market growth patterns and momentum
- Statistical analysis of historical data to project future trends
Expert Opinion – Expert Interviews
- Gather deep industry insights and contextual understanding
- In-depth interviews with key industry stakeholders
Multi-Scenario Development
- Prepare for uncertainty by modeling different possible futures
- Creating optimistic, pessimistic, and most likely scenarios
Time Series Analysis – Moving Averages
- Sophisticated forecasting for complex time series data
- Auto-regressive integrated moving average models with seasonal components
Econometric Models
- Apply economic theory to market forecasting
- Sophisticated economic models that account for market interactions
Expert Opinion – Delphi Method
- Harness collective wisdom of industry experts
- Structured, multi-round expert consultation process
Monte Carlo Simulation
- Quantify uncertainty and probability distributions
- Thousands of simulations with varying input parameters
Research Analysis
Our research framework is built upon the fundamental principle of validating market intelligence from both demand and supply perspectives. This dual-sided approach ensures comprehensive market understanding and reduces the risk of single-source bias.
Demand-Side Analysis: We understand end-user/application behavior, preferences, and market needs along with the penetration of the product for specific application.
Supply-Side Analysis: We estimate overall market revenue, analyze the segmental share along with industry capacity, competitive landscape, and market structure.
Validation & Evaluation
Data triangulation is a validation technique that uses multiple methods, sources, or perspectives to examine the same research question, thereby increasing the credibility and reliability of research findings. In market research, triangulation serves as a quality assurance mechanism that helps identify and minimize bias, validate assumptions, and ensure accuracy in market estimates.
- Data Source Triangulation – Using multiple data sources to examine the same phenomenon
- Methodological Triangulation – Using multiple research methods to study the same research question
- Investigator Triangulation – Using multiple researchers or analysts to examine the same data
- Theoretical Triangulation – Using multiple theoretical perspectives to interpret the same data

Custom Market Research Services
We will customise the research for you, in case the report listed above does not meet your requirements.
Get 10% Free Customisation