Personal Safety Devices Market Size, Share & Trends Analysis Report by Product Type (Wearable Safety Devices, Non-Wearable Safety Devices, Stationary / Installed Safety Devices, Mobile App-Integrated Safety Devices), Connectivity, Power Source, Form Factor, End-Users, Distribution Channel and Geography (North America, Europe, Asia Pacific, Middle East, Africa and South America) – Global Industry Data, Trends and Forecasts, 2026–2035
|
|
|
Segmental Data Insights |
|
|
Demand Trends |
|
|
Competitive Landscape |
|
|
Strategic Development |
|
|
Future Outlook & Opportunities |
|
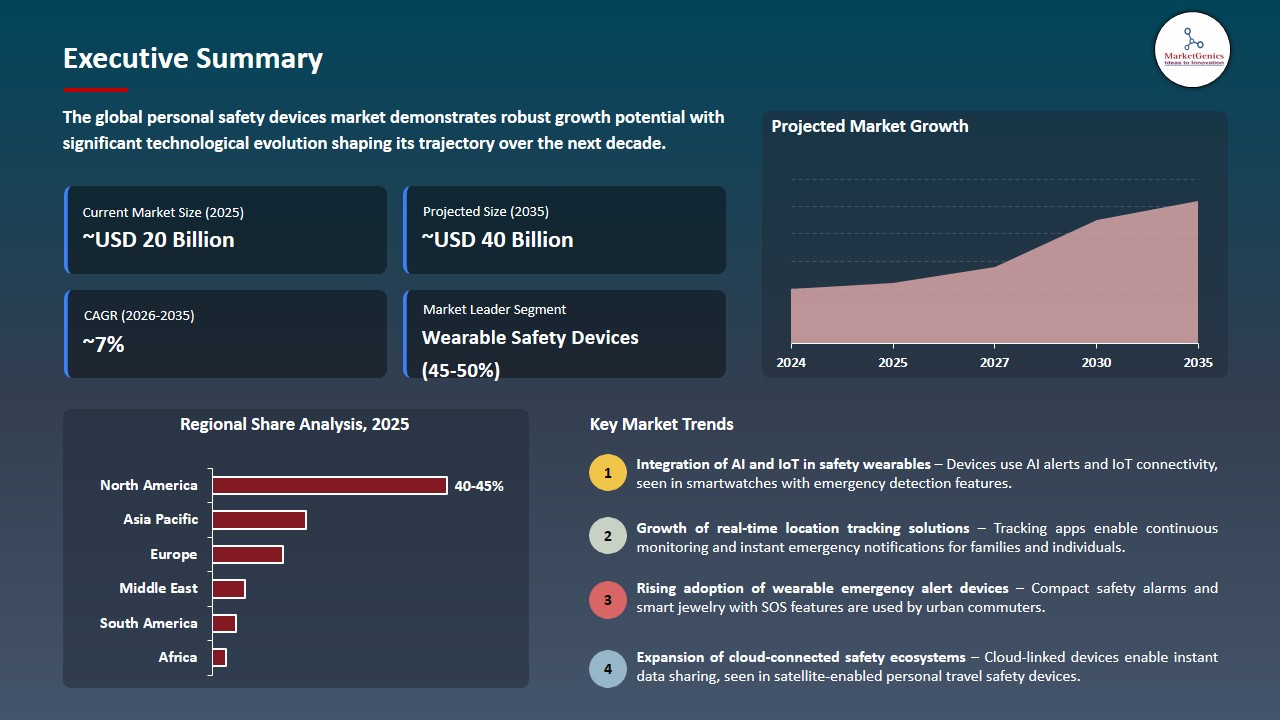
Personal Safety Devices Market Size, Share, and Growth
The global personal safety devices market is exhibiting strong growth, with an estimated value of USD 20.2 billion in 2025 and USD 40.1 billion by 2035, achieving a CAGR of 7.1%, during the forecast period. Asia Pacific is the fastest-growing region in the personal safety devices market due to rapid urbanization, rising smartphone penetration, increasing safety awareness, expanding wearable adoption, and growing investments in smart security technologies.
"Retail organizations are looking to strengthen front-line worker safety, deter confrontation and improve incident visibility," said Paul Bremner, practice lead and principal analyst, Omdia. "They are increasingly looking to physical security technologies, not only as protective tools, but as enablers of operational efficiency. With technologies like AI assistants being integrated directly onto body cameras, Omdia sees that body worn video can help connect front-line events with faster, coordinated responses and provide stronger evidence capture."
The growth of personal safety solutions in the consumer market is being fueled by the integration of emergency response capabilities in mainstream wearable devices. For instance, Apple Inc. states Emergency SOS, Fall Detection and Crash Detection are features of Apple Watch, and iPhone 14 and later detects severe vehicle crashes and notifies emergency services. This integration is greatly improving consumer trust and paving the way for mass consumer adoption of personal safety devices in the wearable space.
In addition, the increasing demand for safety solutions with satellite connectivity is emerging as one of the fastest-growing drivers for the personal safety devices market. For example, Garmin's inReaches can allow the user to transmit an interactive SOS with GPS coordinates to Garmin Response, with 24/7 emergency monitoring and SOS dispatch, all in a GPS-based system. This is driving adoption of dependable off-grid safety solutions, and broadening market penetration into segments like out-of-building and offsite workers.
The adjacent opportunities for the global personal safety devices market include smart wearable healthcare monitoring, AI-based emergency response platforms, connected vehicle safety systems, IoT-based home security solutions, and enterprise lone-worker protection technologies. These adjacent markets leverage similar connectivity, sensors, and real-time alerts, expanding application scope beyond personal use. This convergence is accelerating ecosystem integration and cross-industry adoption growth.
Personal Safety Devices Market Dynamics and Trends
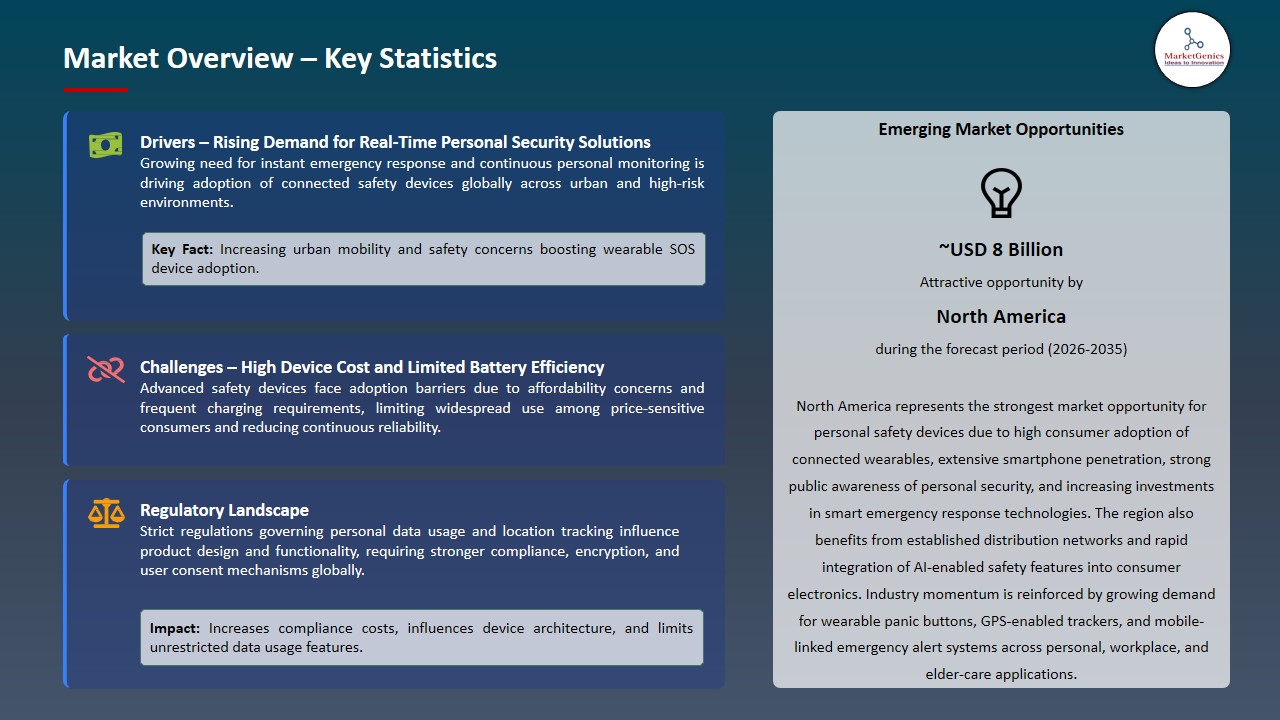
Driver: Rising Adoption of AI-Integrated Wearable Emergency Response Ecosystems Across Urban Workforce Networks
- AI-powered personal safety devices are driving significant growth in the market as safety systems are increasingly being adopted in industrial, healthcare, logistics, and consumer applications. Increased awareness over lone-worker safety, urban security threats, and delayed emergency response are contributing to the growing use of GPS enabled devices with biometric monitoring, geofencing, and automated SOS (Save-On-Situ) notifications.
- These solutions are now becoming part and parcel of enterprise workforce management solutions, which allow for real-time incident escalation and better compliance monitoring. For instance, Blackline Safety introduced its G8 wearable device with satellite connectivity and gas detection capabilities in January 2026, which increases worker safety in remote and non-cellular work, such as energy and mining operations.
- AI-powered functionalities for emergency response are playing a key role in driving the adoption of connected personal safety devices in various end-use sectors.
Restraint: Persistent Battery Reliability Limitations Restricting Continuous Real-Time Monitoring Device Performance Efficiency
- The market faces significant challenges related to battery endurance and uninterrupted connectivity in advanced personal safety devices, as power-intensive functions like GPS tracking, biometric monitoring, cloud syncing, AI alerts, and cellular communication reduce overall device runtime and increase charging dependency.
- This limitation is particularly important in Industrial, Outdoor and Remote applications that demand uninterrupted protection, as device downtimes can cause delays in emergency response and affect user trust, and manufacturers are constrained in design flexibility due to the need to ensure compact design and battery longevity.
- Although significant progress has been made in low-power chipsets and energy-efficient communication technologies, extending durations of autonomy without compromising performance is difficult, and users are reluctant to employ these technologies in high-risk safety applications that demand continuous monitoring.
- The adoption of continuous monitoring personal safety devices used in mission-critical applications remains restricted because of battery and connectivity limitations.
Opportunity: Expanding Elderly Monitoring Infrastructure Creating Advanced Remote Personal Safety Device Demand Worldwide
- The aging population and the digitization of healthcare are providing huge potential in the personal safety device space as governments, healthcare providers and insurers are increasingly turning to remote monitoring to combine fall detection with emergency alerts, GPS tracking, health tracking and caregiver connectivity in wearable devices.
- The rise of smart safety wearables that can alert emergency responders in real-time and growing demand for home-based care is driving a greater need for the technology; manufacturers are leveraging AI-powered health tools and satellite communication to boost use in mature markets such as North America and Japan.
- For instance, Apple Watch's satellite Emergency SOS function proved to be a lifesaver in 2025 when it was used to find someone in an emergency in a remote area, highlighting the importance of cutting-edge wearable safety technology.
- The growing digitization of elderly care is fueling global demand for intelligent wearable safety and emergency response systems. The elderly-care digitization is prompting continued global demand for intelligent wearable safety and emergency response systems.
Key Trend: Convergence of Satellite Connectivity and Multi-Sensor Wearables Transforming Personal Protection Technologies Globally
- Satellite connectivity, AI analytics, IoT and multi-sensor wearable technologies are converging well in the market, allowing for GPS, gas detection, biometric monitoring, fall detection and emergency alerts to be combined onto a single platform.
- Personal safety devices are being used in industrial, healthcare, defense, and consumer safety applications, which improves real-time monitoring and low-latency emergency response. The arrival of 5G and miniaturization is also facilitating wearable safety solutions that link more discreetly.
- Ecosystems and subscription models are becoming more prevalent as businesses look to enhance competitiveness and recurring revenue streams. This shift is accelerating the transformation of standalone devices into fully connected safety networks with continuous monitoring capabilities.
- Multi-functional connected wearables are transforming personal safety devices from simple alarms to intelligent real-time protection systems.
Personal Safety Devices Market Analysis and Segmental Data
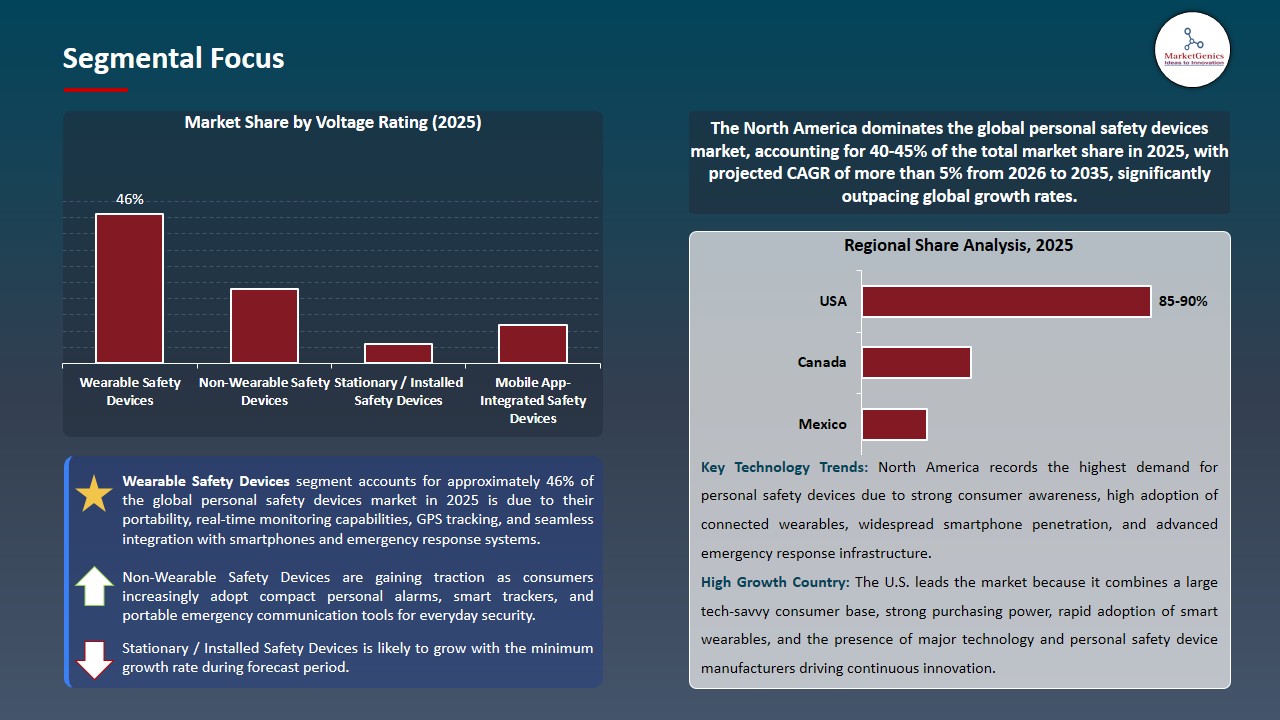
Wearable Safety Devices Dominate Global Personal Safety Devices Market
- The wearable safety devices segment dominates the global personal safety devices market as it offers continuous real-time monitoring, GPS-based location tracking, fall detection, health monitoring and instant SOS communication in a compact and user-friendly form factor. They are very useful in personal, occupational and elderly care applications, as they can provide instant protection warnings and location data.
- The leadership of the segment is reinforced by the ability to work with smartphones, cloud systems, and emergency response systems. Connected wearables, as well as the new advancements in sensor technology and battery life and wireless connectivity, are increasing their use in both developed and emerging markets.
- For instance, Garmin Ltd. released the Instinct 3 Series smartwatch in January 2025, which includes multi-band GPS, 24/7 health monitoring, incident detection, assistance alerts, Live Track functionality and smart connectivity. The launch exemplifies the increasing advancement of safety features in wearables, further improving user safety and real-time awareness.
- Wearable safety technology is continuously evolving and driving higher adoption rates and further strengthening the segment's market share in the global personal safety devices market.
North America Leads Global Personal Safety Devices Market Demand
- North America dominate the personal safety devices market is dominated by the robust adoption of smart wearables, GPS-enabled tracking devices, and AI-based emergency response solutions, coupled with the advanced technology awareness, the willingness of consumers to pay premium prices, and increased focus on real-time personal security.
- Furthermore, advanced public safety infrastructure, large penetration of smartphones, and increasing investment in connected health and security technology drive the region's leadership in personal safety device adoption and make it possible to integrate seamless emergency alerts, real-time monitoring, location tracking and rapid response across a range of end-user segments.
- North America's market stands to grow at a rapid pace, with strong technology adoption, cutting-edge safety technology, and ongoing innovation in connected security solutions providing a competitive advantage and setting the standard for personal safety device development.
Personal Safety Devices Market Ecosystem
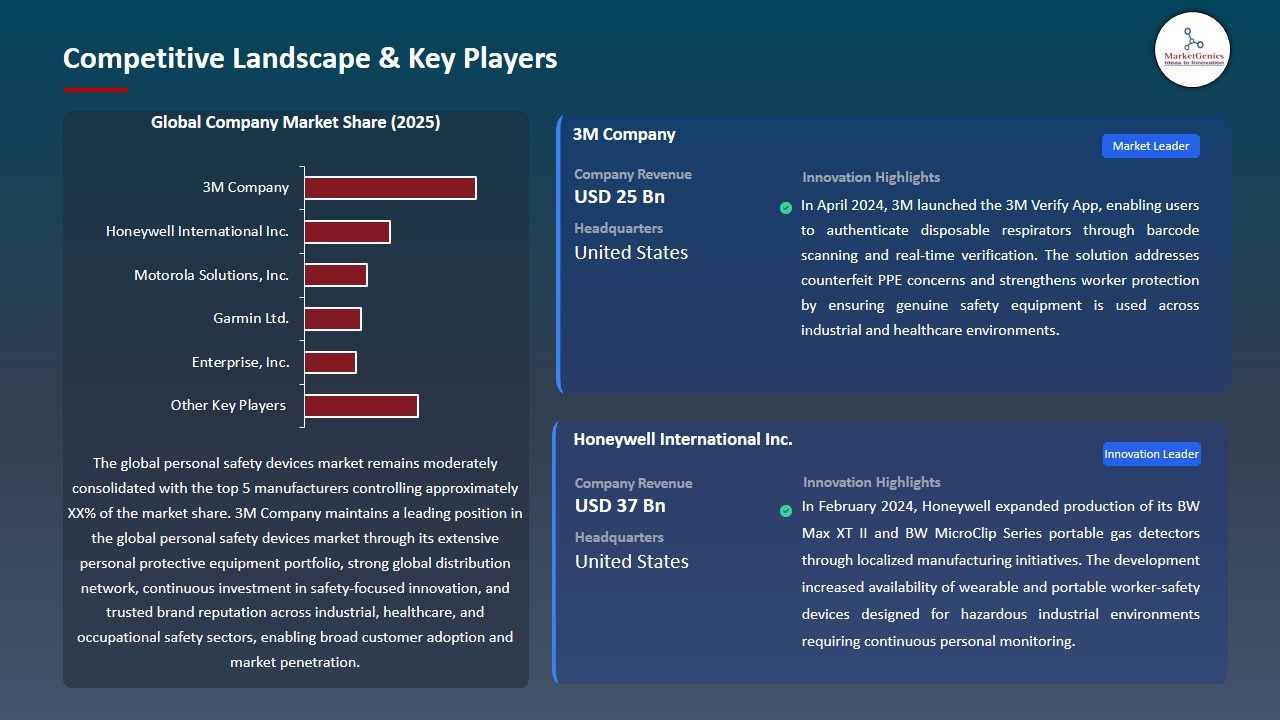
The global personal safety devices market is moderately fragmented, with leading companies such as 3M Company, Honeywell International Inc., Motorola Solutions, Inc., Garmin Ltd., and Enterprise Safety Solutions maintaining significant market influence through advanced wearable technologies, real-time monitoring systems, connected safety platforms, and AI-enabled emergency response capabilities. They also benefit from comprehensive product lines, established distribution channels, and ongoing efforts in digital safety technology, which help them remain competitive in a variety of markets, including consumer, industrial, healthcare, and public-safety.
These market leaders are increasingly targeting specific user needs with their specialized solutions. Garmin focuses on satellite communications for personal safety wearables that include SOS communication and location tracking features, while Motorola Solutions builds in-body-worn communication and situational-awareness solutions for first responders. Honeywell remains a leader in portable gas detection and worker-safety monitoring instruments and 3M continues to push the envelope on smart PPE and worker-safety connected solutions.
Innovation through the use of AI-powered wearables and connected safety solutions are contributing to smart security device market growth, with real-time protection enhanced.
 Recent Development and Strategic Overview:
- In June 2026, Motorola Solutions launched SafetyCam, a wearable AI-enabled safety device integrating video security, two-way voice communication, panic alert, and Assist AI into a single unit for retail and frontline workers, enabling proactive threat detection, real-time intervention, and enhanced situational awareness across enterprise safety environments.
- In January 2026, Apple introduced an upgraded AirTag featuring expanded Precision Finding range, louder alert sound, and improved Ultra-Wideband integration through the next-generation Find My network. The update enhances personal safety use cases by improving real-time object and personal location recovery in emergencies and travel-related incidents.
Report Scope
|
Detail |
|
|
Market Size in 2025 |
USD 20.2 Bn |
|
Market Forecast Value in 2035 |
USD 40.1 Bn |
|
Growth Rate (CAGR) |
7.1% |
|
Forecast Period |
2026 – 2035 |
|
Historical Data Available for |
2021 – 2024 |
|
Market Size Units |
US$ Billion for Value Thousand Units for Volume |
|
Report Format |
Electronic (PDF) + Excel |
|
North America |
Europe |
Asia Pacific |
Middle East |
Africa |
South America |
|
|
|
|
|
|
|
Companies Covered |
|||||
|
|
|
||||
Personal Safety Devices Market Segmentation and Highlights
|
Segment |
Sub-segment |
|
Personal Safety Devices Market, By Product Type |
|
|
Personal Safety Devices Market, By Connectivity |
|
|
Personal Safety Devices Market, By Power Source |
|
|
Personal Safety Devices Market, By Form Factor |
|
|
Personal Safety Devices Market, By End-Users |
|
|
Personal Safety Devices Market, By Distribution Channel |
|
Frequently Asked Questions
Table of Contents
- 1. Research Methodology and Assumptions
- 1.1. Definitions
- 1.2. Research Design and Approach
- 1.3. Data Collection Methods
- 1.4. Base Estimates and Calculations
- 1.5. Forecasting Models
- 1.5.1. Key Forecast Factors & Impact Analysis
- 1.6. Secondary Research
- 1.6.1. Open Sources
- 1.6.2. Paid Databases
- 1.6.3. Associations
- 1.7. Primary Research
- 1.7.1. Primary Sources
- 1.7.2. Primary Interviews with Stakeholders across Ecosystem
- 2. Executive Summary
- 2.1. Global Personal Safety Devices Market Outlook
- 2.1.1. Personal Safety Devices Market Size (Volume - Thousand Units & Value - US$ Bn), and Forecasts, 2021-2035
- 2.1.2. Compounded Annual Growth Rate Analysis
- 2.1.3. Growth Opportunity Analysis
- 2.1.4. Segmental Share Analysis
- 2.1.5. Geographical Share Analysis
- 2.2. Market Analysis and Facts
- 2.3. Supply-Demand Analysis
- 2.4. Competitive Benchmarking
- 2.5. Go-to- Market Strategy
- 2.5.1. Customer/ End-use Industry Assessment
- 2.5.2. Growth Opportunity Data, 2026-2035
- 2.5.2.1. Regional Data
- 2.5.2.2. Country Data
- 2.5.2.3. Segmental Data
- 2.5.3. Identification of Potential Market Spaces
- 2.5.4. GAP Analysis
- 2.5.5. Potential Attractive Price Points
- 2.5.6. Prevailing Market Risks & Challenges
- 2.5.7. Preferred Sales & Marketing Strategies
- 2.5.8. Key Recommendations and Analysis
- 2.5.9. A Way Forward
- 2.1. Global Personal Safety Devices Market Outlook
- 3. Industry Data and Premium Insights
- 3.1. Global Consumer Goods & Services Industry Overview, 2025
- 3.1.1. Consumer Goods & Services Ecosystem Analysis
- 3.1.2. Key Trends for Consumer Goods & Services Industry
- 3.1.3. Regional Distribution for Consumer Goods & Services Industry
- 3.2. Supplier Customer Data
- 3.3. Technology Roadmap and Developments
- 3.4. Trade Analysis
- 3.4.1. Import & Export Analysis, 2025
- 3.4.2. Top Importing Countries
- 3.4.3. Top Exporting Countries
- 3.5. Trump Tariff Impact Analysis
- 3.5.1. Manufacturer
- 3.5.1.1. Based on the component & Raw material
- 3.5.2. Supply Chain
- 3.5.3. End Consumer
- 3.5.1. Manufacturer
- 3.1. Global Consumer Goods & Services Industry Overview, 2025
- 4. Market Overview
- 4.1. Market Dynamics
- 4.1.1. Drivers
- 4.1.1.1. Rising Awareness of Personal Security and Emergency Preparedness
- 4.1.1.2. Growing Adoption of Connected Wearable Safety Devices
- 4.1.1.3. Expansion of Smart City and Public Safety Programs
- 4.1.2. Restraints
- 4.1.2.1. Privacy Concerns Over Location Tracking and Data Collection
- 4.1.2.2. Battery Reliability Limitations During Emergency Situations
- 4.1.1. Drivers
- 4.2. Key Trend Analysis
- 4.3. Regulatory Framework
- 4.3.1. Key Regulations, Norms, and Subsidies, by Key Countries
- 4.3.2. Tariffs and Standards
- 4.3.3. Impact Analysis of Regulations on the Market
- 4.4. Value Chain Analysis
- 4.4.1. Component Supplier
- 4.4.2. Personal Safety Device Manufacturers
- 4.4.3. Distributors & Wholesalers
- 4.4.4. End Users
- 4.5. Porter’s Five Forces Analysis
- 4.6. PESTEL Analysis
- 4.7. Global Personal Safety Devices Market Demand
- 4.7.1. Historical Market Size – in Volume (Thousand Units) and Value (US$ Bn), 2020-2024
- 4.7.2. Current and Future Market Size – in Volume (Thousand Units) and Value (US$ Bn), 2026–2035
- 4.7.2.1. Y-o-Y Growth Trends
- 4.7.2.2. Absolute $ Opportunity Assessment
- 4.1. Market Dynamics
- 5. Competition Landscape
- 5.1. Competition structure
- 5.1.1. Fragmented v/s consolidated
- 5.2. Company Share Analysis, 2025
- 5.2.1. Global Company Market Share
- 5.2.2. By Region
- 5.2.2.1. North America
- 5.2.2.2. Europe
- 5.2.2.3. Asia Pacific
- 5.2.2.4. Middle East
- 5.2.2.5. Africa
- 5.2.2.6. South America
- 5.3. Product Comparison Matrix
- 5.3.1. Specifications
- 5.3.2. Market Positioning
- 5.3.3. Pricing
- 5.1. Competition structure
- 6. Global Personal Safety Devices Market Analysis, by Product Type
- 6.1. Key Segment Analysis
- 6.2. Personal Safety Devices Market Size (Volume - Thousand Units & Value - US$ Bn), Analysis, and Forecasts, by Product Type, 2021-2035
- 6.2.1. Wearable Safety Devices
- 6.2.1.1. Smart Watches with SOS Features
- 6.2.1.2. Personal Alarm Devices
- 6.2.1.3. GPS Tracking Devices
- 6.2.1.4. Safety Rings & Bracelets
- 6.2.1.5. Body-Worn Cameras
- 6.2.1.6. Smart Helmets
- 6.2.1.7. Others
- 6.2.2. Non-Wearable Safety Devices
- 6.2.2.1. Handheld Personal Alarms
- 6.2.2.2. Pepper Sprays & Defense Sprays
- 6.2.2.3. Stun Guns & Tasers
- 6.2.2.4. Dash Cams & Portable Cameras
- 6.2.2.5. Others
- 6.2.3. Stationary / Installed Safety Devices
- 6.2.3.1. Panic Buttons (Fixed)
- 6.2.3.2. Duress Alarm Systems
- 6.2.3.3. Emergency Pull Cords
- 6.2.3.4. Others
- 6.2.4. Mobile App-Integrated Safety Devices
- 6.2.1. Wearable Safety Devices
- 7. Global Personal Safety Devices Market Analysis, by Connectivity
- 7.1. Key Segment Analysis
- 7.2. Personal Safety Devices Market Size (Volume - Thousand Units & Value - US$ Bn), Analysis, and Forecasts, by Connectivity, 2021-2035
- 7.2.1. Standalone Devices
- 7.2.2. Connected Devices
- 7.2.3. Smartphone-Integrated
- 7.2.4. Cloud-Platform Connected
- 7.2.5. Emergency Response Network-Connected
- 8. Global Personal Safety Devices Market Analysis, by Power Source
- 8.1. Key Segment Analysis
- 8.2. Personal Safety Devices Market Size (Volume - Thousand Units & Value - US$ Bn), Analysis, and Forecasts, by Power Source, 2021-2035
- 8.2.1. Battery-Operated Devices
- 8.2.2. Solar-Powered Devices
- 8.2.3. Motion-Powered Devices
- 8.2.4. Wired/Plug-in Devices
- 9. Global Personal Safety Devices Market Analysis, by Form Factor
- 9.1. Key Segment Analysis
- 9.2. Personal Safety Devices Market Size (Volume - Thousand Units & Value - US$ Bn), Analysis, and Forecasts, by Form Factor, 2021-2035
- 9.2.1. Wrist-Worn
- 9.2.2. Clip-On / Belt-Worn Devices
- 9.2.3. Ring-Form Devices
- 9.2.4. Handheld Devices
- 9.2.5. Apparel-Integrated
- 9.2.6. Necklace-Style Devices
- 9.2.7. Others
- 10. Global Personal Safety Devices Market Analysis, by End-Users
- 10.1. Key Segment Analysis
- 10.2. Personal Safety Devices Market Size (Volume - Thousand Units & Value - US$ Bn), Analysis, and Forecasts, by End-Users, 2021-2035
- 10.2.1. Individual Users
- 10.2.1.1. Women & Solo Travelers
- 10.2.1.2. Elderly Population
- 10.2.1.3. Children & Minors
- 10.2.1.4. Outdoor Enthusiasts & Hikers
- 10.2.1.5. Physically Challenged Individuals
- 10.2.1.6. Others
- 10.2.2. Commercial/Enterprise Users
- 10.2.2.1. Corporate Employees
- 10.2.2.2. Healthcare Professionals
- 10.2.2.3. Construction & Industrial Workers
- 10.2.2.4. Others
- 10.2.3. Government & Public Safety Users
- 10.2.3.1. Law Enforcement Personnel
- 10.2.3.2. Military & Defense Personnel
- 10.2.3.3. First Responders
- 10.2.3.4. Others
- 10.2.1. Individual Users
- 11. Global Personal Safety Devices Market Analysis, by Distribution Channel
- 11.1. Key Segment Analysis
- 11.2. Personal Safety Devices Market Size (Volume - Thousand Units & Value - US$ Bn), Analysis, and Forecasts, by Distribution Channel, 2021-2035
- 11.2.1. Online Channels
- 11.2.2. Offline Channels
- 12. Global Personal Safety Devices Market Analysis, by Region
- 12.1. Key Findings
- 12.2. Personal Safety Devices Market Size (Volume - Thousand Units & Value - US$ Bn), Analysis, and Forecasts, by Region, 2021-2035
- 12.2.1. North America
- 12.2.2. Europe
- 12.2.3. Asia Pacific
- 12.2.4. Middle East
- 12.2.5. Africa
- 12.2.6. South America
- 13. North America Personal Safety Devices Market Analysis
- 13.1. Key Segment Analysis
- 13.2. Regional Snapshot
- 13.3. North America Personal Safety Devices Market Size (Volume - Thousand Units & Value - US$ Bn), Analysis, and Forecasts, 2021-2035
- 13.3.1. Product Type
- 13.3.2. Connectivity
- 13.3.3. Power Source
- 13.3.4. Form Factor
- 13.3.5. End-Users
- 13.3.6. Distribution Channel
- 13.3.7. Country
- 13.3.7.1. USA
- 13.3.7.2. Canada
- 13.3.7.3. Mexico
- 13.4. USA Personal Safety Devices Market
- 13.4.1. Country Segmental Analysis
- 13.4.2. Product Type
- 13.4.3. Connectivity
- 13.4.4. Power Source
- 13.4.5. Form Factor
- 13.4.6. End-Users
- 13.4.7. Distribution Channel
- 13.5. Canada Personal Safety Devices Market
- 13.5.1. Country Segmental Analysis
- 13.5.2. Product Type
- 13.5.3. Connectivity
- 13.5.4. Power Source
- 13.5.5. Form Factor
- 13.5.6. End-Users
- 13.5.7. Distribution Channel
- 13.6. Mexico Personal Safety Devices Market
- 13.6.1. Country Segmental Analysis
- 13.6.2. Product Type
- 13.6.3. Connectivity
- 13.6.4. Power Source
- 13.6.5. Form Factor
- 13.6.6. End-Users
- 13.6.7. Distribution Channel
- 14. Europe Personal Safety Devices Market Analysis
- 14.1. Key Segment Analysis
- 14.2. Regional Snapshot
- 14.3. Europe Personal Safety Devices Market Size (Volume - Thousand Units & Value - US$ Bn), Analysis, and Forecasts, 2021-2035
- 14.3.1. Product Type
- 14.3.2. Connectivity
- 14.3.3. Power Source
- 14.3.4. Form Factor
- 14.3.5. End-Users
- 14.3.6. Distribution Channel
- 14.3.7. Country
- 14.3.7.1. Germany
- 14.3.7.2. United Kingdom
- 14.3.7.3. France
- 14.3.7.4. Italy
- 14.3.7.5. Spain
- 14.3.7.6. Netherlands
- 14.3.7.7. Nordic Countries
- 14.3.7.8. Poland
- 14.3.7.9. Russia & CIS
- 14.3.7.10. Rest of Europe
- 14.4. Germany Personal Safety Devices Market
- 14.4.1. Country Segmental Analysis
- 14.4.2. Product Type
- 14.4.3. Connectivity
- 14.4.4. Power Source
- 14.4.5. Form Factor
- 14.4.6. End-Users
- 14.4.7. Distribution Channel
- 14.5. United Kingdom Personal Safety Devices Market
- 14.5.1. Country Segmental Analysis
- 14.5.2. Product Type
- 14.5.3. Connectivity
- 14.5.4. Power Source
- 14.5.5. Form Factor
- 14.5.6. End-Users
- 14.5.7. Distribution Channel
- 14.6. France Personal Safety Devices Market
- 14.6.1. Country Segmental Analysis
- 14.6.2. Product Type
- 14.6.3. Connectivity
- 14.6.4. Power Source
- 14.6.5. Form Factor
- 14.6.6. End-Users
- 14.6.7. Distribution Channel
- 14.7. Italy Personal Safety Devices Market
- 14.7.1. Country Segmental Analysis
- 14.7.2. Product Type
- 14.7.3. Connectivity
- 14.7.4. Power Source
- 14.7.5. Form Factor
- 14.7.6. End-Users
- 14.7.7. Distribution Channel
- 14.8. Spain Personal Safety Devices Market
- 14.8.1. Country Segmental Analysis
- 14.8.2. Product Type
- 14.8.3. Connectivity
- 14.8.4. Power Source
- 14.8.5. Form Factor
- 14.8.6. End-Users
- 14.8.7. Distribution Channel
- 14.9. Netherlands Personal Safety Devices Market
- 14.9.1. Country Segmental Analysis
- 14.9.2. Product Type
- 14.9.3. Connectivity
- 14.9.4. Power Source
- 14.9.5. Form Factor
- 14.9.6. End-Users
- 14.9.7. Distribution Channel
- 14.10. Nordic Countries Personal Safety Devices Market
- 14.10.1. Country Segmental Analysis
- 14.10.2. Product Type
- 14.10.3. Connectivity
- 14.10.4. Power Source
- 14.10.5. Form Factor
- 14.10.6. End-Users
- 14.10.7. Distribution Channel
- 14.11. Poland Personal Safety Devices Market
- 14.11.1. Country Segmental Analysis
- 14.11.2. Product Type
- 14.11.3. Connectivity
- 14.11.4. Power Source
- 14.11.5. Form Factor
- 14.11.6. End-Users
- 14.11.7. Distribution Channel
- 14.12. Russia & CIS Personal Safety Devices Market
- 14.12.1. Country Segmental Analysis
- 14.12.2. Product Type
- 14.12.3. Connectivity
- 14.12.4. Power Source
- 14.12.5. Form Factor
- 14.12.6. End-Users
- 14.12.7. Distribution Channel
- 14.13. Rest of Europe Personal Safety Devices Market
- 14.13.1. Country Segmental Analysis
- 14.13.2. Product Type
- 14.13.3. Connectivity
- 14.13.4. Power Source
- 14.13.5. Form Factor
- 14.13.6. End-Users
- 14.13.7. Distribution Channel
- 15. Asia Pacific Personal Safety Devices Market Analysis
- 15.1. Key Segment Analysis
- 15.2. Regional Snapshot
- 15.3. Asia Pacific Personal Safety Devices Market Size (Volume - Thousand Units & Value - US$ Bn), Analysis, and Forecasts, 2021-2035
- 15.3.1. Product Type
- 15.3.2. Connectivity
- 15.3.3. Power Source
- 15.3.4. Form Factor
- 15.3.5. End-Users
- 15.3.6. Distribution Channel
- 15.3.7. Country
- 15.3.7.1. China
- 15.3.7.2. India
- 15.3.7.3. Japan
- 15.3.7.4. South Korea
- 15.3.7.5. Australia and New Zealand
- 15.3.7.6. Indonesia
- 15.3.7.7. Malaysia
- 15.3.7.8. Thailand
- 15.3.7.9. Vietnam
- 15.3.7.10. Rest of Asia Pacific
- 15.4. China Personal Safety Devices Market
- 15.4.1. Country Segmental Analysis
- 15.4.2. Product Type
- 15.4.3. Connectivity
- 15.4.4. Power Source
- 15.4.5. Form Factor
- 15.4.6. End-Users
- 15.4.7. Distribution Channel
- 15.5. India Personal Safety Devices Market
- 15.5.1. Country Segmental Analysis
- 15.5.2. Product Type
- 15.5.3. Connectivity
- 15.5.4. Power Source
- 15.5.5. Form Factor
- 15.5.6. End-Users
- 15.5.7. Distribution Channel
- 15.6. Japan Personal Safety Devices Market
- 15.6.1. Country Segmental Analysis
- 15.6.2. Product Type
- 15.6.3. Connectivity
- 15.6.4. Power Source
- 15.6.5. Form Factor
- 15.6.6. End-Users
- 15.6.7. Distribution Channel
- 15.7. South Korea Personal Safety Devices Market
- 15.7.1. Country Segmental Analysis
- 15.7.2. Product Type
- 15.7.3. Connectivity
- 15.7.4. Power Source
- 15.7.5. Form Factor
- 15.7.6. End-Users
- 15.7.7. Distribution Channel
- 15.8. Australia and New Zealand Personal Safety Devices Market
- 15.8.1. Country Segmental Analysis
- 15.8.2. Product Type
- 15.8.3. Connectivity
- 15.8.4. Power Source
- 15.8.5. Form Factor
- 15.8.6. End-Users
- 15.8.7. Distribution Channel
- 15.9. Indonesia Personal Safety Devices Market
- 15.9.1. Country Segmental Analysis
- 15.9.2. Product Type
- 15.9.3. Connectivity
- 15.9.4. Power Source
- 15.9.5. Form Factor
- 15.9.6. End-Users
- 15.9.7. Distribution Channel
- 15.10. Malaysia Personal Safety Devices Market
- 15.10.1. Country Segmental Analysis
- 15.10.2. Product Type
- 15.10.3. Connectivity
- 15.10.4. Power Source
- 15.10.5. Form Factor
- 15.10.6. End-Users
- 15.10.7. Distribution Channel
- 15.11. Thailand Personal Safety Devices Market
- 15.11.1. Country Segmental Analysis
- 15.11.2. Product Type
- 15.11.3. Connectivity
- 15.11.4. Power Source
- 15.11.5. Form Factor
- 15.11.6. End-Users
- 15.11.7. Distribution Channel
- 15.12. Vietnam Personal Safety Devices Market
- 15.12.1. Country Segmental Analysis
- 15.12.2. Product Type
- 15.12.3. Connectivity
- 15.12.4. Power Source
- 15.12.5. Form Factor
- 15.12.6. End-Users
- 15.12.7. Distribution Channel
- 15.13. Rest of Asia Pacific Personal Safety Devices Market
- 15.13.1. Country Segmental Analysis
- 15.13.2. Product Type
- 15.13.3. Connectivity
- 15.13.4. Power Source
- 15.13.5. Form Factor
- 15.13.6. End-Users
- 15.13.7. Distribution Channel
- 16. Middle East Personal Safety Devices Market Analysis
- 16.1. Key Segment Analysis
- 16.2. Regional Snapshot
- 16.3. Middle East Personal Safety Devices Market Size (Volume - Thousand Units & Value - US$ Bn), Analysis, and Forecasts, 2021-2035
- 16.3.1. Product Type
- 16.3.2. Connectivity
- 16.3.3. Power Source
- 16.3.4. Form Factor
- 16.3.5. End-Users
- 16.3.6. Distribution Channel
- 16.3.7. Country
- 16.3.7.1. Turkey
- 16.3.7.2. UAE
- 16.3.7.3. Saudi Arabia
- 16.3.7.4. Israel
- 16.3.7.5. Rest of Middle East
- 16.4. Turkey Personal Safety Devices Market
- 16.4.1. Country Segmental Analysis
- 16.4.2. Product Type
- 16.4.3. Connectivity
- 16.4.4. Power Source
- 16.4.5. Form Factor
- 16.4.6. End-Users
- 16.4.7. Distribution Channel
- 16.5. UAE Personal Safety Devices Market
- 16.5.1. Country Segmental Analysis
- 16.5.2. Product Type
- 16.5.3. Connectivity
- 16.5.4. Power Source
- 16.5.5. Form Factor
- 16.5.6. End-Users
- 16.5.7. Distribution Channel
- 16.6. Saudi Arabia Personal Safety Devices Market
- 16.6.1. Country Segmental Analysis
- 16.6.2. Product Type
- 16.6.3. Connectivity
- 16.6.4. Power Source
- 16.6.5. Form Factor
- 16.6.6. End-Users
- 16.6.7. Distribution Channel
- 16.7. Israel Personal Safety Devices Market
- 16.7.1. Country Segmental Analysis
- 16.7.2. Product Type
- 16.7.3. Connectivity
- 16.7.4. Power Source
- 16.7.5. Form Factor
- 16.7.6. End-Users
- 16.7.7. Distribution Channel
- 16.8. Rest of Middle East Personal Safety Devices Market
- 16.8.1. Country Segmental Analysis
- 16.8.2. Product Type
- 16.8.3. Connectivity
- 16.8.4. Power Source
- 16.8.5. Form Factor
- 16.8.6. End-Users
- 16.8.7. Distribution Channel
- 17. Africa Personal Safety Devices Market Analysis
- 17.1. Key Segment Analysis
- 17.2. Regional Snapshot
- 17.3. Africa Personal Safety Devices Market Size (Volume - Thousand Units & Value - US$ Bn), Analysis, and Forecasts, 2021-2035
- 17.3.1. Product Type
- 17.3.2. Connectivity
- 17.3.3. Power Source
- 17.3.4. Form Factor
- 17.3.5. End-Users
- 17.3.6. Distribution Channel
- 17.3.7. Country
- 17.3.7.1. South Africa
- 17.3.7.2. Egypt
- 17.3.7.3. Nigeria
- 17.3.7.4. Algeria
- 17.3.7.5. Rest of Africa
- 17.4. South Africa Personal Safety Devices Market
- 17.4.1. Country Segmental Analysis
- 17.4.2. Product Type
- 17.4.3. Connectivity
- 17.4.4. Power Source
- 17.4.5. Form Factor
- 17.4.6. End-Users
- 17.4.7. Distribution Channel
- 17.5. Egypt Personal Safety Devices Market
- 17.5.1. Country Segmental Analysis
- 17.5.2. Product Type
- 17.5.3. Connectivity
- 17.5.4. Power Source
- 17.5.5. Form Factor
- 17.5.6. End-Users
- 17.5.7. Distribution Channel
- 17.6. Nigeria Personal Safety Devices Market
- 17.6.1. Country Segmental Analysis
- 17.6.2. Product Type
- 17.6.3. Connectivity
- 17.6.4. Power Source
- 17.6.5. Form Factor
- 17.6.6. End-Users
- 17.6.7. Distribution Channel
- 17.7. Algeria Personal Safety Devices Market
- 17.7.1. Country Segmental Analysis
- 17.7.2. Product Type
- 17.7.3. Connectivity
- 17.7.4. Power Source
- 17.7.5. Form Factor
- 17.7.6. End-Users
- 17.7.7. Distribution Channel
- 17.8. Rest of Africa Personal Safety Devices Market
- 17.8.1. Country Segmental Analysis
- 17.8.2. Product Type
- 17.8.3. Connectivity
- 17.8.4. Power Source
- 17.8.5. Form Factor
- 17.8.6. End-Users
- 17.8.7. Distribution Channel
- 18. South America Personal Safety Devices Market Analysis
- 18.1. Key Segment Analysis
- 18.2. Regional Snapshot
- 18.3. South America Personal Safety Devices Market Size (Volume - Thousand Units & Value - US$ Bn), Analysis, and Forecasts, 2021-2035
- 18.3.1. Product Type
- 18.3.2. Connectivity
- 18.3.3. Power Source
- 18.3.4. Form Factor
- 18.3.5. End-Users
- 18.3.6. Distribution Channel
- 18.3.7. Country
- 18.3.7.1. Brazil
- 18.3.7.2. Argentina
- 18.3.7.3. Rest of South America
- 18.4. Brazil Personal Safety Devices Market
- 18.4.1. Country Segmental Analysis
- 18.4.2. Product Type
- 18.4.3. Connectivity
- 18.4.4. Power Source
- 18.4.5. Form Factor
- 18.4.6. End-Users
- 18.4.7. Distribution Channel
- 18.5. Argentina Personal Safety Devices Market
- 18.5.1. Country Segmental Analysis
- 18.5.2. Product Type
- 18.5.3. Connectivity
- 18.5.4. Power Source
- 18.5.5. Form Factor
- 18.5.6. End-Users
- 18.5.7. Distribution Channel
- 18.6. Rest of South America Personal Safety Devices Market
- 18.6.1. Country Segmental Analysis
- 18.6.2. Product Type
- 18.6.3. Connectivity
- 18.6.4. Power Source
- 18.6.5. Form Factor
- 18.6.6. End-Users
- 18.6.7. Distribution Channel
- 19. Key Players/ Company Profile
- 19.1. 3M Company
- 19.1.1. Company Details/ Overview
- 19.1.2. Company Financials
- 19.1.3. Key Customers and Competitors
- 19.1.4. Business/ Industry Portfolio
- 19.1.5. Product Portfolio/ Specification Details
- 19.1.6. Pricing Data
- 19.1.7. Strategic Overview
- 19.1.8. Recent Developments
- 19.2. ACR Electronics
- 19.3. Axon Enterprise, Inc.
- 19.4. Blackline Safety Corp.
- 19.5. bSafe Ltd.
- 19.6. Garmin Ltd.
- 19.7. Honeywell International Inc.
- 19.8. Motorola Solutions, Inc.
- 19.9. Peoplesafe Personal Safety Ltd
- 19.10. React Mobile, Inc.
- 19.11. ROAR for Good
- 19.12. Safariland Group
- 19.13. Other Key Players
- 19.1. 3M Company
Note* - This is just tentative list of players. While providing the report, we will cover more number of players based on their revenue and share for each geography
Research Design
Our research design integrates both demand-side and supply-side analysis through a balanced combination of primary and secondary research methodologies. By utilizing both bottom-up and top-down approaches alongside rigorous data triangulation methods, we deliver robust market intelligence that supports strategic decision-making.
MarketGenics' comprehensive research design framework ensures the delivery of accurate, reliable, and actionable market intelligence. Through the integration of multiple research approaches, rigorous validation processes, and expert analysis, we provide our clients with the insights needed to make informed strategic decisions and capitalize on market opportunities.

MarketGenics leverages a dedicated industry panel of experts and a comprehensive suite of paid databases to effectively collect, consolidate, and analyze market intelligence.
Our approach has consistently proven to be reliable and effective in generating accurate market insights, identifying key industry trends, and uncovering emerging business opportunities.
Through both primary and secondary research, we capture and analyze critical company-level data such as manufacturing footprints, including technical centers, R&D facilities, sales offices, and headquarters.
Our expert panel further enhances our ability to estimate market size for specific brands based on validated field-level intelligence.
Our data mining techniques incorporate both parametric and non-parametric methods, allowing for structured data collection, sorting, processing, and cleaning.
Demand projections are derived from large-scale data sets analyzed through proprietary algorithms, culminating in robust and reliable market sizing.
Research Approach
The bottom-up approach builds market estimates by starting with the smallest addressable market units and systematically aggregating them to create comprehensive market size projections.
This method begins with specific, granular data points and builds upward to create the complete market landscape.
Customer Analysis → Segmental Analysis → Geographical Analysis
The top-down approach starts with the broadest possible market data and systematically narrows it down through a series of filters and assumptions to arrive at specific market segments or opportunities.
This method begins with the big picture and works downward to increasingly specific market slices.
TAM → SAM → SOM


Research Methods
Desk / Secondary Research
While analysing the market, we extensively study secondary sources, directories, and databases to identify and collect information useful for this technical, market-oriented, and commercial report. Secondary sources that we utilize are not only the public sources, but it is a combination of Open Source, Associations, Paid Databases, MG Repository & Knowledgebase, and others.
- Company websites, annual reports, financial reports, broker reports, and investor presentations
- National government documents, statistical databases and reports
- News articles, press releases and web-casts specific to the companies operating in the market, Magazines, reports, and others
- We gather information from commercial data sources for deriving company specific data such as segmental revenue, share for geography, product revenue, and others
- Internal and external proprietary databases (industry-specific), relevant patent, and regulatory databases
- Governing Bodies, Government Organizations
- Relevant Authorities, Country-specific Associations for Industries
We also employ the model mapping approach to estimate the product level market data through the players' product portfolio
Primary Research
Primary research/ interviews is vital in analyzing the market. Most of the cases involves paid primary interviews. Primary sources include primary interviews through e-mail interactions, telephonic interviews, surveys as well as face-to-face interviews with the different stakeholders across the value chain including several industry experts.
| Type of Respondents | Number of Primaries |
|---|---|
| Tier 2/3 Suppliers | ~20 |
| Tier 1 Suppliers | ~25 |
| End-users | ~25 |
| Industry Expert/ Panel/ Consultant | ~30 |
| Total | ~100 |
MG Knowledgebase
• Repository of industry blog, newsletter and case studies
• Online platform covering detailed market reports, and company profiles
Forecasting Factors and Models
Forecasting Factors
- Historical Trends – Past market patterns, cycles, and major events that shaped how markets behave over time. Understanding past trends helps predict future behavior.
- Industry Factors – Specific characteristics of the industry like structure, regulations, and innovation cycles that affect market dynamics.
- Macroeconomic Factors – Economic conditions like GDP growth, inflation, and employment rates that affect how much money people have to spend.
- Demographic Factors – Population characteristics like age, income, and location that determine who can buy your product.
- Technology Factors – How quickly people adopt new technology and how much technology infrastructure exists.
- Regulatory Factors – Government rules, laws, and policies that can help or restrict market growth.
- Competitive Factors – Analyzing competition structure such as degree of competition and bargaining power of buyers and suppliers.
Forecasting Models / Techniques
Multiple Regression Analysis
- Identify and quantify factors that drive market changes
- Statistical modeling to establish relationships between market drivers and outcomes
Time Series Analysis – Seasonal Patterns
- Understand regular cyclical patterns in market demand
- Advanced statistical techniques to separate trend, seasonal, and irregular components
Time Series Analysis – Trend Analysis
- Identify underlying market growth patterns and momentum
- Statistical analysis of historical data to project future trends
Expert Opinion – Expert Interviews
- Gather deep industry insights and contextual understanding
- In-depth interviews with key industry stakeholders
Multi-Scenario Development
- Prepare for uncertainty by modeling different possible futures
- Creating optimistic, pessimistic, and most likely scenarios
Time Series Analysis – Moving Averages
- Sophisticated forecasting for complex time series data
- Auto-regressive integrated moving average models with seasonal components
Econometric Models
- Apply economic theory to market forecasting
- Sophisticated economic models that account for market interactions
Expert Opinion – Delphi Method
- Harness collective wisdom of industry experts
- Structured, multi-round expert consultation process
Monte Carlo Simulation
- Quantify uncertainty and probability distributions
- Thousands of simulations with varying input parameters
Research Analysis
Our research framework is built upon the fundamental principle of validating market intelligence from both demand and supply perspectives. This dual-sided approach ensures comprehensive market understanding and reduces the risk of single-source bias.
Demand-Side Analysis: We understand end-user/application behavior, preferences, and market needs along with the penetration of the product for specific application.
Supply-Side Analysis: We estimate overall market revenue, analyze the segmental share along with industry capacity, competitive landscape, and market structure.
Validation & Evaluation
Data triangulation is a validation technique that uses multiple methods, sources, or perspectives to examine the same research question, thereby increasing the credibility and reliability of research findings. In market research, triangulation serves as a quality assurance mechanism that helps identify and minimize bias, validate assumptions, and ensure accuracy in market estimates.
- Data Source Triangulation – Using multiple data sources to examine the same phenomenon
- Methodological Triangulation – Using multiple research methods to study the same research question
- Investigator Triangulation – Using multiple researchers or analysts to examine the same data
- Theoretical Triangulation – Using multiple theoretical perspectives to interpret the same data

Custom Market Research Services
We will customise the research for you, in case the report listed above does not meet your requirements.
Get 10% Free Customisation