Personalized Gifts Market Size, Share & Trends Analysis Report by Product Type (Personalized Clothing, Personalized Chocolates & Chocolate Platters, Personalized Accessories, Personalized Diaries & Desk Accessories, Personalized Photo Frames & Wall Decoration, Personalized Home Décor, Personalized Stationery and Cards, Food and Beverage Gifts, Tech Gadgets, Beauty Products, Others), Personalization Type, Customer Category, Occasion/Purpose, Distribution Channel, Price Range, End-users Types and Geography (North America, Europe, Asia Pacific, Middle East, Africa, and South America) – Global Industry Data, Trends, and Forecasts, 2026–2035
|
|
|
Segmental Data Insights |
|
|
Demand Trends |
|
|
Competitive Landscape |
|
|
Strategic Development |
|
|
Future Outlook & Opportunities |
|
Personalized Gifts Market Size, Share, and Growth
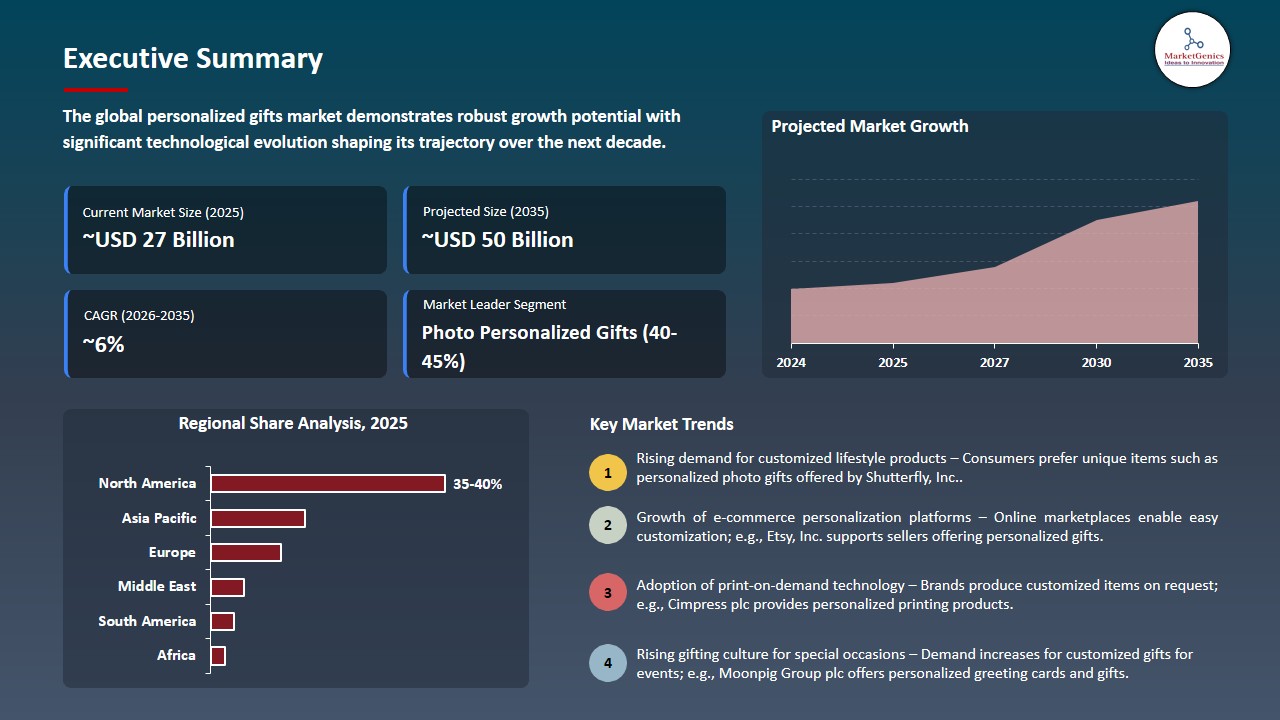
The global personalized gifts market is witnessing strong growth, valued at USD 27.3 billion in 2025 and projected to reach USD 49.8 billion by 2035, expanding at a CAGR of 6.2% during the forecast period. Asia Pacific is the fastest-growing region for the personalized gifts market due to rising disposable incomes, increasing internet and smartphone penetration, and growing consumer interest in unique, culturally relevant, and customized gifting experiences.
Andreas Fredriksson, Senior Director, M&M'S Digital, said, " M&M'S have been a Valentine's Day staple for decades, This year's M&M'S Gift Guide is sweetening the season with thoughtful, customizable gifts full of our iconic chocolate candies to make this Valetine's Day extra special. With an array of gifts, favors and flavors on MMS.com fans can find something that shows how much they care for all the special people in their lives"
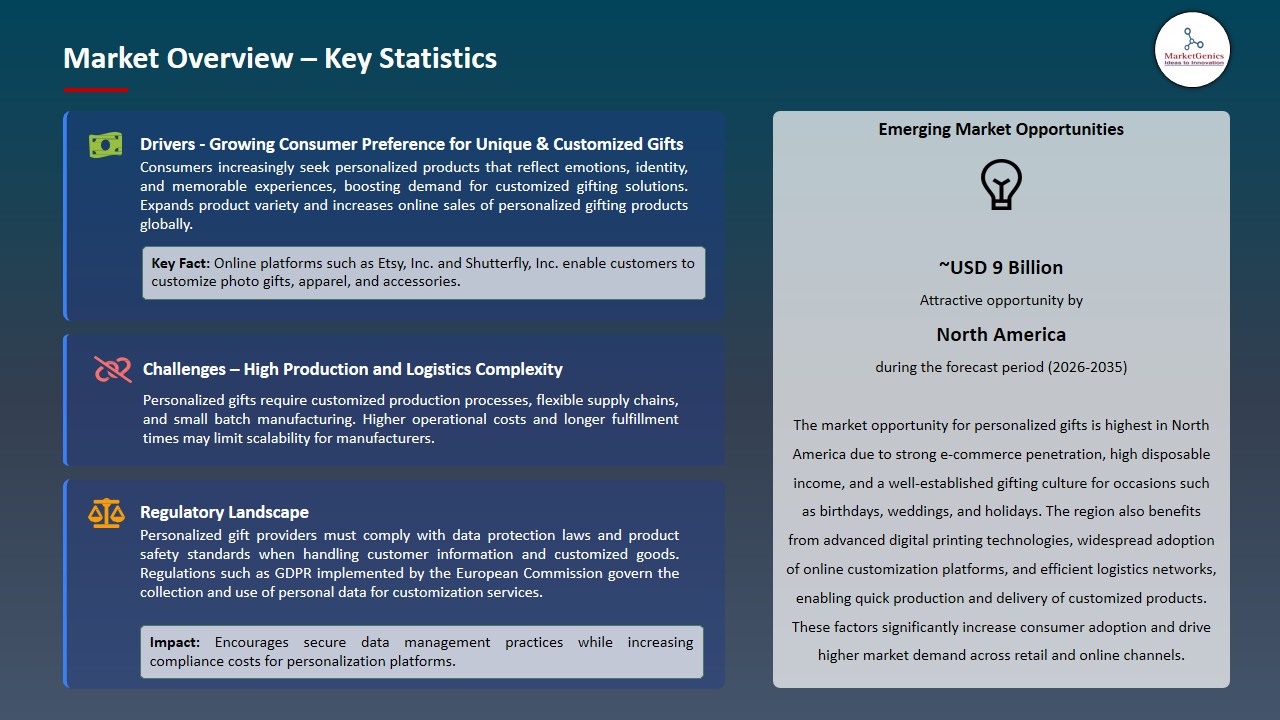
The global personalized gifts market is being driven by consumers’ growing preference for unique and emotionally meaningful presents that strengthen personal connections. Advances in digital printing, laser engraving, and online customization platforms have made it easier for manufacturers to offer highly tailored products, from photo books and engraved jewelry to custom apparel and home décor.
In November 2025, Shutterfly expanded its platform with AI-assisted photo gift designs, enabling users to create fully personalized keepsakes effortlessly. Similarly, Cameo grew rapidly by providing customized celebrity video messages for birthdays, anniversaries, and special occasions, tapping into the demand for highly personalized digital experiences. These innovations, combined with rising e-commerce adoption, social media influence, and increasing disposable incomes, are encouraging consumers to invest in gifts that reflect individuality and thoughtfulness.
Adjacent opportunities to the personalized gifts market include customized corporate merchandise, AI-driven digital gift experiences, DIY craft kits, personalized subscription boxes, and on-demand 3D-printed products. These segments leverage personalization trends, expanding revenue streams beyond traditional gifting and tapping into both B2B and B2C demand for unique, meaningful, and interactive experiences.
Personalized Gifts Market Dynamics and Trends
Driver: Surge in E-Commerce Platforms Facilitating Seamless Personalized Gift Purchases
-
The growing popularity of the e-commerce platforms is also playing a key role in promoting the personalised gifts market by allowing consumers an easy access to a diverse range of products that can be tailored accordingly. Online stores and specific gift portals enable customers to make personalized products, preview and order them at the comfort of their homes, without taking into consideration geographical boundaries and friction associated with purchases.
- High technology, including AI-based suggestions, 3D previews, and real-time online demonstrations, increase customer trust and simplify the personalization process. This ease and accessibility is encouraging repeating purchases and expansion of the consumer base on the international level.
- In 2025, Etsy used AI to personalize homepages, notifications, and marketing, which increased engagement and conversions twofold and incorporated AI tools, such as Operator by OpenAI and Microsoft Copilot, to simplify personalized buys.
- The implementation of e-commerce personalization through AI is becoming quicker and pushing the sales in the personalized gift market.
Restraint: High Production Costs and Limited Scalability Hindering Mass Adoption
-
The high cost of production is also a major limitation of the personalized gifts market, as the producers invest in cutting-edge customization systems, high-quality materials, and complex design. The high prices are frequently transferred to the consumers making them unaffordable and decreasing the popularity of customized products among price-sensitive clients.
- Additionally, there is a low level of scalability, which precludes efficient response to the increasing demand by manufacturers. Small scale production, handmade customization, and reliance on specialized equipment slows down the order fulfillment and limits the expansion to the mass-market.
- High costs and lack of scalability makes it hard to be widely adopted particularly in the emerging markets and companies have to trade quality and efficiency to achieve sustainable growth.
Opportunity: Integration of AI and Digital Platforms to Expand Personalized Gifting Experiences
-
The merge of AI and online platforms is opening up the personalized gifts market with the help of highly personalized and interactive shopping experience. AI-based recommendation engines, virtual previews, and customization systems enable customers to create their own unique gifts depending upon the preferences, occasions, and trends of the recipient.
- What they do is that these technologies streamline the ordering process, increase the user engagement, and minimize the errors in personalization. Through digital channels, brands can access a broader audience, provide real-time updates, and provide more valuable, personalized gifting experiences, which brings growth in the market and customer retention.
- Zazzle introduced AI-based design tools in 2026 to make it easier to create personalized gifts, make designs more creative and personalized, and engage with users in products, such as invitations, mugs, and wall art.
- Digital personalized gifting is being revolutionized by the use of AI which enhances creativity, interaction and market expansion.
Key Trend: Growth of Experiential and Memory-Focused Gifts Driving Consumer Engagement
-
The consumers are putting more emphasis on personalized gifts that deliver memorable experiences instead of tangible products. Individualized workshops, photo albums, and simulative gift packages are experiences that enable participants to connect at an emotional level, and they will enhance their personal bond and leave a memorable impact.
- The trend has shifted towards brands creating offerings beyond products, which revolve around narratives, emotional appeal, and co-creation. With the focus on experiences, companies will be able to add customer interaction, build brand loyalty, and stand out in the crowded market of personalized gifts.
- Snapfish continued to push its personalized gift offerings, which led to a 13 percent year-over-year organic search performance improvement in 2025, built on the quality of its content, a fast loading of its product pages, and a high level of customer confidence signals that helped the brand draw in seasonal gifting business as well as increased engagement in its digital platforms.
- The shift towards experiential, memory-oriented gifts is fueling higher levels of customer engagement and brand loyalty in the personalized gifts sector.
Personalized Gifts Market Analysis and Segmental Data
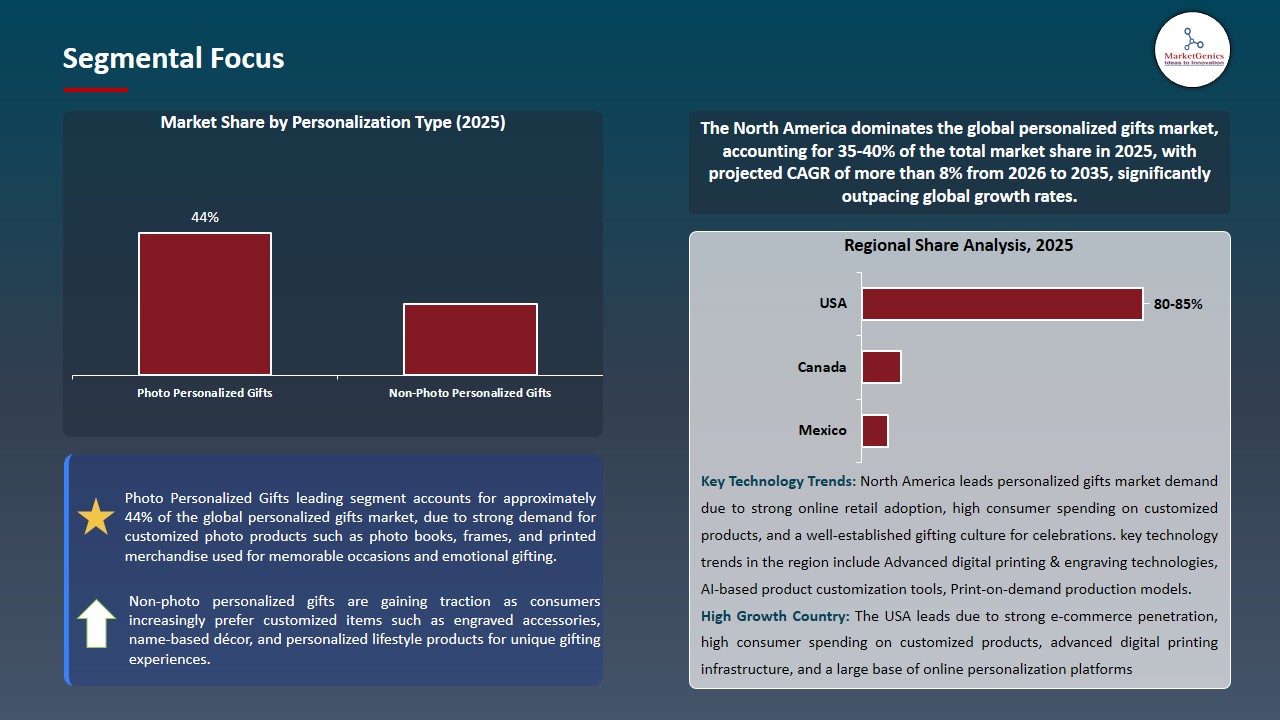
Photo Personalized Gifts Dominate Global Personalized Gifts Market
-
Photo personalized gifts occupy a dominant position in the personalised gifts market throughout the world with highest share as people are rising in need of meaningful, memorable gifts that preserve special moments, and personal achievements.
- Further products like personalized photo albums, framed prints and photo-engraved gifts enable their recipients to experience their favorite moments with the aim of creating emotional attachments and value the gift more.
- The possibility to integrate with digital platforms and mobile applications makes photo gifts very convenient, easy to preview and order, which is why they are very accessible and attractive to consumers of various segments around the globe.
- In 2025, Mixbook launched Auto-Create, an AI-based application that automatically creates an entirely personalized photo book, enabling customers to use the technology to combine speed, intelligent design and customization to create high-quality, customized gifts.
- Photo personalized gifts are the most interesting and emotionally appreciated category in the world, which is being promoted by the innovation up to mass adoption.
North America Leads Global Personalized Gifts Market Demand
-
North America is the dominant force in the personalised gifts market across the world and this can be attributed to the high disposable income, tendency to commemorate individual achievements and the proliferation of electronic applications. The demand of unique and customized gifts in various occasions like birthdays, anniversaries, weddings, and corporate activities among others has increased among the consumers, driving the need to have bespoke products.
- The region has a well-developed e-commerce infrastructure and mobile shopping platform enabling people to design, preview and order tailor-made goods with ease, making it more convenient and accessible. The customization process is further simplified by incorporating the AI-based recommendation engines and augmented reality tools and leads to a better user engagement and satisfaction.
- The main players are using these technologies in order to offer smooth, customized experiences to broaden their market reach and bolster North America control of the personalized gifts market around the globe.
Personalized Gifts Market Ecosystem
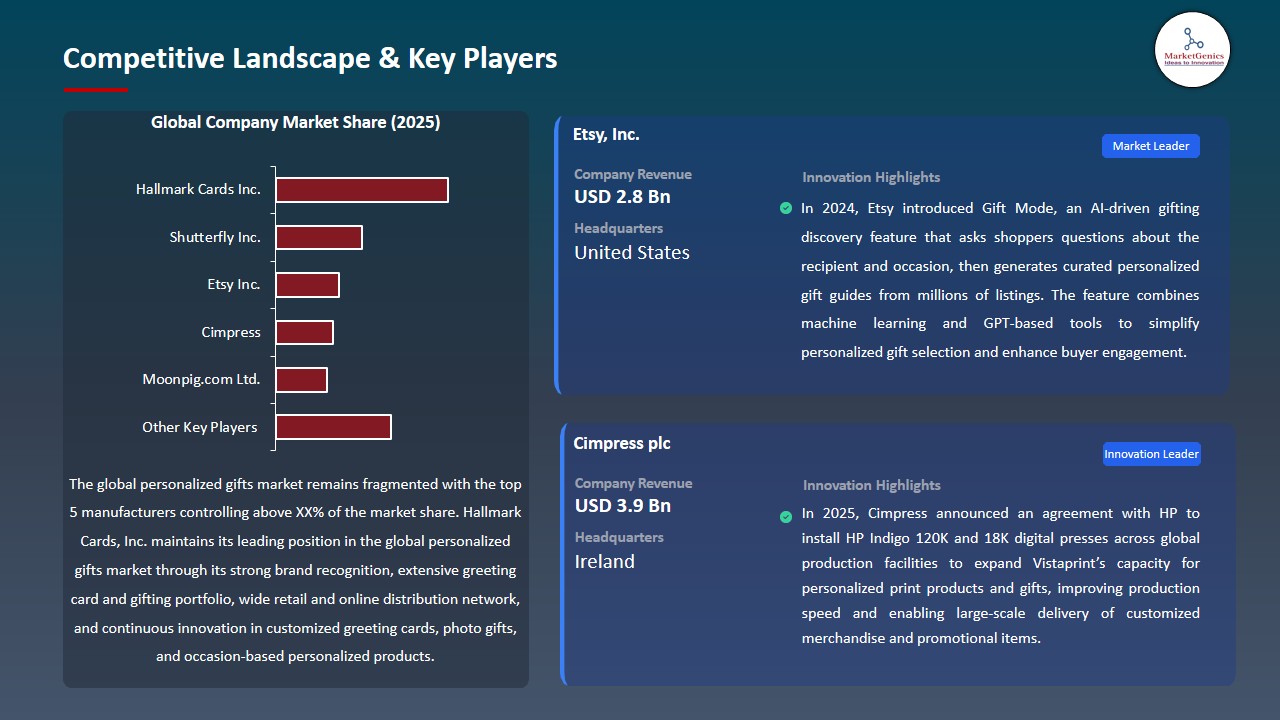
The global personalized gifts market is fragmented, with leading players including Hallmark Cards Inc., Shutterfly Inc., Etsy Inc., Cimpress, and Moonpig.com Ltd. These companies have an advantage of built in e-commerce, AI personalization engines, premium digital design tools, and well-furnished supply chain networks. Their management is strengthened by their constant investments in AI-based recommendation systems, mobile-first experience, easy customization interface, and strategic partnerships with logistics, printing, and technological partners.
The personalized gifts value chain includes digital content creation (images, designs, templates), production and printing, platform development, application ecosystem integration, order fulfillment and post sales. Long-term participation is augmented with subscription services, design storage, and order tracking, as well as customer support. Every phase guarantees smooth productization, effective delivery and quality experiences with various consumer groups.
The barriers to entry are high because of brand loyalty, superior digital infrastructure requirements, intellectual property, regulatory compliance, and massive production and logistics. The differentiation, recurring revenues, and continuous growth of the global market is led by innovations like AI-assisted design, interactive customization tools, and automated fulfillment.
Recent Development and Strategic Overview:
-
In January 2025, Mars, Incorporated launched its M&M’S Valentine’s Day Gift Guide, featuring a range of customizable gifts, party favors, and limited-time seasonal flavors. Consumers could create personalized candy blends using 22 colors and add photos, clip art, or custom messages, enabling unique, memorable gifting experiences that strengthened emotional connections during the holiday season.
- In December 2024, Target launched the Bullseye Gift Finder, a generative AI-powered tool on its app and website that delivers personalized gift recommendations for children based on age, hobbies, and favorite brands. The initiative, focused initially on toys, enhances customer convenience and engagement by simplifying the holiday shopping experience with AI-driven suggestions.
Report Scope
|
Detail |
|
|
Market Size in 2025 |
USD 27.3 Bn |
|
Market Forecast Value in 2035 |
USD 49.8 Bn |
|
Growth Rate (CAGR) |
6.2% |
|
Forecast Period |
2026 – 2035 |
|
Historical Data Available for |
2021 – 2024 |
|
Market Size Units |
US$ Billion for Value Thousand Units for Volume |
|
Report Format |
Electronic (PDF) + Excel |
|
North America |
Europe |
Asia Pacific |
Middle East |
Africa |
South America |
|
|
|
|
|
|
|
Companies Covered |
|||||
|
|
|
|
|
|
Personalized Gifts Market Segmentation and Highlights
|
Segment |
Sub-segment |
|
Personalized Gifts Market, By Product Type |
|
|
Personalized Gifts Market, By Personalization Type |
|
|
Personalized Gifts Market, By Customer Category |
|
|
Personalized Gifts Market, By Occasion/Purpose |
|
|
Personalized Gifts Market, By Distribution Channel |
|
|
Personalized Gifts Market, By Price Range |
|
|
Personalized Gifts Market, By End-users Types |
|
Frequently Asked Questions
Table of Contents
- 1. Research Methodology and Assumptions
- 1.1. Definitions
- 1.2. Research Design and Approach
- 1.3. Data Collection Methods
- 1.4. Base Estimates and Calculations
- 1.5. Forecasting Models
- 1.5.1. Key Forecast Factors & Impact Analysis
- 1.6. Secondary Research
- 1.6.1. Open Sources
- 1.6.2. Paid Databases
- 1.6.3. Associations
- 1.7. Primary Research
- 1.7.1. Primary Sources
- 1.7.2. Primary Interviews with Stakeholders across Ecosystem
- 2. Executive Summary
- 2.1. Global Personalized Gifts Market Outlook
- 2.1.1. Personalized Gifts Market Size (Volume (Thousand Units) and Value (US$ Bn)), and Forecasts, 2021-2035
- 2.1.2. Compounded Annual Growth Rate Analysis
- 2.1.3. Growth Opportunity Analysis
- 2.1.4. Segmental Share Analysis
- 2.1.5. Geographical Share Analysis
- 2.2. Market Analysis and Facts
- 2.3. Supply-Demand Analysis
- 2.4. Competitive Benchmarking
- 2.5. Go-to- Market Strategy
- 2.5.1. Customer/ End-use Industry Assessment
- 2.5.2. Growth Opportunity Data, 2026-2035
- 2.5.2.1. Regional Data
- 2.5.2.2. Country Data
- 2.5.2.3. Segmental Data
- 2.5.3. Identification of Potential Market Spaces
- 2.5.4. GAP Analysis
- 2.5.5. Potential Attractive Price Points
- 2.5.6. Prevailing Market Risks & Challenges
- 2.5.7. Preferred Sales & Marketing Strategies
- 2.5.8. Key Recommendations and Analysis
- 2.5.9. A Way Forward
- 2.1. Global Personalized Gifts Market Outlook
- 3. Industry Data and Premium Insights
- 3.1. Global Consumer Goods & Services Industry Overview, 2025
- 3.1.1. Consumer Goods & Services Industry Ecosystem Analysis
- 3.1.2. Key Trends for Consumer Goods & Services Industry
- 3.1.3. Regional Distribution for Consumer Goods & Services Industry
- 3.2. Supplier Customer Data
- 3.3. Technology Roadmap and Developments
- 3.4. Trade Analysis
- 3.4.1. Import & Export Analysis, 2025
- 3.4.2. Top Importing Countries
- 3.4.3. Top Exporting Countries
- 3.5. Trump Tariff Impact Analysis
- 3.5.1. Manufacturer
- 3.5.1.1. Based on the component & Raw material
- 3.5.2. Supply Chain
- 3.5.3. End Consumer
- 3.5.1. Manufacturer
- 3.6. Raw Material Analysis
- 3.1. Global Consumer Goods & Services Industry Overview, 2025
- 4. Market Overview
- 4.1. Market Dynamics
- 4.1.1. Drivers
- 4.1.1.1. Increasing consumer preference for unique, customized, and meaningful gifts.
- 4.1.1.2. Growth of e-commerce platforms enabling easy personalization and direct-to-consumer sales.
- 4.1.1.3. Rising disposable income and gifting culture across occasions and festivals.
- 4.1.2. Restraints
- 4.1.2.1. Higher production costs for customized products compared to mass-produced items.
- 4.1.2.2. Longer lead times and supply chain challenges for personalized order fulfillment.
- 4.1.1. Drivers
- 4.2. Key Trend Analysis
- 4.3. Regulatory Framework
- 4.3.1. Key Regulations, Norms, and Subsidies, by Key Countries
- 4.3.2. Tariffs and Standards
- 4.3.3. Impact Analysis of Regulations on the Market
- 4.4. Value Chain Analysis
- 4.5. Cost Structure Analysis
- 4.5.1. Parameter’s Share for Cost Associated
- 4.5.2. COGP vs COGS
- 4.5.3. Profit Margin Analysis
- 4.6. Pricing Analysis
- 4.6.1. Regional Pricing Analysis
- 4.6.2. Segmental Pricing Trends
- 4.6.3. Factors Influencing Pricing
- 4.7. Porter’s Five Forces Analysis
- 4.8. PESTEL Analysis
- 4.9. Global Personalized Gifts Market Demand
- 4.9.1. Historical Market Size – Volume (Thousand Units) and Value (US$ Bn), 2020-2024
- 4.9.2. Current and Future Market Size – Volume (Thousand Units) and Value (US$ Bn), 2026–2035
- 4.9.2.1. Y-o-Y Growth Trends
- 4.9.2.2. Absolute $ Opportunity Assessment
- 4.1. Market Dynamics
- 5. Competition Landscape
- 5.1. Competition structure
- 5.1.1. Fragmented v/s consolidated
- 5.2. Company Share Analysis, 2025
- 5.2.1. Global Company Market Share
- 5.2.2. By Region
- 5.2.2.1. North America
- 5.2.2.2. Europe
- 5.2.2.3. Asia Pacific
- 5.2.2.4. Middle East
- 5.2.2.5. Africa
- 5.2.2.6. South America
- 5.3. Product Comparison Matrix
- 5.3.1. Specifications
- 5.3.2. Market Positioning
- 5.3.3. Pricing
- 5.1. Competition structure
- 6. Global Personalized Gifts Market Analysis, by Product Type
- 6.1. Key Segment Analysis
- 6.2. Personalized Gifts Market Size (Volume (Thousand Units) and Value (US$ Bn)), Analysis, and Forecasts, by Product Type, 2021-2035
- 6.2.1. Personalized Clothing
- 6.2.2. Personalized Chocolates & Chocolate Platters
- 6.2.3. Personalized Accessories
- 6.2.4. Personalized Diaries & Desk Accessories
- 6.2.5. Personalized Photo Frames & Wall Decoration
- 6.2.6. Personalized Home Décor
- 6.2.7. Personalized Stationery and Cards
- 6.2.8. Food and Beverage Gifts
- 6.2.9. Tech Gadgets
- 6.2.10. Beauty Products
- 6.2.11. Others
- 7. Global Personalized Gifts Market Analysis, by Personalization Type
- 7.1. Key Segment Analysis
- 7.2. Personalized Gifts Market Size (Volume (Thousand Units) and Value (US$ Bn)), Analysis, and Forecasts, by Personalization Type, 2021-2035
- 7.2.1. Photo Personalized Gifts
- 7.2.2. Non-Photo Personalized Gifts
- 7.2.2.1. Engraved Items
- 7.2.2.2. Embroidered Products
- 7.2.2.3. Custom Printed Items
- 7.2.2.4. Etched Glass Gifts
- 8. Global Personalized Gifts Market Analysis, by Customer Category
- 8.1. Key Segment Analysis
- 8.2. Personalized Gifts Market Size (Volume (Thousand Units) and Value (US$ Bn)), Analysis, and Forecasts, by Customer Category, 2021-2035
- 8.2.1. Women
- 8.2.2. Men
- 8.2.3. Unisex
- 8.2.4. Kids/Children
- 9. Global Personalized Gifts Market Analysis, by Occasion/Purpose
- 9.1. Key Segment Analysis
- 9.2. Personalized Gifts Market Size (Volume (Thousand Units) and Value (US$ Bn)), Analysis, and Forecasts, by Occasion/Purpose, 2021-2035
- 9.2.1. Birthdays
- 9.2.2. Anniversaries
- 9.2.3. Weddings
- 9.2.4. Holidays
- 9.2.4.1. Christmas
- 9.2.4.2. Valentine's Day
- 9.2.4.3. Halloween
- 9.2.4.4. Thanksgiving
- 9.2.4.5. Easter
- 9.2.4.6. Others
- 9.2.5. Graduations
- 9.2.6. Baby Showers
- 9.2.7. Corporate Events
- 9.2.8. Special Occasions
- 9.2.9. Festivals
- 9.2.10. Others
- 10. Global Personalized Gifts Market Analysis and Forecasts, by Distribution Channel
- 10.1. Key Findings
- 10.2. Personalized Gifts Market Size (Volume (Thousand Units) and Value (US$ Bn)), Analysis, and Forecasts, by Distribution Channel, 2021-2035
- 10.2.1. Online Distribution Channel
- 10.2.1.1. E-commerce Platforms
- 10.2.1.2. Company Websites
- 10.2.2. Offline Distribution Channel
- 10.2.2.1. Specialty Stores
- 10.2.2.2. Retail Stores
- 10.2.2.3. Boutiques
- 10.2.2.4. Others
- 10.2.1. Online Distribution Channel
- 11. Global Personalized Gifts Market Analysis and Forecasts, by Price Range
- 11.1. Key Findings
- 11.2. Personalized Gifts Market Size (Volume (Thousand Units) and Value (US$ Bn)), Analysis, and Forecasts, by Price Range, 2021-2035
- 11.2.1. Budget-Friendly
- 11.2.2. Mid-Range
- 11.2.3. Luxury/Premium
- 11.2.4. Bespoke
- 12. Global Personalized Gifts Market Analysis and Forecasts, by End-users Types
- 12.1. Key Findings
- 12.2. Personalized Gifts Market Size (Volume (Thousand Units) and Value (US$ Bn)), Analysis, and Forecasts, by End-users Types, 2021-2035
- 12.2.1. Individual Consumers
- 12.2.2. Corporate Gifting
- 12.2.3. Occasion-Based Gifting
- 12.2.4. Schools
- 12.2.5. Organizations
- 12.2.6. Event Planners
- 12.2.7. Others
- 13. Global Personalized Gifts Market Analysis and Forecasts, by Region
- 13.1. Key Findings
- 13.2. Personalized Gifts Market Size (Volume (Thousand Units) and Value (US$ Bn)), Analysis, and Forecasts, by Region, 2021-2035
- 13.2.1. North America
- 13.2.2. Europe
- 13.2.3. Asia Pacific
- 13.2.4. Middle East
- 13.2.5. Africa
- 13.2.6. South America
- 14. North America Personalized Gifts Market Analysis
- 14.1. Key Segment Analysis
- 14.2. Regional Snapshot
- 14.3. North America Personalized Gifts Market Size (Volume (Thousand Units) and Value (US$ Bn)), Analysis, and Forecasts, 2021-2035
- 14.3.1. Product Type
- 14.3.2. Personalization Type
- 14.3.3. Customer Category
- 14.3.4. Occasion/Purpose
- 14.3.5. Distribution Channel
- 14.3.6. Price Range
- 14.3.7. End-users Types
- 14.3.8. Country
- 14.3.8.1. USA
- 14.3.8.2. Canada
- 14.3.8.3. Mexico
- 14.4. USA Personalized Gifts Market
- 14.4.1. Country Segmental Analysis
- 14.4.2. Product Type
- 14.4.3. Personalization Type
- 14.4.4. Customer Category
- 14.4.5. Occasion/Purpose
- 14.4.6. Distribution Channel
- 14.4.7. Price Range
- 14.4.8. End-users Types
- 14.5. Canada Personalized Gifts Market
- 14.5.1. Country Segmental Analysis
- 14.5.2. Product Type
- 14.5.3. Personalization Type
- 14.5.4. Customer Category
- 14.5.5. Occasion/Purpose
- 14.5.6. Distribution Channel
- 14.5.7. Price Range
- 14.5.8. End-users Types
- 14.6. Mexico Personalized Gifts Market
- 14.6.1. Country Segmental Analysis
- 14.6.2. Product Type
- 14.6.3. Personalization Type
- 14.6.4. Customer Category
- 14.6.5. Occasion/Purpose
- 14.6.6. Distribution Channel
- 14.6.7. Price Range
- 14.6.8. End-users Types
- 15. Europe Personalized Gifts Market Analysis
- 15.1. Key Segment Analysis
- 15.2. Regional Snapshot
- 15.3. Europe Personalized Gifts Market Size (Volume (Thousand Units) and Value (US$ Bn)), Analysis, and Forecasts, 2021-2035
- 15.3.1. Product Type
- 15.3.2. Personalization Type
- 15.3.3. Customer Category
- 15.3.4. Occasion/Purpose
- 15.3.5. Distribution Channel
- 15.3.6. Price Range
- 15.3.7. End-users Types
- 15.3.8. Country
- 15.3.8.1. Germany
- 15.3.8.2. United Kingdom
- 15.3.8.3. France
- 15.3.8.4. Italy
- 15.3.8.5. Spain
- 15.3.8.6. Netherlands
- 15.3.8.7. Nordic Countries
- 15.3.8.8. Poland
- 15.3.8.9. Russia & CIS
- 15.3.8.10. Rest of Europe
- 15.4. Germany Personalized Gifts Market
- 15.4.1. Country Segmental Analysis
- 15.4.2. Product Type
- 15.4.3. Personalization Type
- 15.4.4. Customer Category
- 15.4.5. Occasion/Purpose
- 15.4.6. Distribution Channel
- 15.4.7. Price Range
- 15.4.8. End-users Types
- 15.5. United Kingdom Personalized Gifts Market
- 15.5.1. Country Segmental Analysis
- 15.5.2. Product Type
- 15.5.3. Personalization Type
- 15.5.4. Customer Category
- 15.5.5. Occasion/Purpose
- 15.5.6. Distribution Channel
- 15.5.7. Price Range
- 15.5.8. End-users Types
- 15.6. France Personalized Gifts Market
- 15.6.1. Country Segmental Analysis
- 15.6.2. Product Type
- 15.6.3. Personalization Type
- 15.6.4. Customer Category
- 15.6.5. Occasion/Purpose
- 15.6.6. Distribution Channel
- 15.6.7. Price Range
- 15.6.8. End-users Types
- 15.7. Italy Personalized Gifts Market
- 15.7.1. Country Segmental Analysis
- 15.7.2. Product Type
- 15.7.3. Personalization Type
- 15.7.4. Customer Category
- 15.7.5. Occasion/Purpose
- 15.7.6. Distribution Channel
- 15.7.7. Price Range
- 15.7.8. End-users Types
- 15.8. Spain Personalized Gifts Market
- 15.8.1. Country Segmental Analysis
- 15.8.2. Product Type
- 15.8.3. Personalization Type
- 15.8.4. Customer Category
- 15.8.5. Occasion/Purpose
- 15.8.6. Distribution Channel
- 15.8.7. Price Range
- 15.8.8. End-users Types
- 15.9. Netherlands Personalized Gifts Market
- 15.9.1. Country Segmental Analysis
- 15.9.2. Product Type
- 15.9.3. Personalization Type
- 15.9.4. Customer Category
- 15.9.5. Occasion/Purpose
- 15.9.6. Distribution Channel
- 15.9.7. Price Range
- 15.9.8. End-users Types
- 15.10. Nordic Countries Personalized Gifts Market
- 15.10.1. Country Segmental Analysis
- 15.10.2. Product Type
- 15.10.3. Personalization Type
- 15.10.4. Customer Category
- 15.10.5. Occasion/Purpose
- 15.10.6. Distribution Channel
- 15.10.7. Price Range
- 15.10.8. End-users Types
- 15.11. Poland Personalized Gifts Market
- 15.11.1. Country Segmental Analysis
- 15.11.2. Product Type
- 15.11.3. Personalization Type
- 15.11.4. Customer Category
- 15.11.5. Occasion/Purpose
- 15.11.6. Distribution Channel
- 15.11.7. Price Range
- 15.11.8. End-users Types
- 15.12. Russia & CIS Personalized Gifts Market
- 15.12.1. Country Segmental Analysis
- 15.12.2. Product Type
- 15.12.3. Personalization Type
- 15.12.4. Customer Category
- 15.12.5. Occasion/Purpose
- 15.12.6. Distribution Channel
- 15.12.7. Price Range
- 15.12.8. End-users Types
- 15.13. Rest of Europe Personalized Gifts Market
- 15.13.1. Country Segmental Analysis
- 15.13.2. Product Type
- 15.13.3. Personalization Type
- 15.13.4. Customer Category
- 15.13.5. Occasion/Purpose
- 15.13.6. Distribution Channel
- 15.13.7. Price Range
- 15.13.8. End-users Types
- 16. Asia Pacific Personalized Gifts Market Analysis
- 16.1. Key Segment Analysis
- 16.2. Regional Snapshot
- 16.3. Asia Pacific Personalized Gifts Market Size (Volume (Thousand Units) and Value (US$ Bn)), Analysis, and Forecasts, 2021-2035
- 16.3.1. Product Type
- 16.3.2. Personalization Type
- 16.3.3. Customer Category
- 16.3.4. Occasion/Purpose
- 16.3.5. Distribution Channel
- 16.3.6. Price Range
- 16.3.7. End-users Types
- 16.3.8. Country
- 16.3.8.1. China
- 16.3.8.2. India
- 16.3.8.3. Japan
- 16.3.8.4. South Korea
- 16.3.8.5. Australia and New Zealand
- 16.3.8.6. Indonesia
- 16.3.8.7. Malaysia
- 16.3.8.8. Thailand
- 16.3.8.9. Vietnam
- 16.3.8.10. Rest of Asia Pacific
- 16.4. China Personalized Gifts Market
- 16.4.1. Country Segmental Analysis
- 16.4.2. Product Type
- 16.4.3. Personalization Type
- 16.4.4. Customer Category
- 16.4.5. Occasion/Purpose
- 16.4.6. Distribution Channel
- 16.4.7. Price Range
- 16.4.8. End-users Types
- 16.5. India Personalized Gifts Market
- 16.5.1. Country Segmental Analysis
- 16.5.2. Product Type
- 16.5.3. Personalization Type
- 16.5.4. Customer Category
- 16.5.5. Occasion/Purpose
- 16.5.6. Distribution Channel
- 16.5.7. Price Range
- 16.5.8. End-users Types
- 16.6. Japan Personalized Gifts Market
- 16.6.1. Country Segmental Analysis
- 16.6.2. Product Type
- 16.6.3. Personalization Type
- 16.6.4. Customer Category
- 16.6.5. Occasion/Purpose
- 16.6.6. Distribution Channel
- 16.6.7. Price Range
- 16.6.8. End-users Types
- 16.7. South Korea Personalized Gifts Market
- 16.7.1. Country Segmental Analysis
- 16.7.2. Product Type
- 16.7.3. Personalization Type
- 16.7.4. Customer Category
- 16.7.5. Occasion/Purpose
- 16.7.6. Distribution Channel
- 16.7.7. Price Range
- 16.7.8. End-users Types
- 16.8. Australia and New Zealand Personalized Gifts Market
- 16.8.1. Country Segmental Analysis
- 16.8.2. Product Type
- 16.8.3. Personalization Type
- 16.8.4. Customer Category
- 16.8.5. Occasion/Purpose
- 16.8.6. Distribution Channel
- 16.8.7. Price Range
- 16.8.8. End-users Types
- 16.9. Indonesia Personalized Gifts Market
- 16.9.1. Country Segmental Analysis
- 16.9.2. Product Type
- 16.9.3. Personalization Type
- 16.9.4. Customer Category
- 16.9.5. Occasion/Purpose
- 16.9.6. Distribution Channel
- 16.9.7. Price Range
- 16.9.8. End-users Types
- 16.10. Malaysia Personalized Gifts Market
- 16.10.1. Country Segmental Analysis
- 16.10.2. Product Type
- 16.10.3. Personalization Type
- 16.10.4. Customer Category
- 16.10.5. Occasion/Purpose
- 16.10.6. Distribution Channel
- 16.10.7. Price Range
- 16.10.8. End-users Types
- 16.11. Thailand Personalized Gifts Market
- 16.11.1. Country Segmental Analysis
- 16.11.2. Product Type
- 16.11.3. Personalization Type
- 16.11.4. Customer Category
- 16.11.5. Occasion/Purpose
- 16.11.6. Distribution Channel
- 16.11.7. Price Range
- 16.11.8. End-users Types
- 16.12. Vietnam Personalized Gifts Market
- 16.12.1. Country Segmental Analysis
- 16.12.2. Product Type
- 16.12.3. Personalization Type
- 16.12.4. Customer Category
- 16.12.5. Occasion/Purpose
- 16.12.6. Distribution Channel
- 16.12.7. Price Range
- 16.12.8. End-users Types
- 16.13. Rest of Asia Pacific Personalized Gifts Market
- 16.13.1. Country Segmental Analysis
- 16.13.2. Product Type
- 16.13.3. Personalization Type
- 16.13.4. Customer Category
- 16.13.5. Occasion/Purpose
- 16.13.6. Distribution Channel
- 16.13.7. Price Range
- 16.13.8. End-users Types
- 17. Middle East Personalized Gifts Market Analysis
- 17.1. Key Segment Analysis
- 17.2. Regional Snapshot
- 17.3. Middle East Personalized Gifts Market Size (Volume (Thousand Units) and Value (US$ Bn)), Analysis, and Forecasts, 2021-2035
- 17.3.1. Product Type
- 17.3.2. Personalization Type
- 17.3.3. Customer Category
- 17.3.4. Occasion/Purpose
- 17.3.5. Distribution Channel
- 17.3.6. Price Range
- 17.3.7. End-users Types
- 17.3.8. Country
- 17.3.8.1. Turkey
- 17.3.8.2. UAE
- 17.3.8.3. Saudi Arabia
- 17.3.8.4. Israel
- 17.3.8.5. Rest of Middle East
- 17.4. Turkey Personalized Gifts Market
- 17.4.1. Country Segmental Analysis
- 17.4.2. Product Type
- 17.4.3. Personalization Type
- 17.4.4. Customer Category
- 17.4.5. Occasion/Purpose
- 17.4.6. Distribution Channel
- 17.4.7. Price Range
- 17.4.8. End-users Types
- 17.5. UAE Personalized Gifts Market
- 17.5.1. Country Segmental Analysis
- 17.5.2. Product Type
- 17.5.3. Personalization Type
- 17.5.4. Customer Category
- 17.5.5. Occasion/Purpose
- 17.5.6. Distribution Channel
- 17.5.7. Price Range
- 17.5.8. End-users Types
- 17.6. Saudi Arabia Personalized Gifts Market
- 17.6.1. Country Segmental Analysis
- 17.6.2. Product Type
- 17.6.3. Personalization Type
- 17.6.4. Customer Category
- 17.6.5. Occasion/Purpose
- 17.6.6. Distribution Channel
- 17.6.7. Price Range
- 17.6.8. End-users Types
- 17.7. Israel Personalized Gifts Market
- 17.7.1. Country Segmental Analysis
- 17.7.2. Product Type
- 17.7.3. Personalization Type
- 17.7.4. Customer Category
- 17.7.5. Occasion/Purpose
- 17.7.6. Distribution Channel
- 17.7.7. Price Range
- 17.7.8. End-users Types
- 17.8. Rest of Middle East Personalized Gifts Market
- 17.8.1. Country Segmental Analysis
- 17.8.2. Product Type
- 17.8.3. Personalization Type
- 17.8.4. Customer Category
- 17.8.5. Occasion/Purpose
- 17.8.6. Distribution Channel
- 17.8.7. Price Range
- 17.8.8. End-users Types
- 18. Africa Personalized Gifts Market Analysis
- 18.1. Key Segment Analysis
- 18.2. Regional Snapshot
- 18.3. Africa Personalized Gifts Market Size (Volume (Thousand Units) and Value (US$ Bn)), Analysis, and Forecasts, 2021-2035
- 18.3.1. Product Type
- 18.3.2. Personalization Type
- 18.3.3. Customer Category
- 18.3.4. Occasion/Purpose
- 18.3.5. Distribution Channel
- 18.3.6. Price Range
- 18.3.7. End-users Types
- 18.3.8. Country
- 18.3.8.1. South Africa
- 18.3.8.2. Egypt
- 18.3.8.3. Nigeria
- 18.3.8.4. Algeria
- 18.3.8.5. Rest of Africa
- 18.4. South Africa Personalized Gifts Market
- 18.4.1. Country Segmental Analysis
- 18.4.2. Product Type
- 18.4.3. Personalization Type
- 18.4.4. Customer Category
- 18.4.5. Occasion/Purpose
- 18.4.6. Distribution Channel
- 18.4.7. Price Range
- 18.4.8. End-users Types
- 18.5. Egypt Personalized Gifts Market
- 18.5.1. Country Segmental Analysis
- 18.5.2. Product Type
- 18.5.3. Personalization Type
- 18.5.4. Customer Category
- 18.5.5. Occasion/Purpose
- 18.5.6. Distribution Channel
- 18.5.7. Price Range
- 18.5.8. End-users Types
- 18.6. Nigeria Personalized Gifts Market
- 18.6.1. Country Segmental Analysis
- 18.6.2. Product Type
- 18.6.3. Personalization Type
- 18.6.4. Customer Category
- 18.6.5. Occasion/Purpose
- 18.6.6. Distribution Channel
- 18.6.7. Price Range
- 18.6.8. End-users Types
- 18.7. Algeria Personalized Gifts Market
- 18.7.1. Country Segmental Analysis
- 18.7.2. Product Type
- 18.7.3. Personalization Type
- 18.7.4. Customer Category
- 18.7.5. Occasion/Purpose
- 18.7.6. Distribution Channel
- 18.7.7. Price Range
- 18.7.8. End-users Types
- 18.8. Rest of Africa Personalized Gifts Market
- 18.8.1. Country Segmental Analysis
- 18.8.2. Product Type
- 18.8.3. Personalization Type
- 18.8.4. Customer Category
- 18.8.5. Occasion/Purpose
- 18.8.6. Distribution Channel
- 18.8.7. Price Range
- 18.8.8. End-users Types
- 19. South America Personalized Gifts Market Analysis
- 19.1. Key Segment Analysis
- 19.2. Regional Snapshot
- 19.3. South America Personalized Gifts Market Size (Volume (Thousand Units) and Value (US$ Bn)), Analysis, and Forecasts, 2021-2035
- 19.3.1. Product Type
- 19.3.2. Personalization Type
- 19.3.3. Customer Category
- 19.3.4. Occasion/Purpose
- 19.3.5. Distribution Channel
- 19.3.6. Price Range
- 19.3.7. End-users Types
- 19.3.8. Country
- 19.3.8.1. Brazil
- 19.3.8.2. Argentina
- 19.3.8.3. Rest of South America
- 19.4. Brazil Personalized Gifts Market
- 19.4.1. Country Segmental Analysis
- 19.4.2. Product Type
- 19.4.3. Personalization Type
- 19.4.4. Customer Category
- 19.4.5. Occasion/Purpose
- 19.4.6. Distribution Channel
- 19.4.7. Price Range
- 19.4.8. End-users Types
- 19.5. Argentina Personalized Gifts Market
- 19.5.1. Country Segmental Analysis
- 19.5.2. Product Type
- 19.5.3. Personalization Type
- 19.5.4. Customer Category
- 19.5.5. Occasion/Purpose
- 19.5.6. Distribution Channel
- 19.5.7. Price Range
- 19.5.8. End-users Types
- 19.6. Rest of South America Personalized Gifts Market
- 19.6.1. Country Segmental Analysis
- 19.6.2. Product Type
- 19.6.3. Personalization Type
- 19.6.4. Customer Category
- 19.6.5. Occasion/Purpose
- 19.6.6. Distribution Channel
- 19.6.7. Price Range
- 19.6.8. End-users Types
- 20. Key Players/ Company Profile
- 20.1. American Greetings Corporation
- 20.1.1. Company Details/ Overview
- 20.1.2. Company Financials
- 20.1.3. Key Customers and Competitors
- 20.1.4. Business/ Industry Portfolio
- 20.1.5. Product Portfolio/ Specification Details
- 20.1.6. Pricing Data
- 20.1.7. Strategic Overview
- 20.1.8. Recent Developments
- 20.2. CafePress Inc.
- 20.3. Card Factory
- 20.4. Cimpress
- 20.5. Etsy Inc.
- 20.6. Hallmark Cards Inc.
- 20.7. Michael Kors Holdings Limited
- 20.8. Minted LLC
- 20.9. Moonpig.com Ltd.
- 20.10. Pandora A/S
- 20.11. Personalization Mall
- 20.12. Printful Inc.
- 20.13. Redbubble
- 20.14. Shutterfly Inc.
- 20.15. Snapfish by HP Inc.
- 20.16. Spencer Gifts
- 20.17. Swarovski AG
- 20.18. Things Remembered Inc.
- 20.19. Tiffany and Company
- 20.20. Uncommon Goods
- 20.21. Zazzle Inc.
- 20.22. Other Key Players
- 20.1. American Greetings Corporation
Note* - This is just tentative list of players. While providing the report, we will cover more number of players based on their revenue and share for each geography
Research Design
Our research design integrates both demand-side and supply-side analysis through a balanced combination of primary and secondary research methodologies. By utilizing both bottom-up and top-down approaches alongside rigorous data triangulation methods, we deliver robust market intelligence that supports strategic decision-making.
MarketGenics' comprehensive research design framework ensures the delivery of accurate, reliable, and actionable market intelligence. Through the integration of multiple research approaches, rigorous validation processes, and expert analysis, we provide our clients with the insights needed to make informed strategic decisions and capitalize on market opportunities.

MarketGenics leverages a dedicated industry panel of experts and a comprehensive suite of paid databases to effectively collect, consolidate, and analyze market intelligence.
Our approach has consistently proven to be reliable and effective in generating accurate market insights, identifying key industry trends, and uncovering emerging business opportunities.
Through both primary and secondary research, we capture and analyze critical company-level data such as manufacturing footprints, including technical centers, R&D facilities, sales offices, and headquarters.
Our expert panel further enhances our ability to estimate market size for specific brands based on validated field-level intelligence.
Our data mining techniques incorporate both parametric and non-parametric methods, allowing for structured data collection, sorting, processing, and cleaning.
Demand projections are derived from large-scale data sets analyzed through proprietary algorithms, culminating in robust and reliable market sizing.
Research Approach
The bottom-up approach builds market estimates by starting with the smallest addressable market units and systematically aggregating them to create comprehensive market size projections.
This method begins with specific, granular data points and builds upward to create the complete market landscape.
Customer Analysis → Segmental Analysis → Geographical Analysis
The top-down approach starts with the broadest possible market data and systematically narrows it down through a series of filters and assumptions to arrive at specific market segments or opportunities.
This method begins with the big picture and works downward to increasingly specific market slices.
TAM → SAM → SOM


Research Methods
Desk / Secondary Research
While analysing the market, we extensively study secondary sources, directories, and databases to identify and collect information useful for this technical, market-oriented, and commercial report. Secondary sources that we utilize are not only the public sources, but it is a combination of Open Source, Associations, Paid Databases, MG Repository & Knowledgebase, and others.
- Company websites, annual reports, financial reports, broker reports, and investor presentations
- National government documents, statistical databases and reports
- News articles, press releases and web-casts specific to the companies operating in the market, Magazines, reports, and others
- We gather information from commercial data sources for deriving company specific data such as segmental revenue, share for geography, product revenue, and others
- Internal and external proprietary databases (industry-specific), relevant patent, and regulatory databases
- Governing Bodies, Government Organizations
- Relevant Authorities, Country-specific Associations for Industries
We also employ the model mapping approach to estimate the product level market data through the players' product portfolio
Primary Research
Primary research/ interviews is vital in analyzing the market. Most of the cases involves paid primary interviews. Primary sources include primary interviews through e-mail interactions, telephonic interviews, surveys as well as face-to-face interviews with the different stakeholders across the value chain including several industry experts.
| Type of Respondents | Number of Primaries |
|---|---|
| Tier 2/3 Suppliers | ~20 |
| Tier 1 Suppliers | ~25 |
| End-users | ~25 |
| Industry Expert/ Panel/ Consultant | ~30 |
| Total | ~100 |
MG Knowledgebase
• Repository of industry blog, newsletter and case studies
• Online platform covering detailed market reports, and company profiles
Forecasting Factors and Models
Forecasting Factors
- Historical Trends – Past market patterns, cycles, and major events that shaped how markets behave over time. Understanding past trends helps predict future behavior.
- Industry Factors – Specific characteristics of the industry like structure, regulations, and innovation cycles that affect market dynamics.
- Macroeconomic Factors – Economic conditions like GDP growth, inflation, and employment rates that affect how much money people have to spend.
- Demographic Factors – Population characteristics like age, income, and location that determine who can buy your product.
- Technology Factors – How quickly people adopt new technology and how much technology infrastructure exists.
- Regulatory Factors – Government rules, laws, and policies that can help or restrict market growth.
- Competitive Factors – Analyzing competition structure such as degree of competition and bargaining power of buyers and suppliers.
Forecasting Models / Techniques
Multiple Regression Analysis
- Identify and quantify factors that drive market changes
- Statistical modeling to establish relationships between market drivers and outcomes
Time Series Analysis – Seasonal Patterns
- Understand regular cyclical patterns in market demand
- Advanced statistical techniques to separate trend, seasonal, and irregular components
Time Series Analysis – Trend Analysis
- Identify underlying market growth patterns and momentum
- Statistical analysis of historical data to project future trends
Expert Opinion – Expert Interviews
- Gather deep industry insights and contextual understanding
- In-depth interviews with key industry stakeholders
Multi-Scenario Development
- Prepare for uncertainty by modeling different possible futures
- Creating optimistic, pessimistic, and most likely scenarios
Time Series Analysis – Moving Averages
- Sophisticated forecasting for complex time series data
- Auto-regressive integrated moving average models with seasonal components
Econometric Models
- Apply economic theory to market forecasting
- Sophisticated economic models that account for market interactions
Expert Opinion – Delphi Method
- Harness collective wisdom of industry experts
- Structured, multi-round expert consultation process
Monte Carlo Simulation
- Quantify uncertainty and probability distributions
- Thousands of simulations with varying input parameters
Research Analysis
Our research framework is built upon the fundamental principle of validating market intelligence from both demand and supply perspectives. This dual-sided approach ensures comprehensive market understanding and reduces the risk of single-source bias.
Demand-Side Analysis: We understand end-user/application behavior, preferences, and market needs along with the penetration of the product for specific application.
Supply-Side Analysis: We estimate overall market revenue, analyze the segmental share along with industry capacity, competitive landscape, and market structure.
Validation & Evaluation
Data triangulation is a validation technique that uses multiple methods, sources, or perspectives to examine the same research question, thereby increasing the credibility and reliability of research findings. In market research, triangulation serves as a quality assurance mechanism that helps identify and minimize bias, validate assumptions, and ensure accuracy in market estimates.
- Data Source Triangulation – Using multiple data sources to examine the same phenomenon
- Methodological Triangulation – Using multiple research methods to study the same research question
- Investigator Triangulation – Using multiple researchers or analysts to examine the same data
- Theoretical Triangulation – Using multiple theoretical perspectives to interpret the same data

Custom Market Research Services
We will customise the research for you, in case the report listed above does not meet your requirements.
Get 10% Free Customisation